4240
Altered intrinsic brain functional network dynamics in drug-naïve Parkinson's disease patients with excessive daytime sleepiness1Peking University Shenzhen Hospital, Shenzhen, China, 2Philips Healthcare (Shenzhen) Ltd, Shenzhen, China
Synopsis
Keywords: Functional Connectivity, fMRI (resting state), dynamic brain functional connectivity
Motivation: Excessive daytime sleepiness (EDS) is a frequent nonmotor symptoms in Parkinson's disease (PD) patients. Previous studies on EDS used static analyses that ignored the temporal evolution of resting-state functional magnetic resonance imaging signals.
Goal(s): This study aimed to identify dynamic functional network connectivity (dFNC) characteristics in PD with EDS (PD-EDS) patients.
Approach: The sliding window approach, k-means clustering and independent component analysis were applied to estimate dFNC parameters.
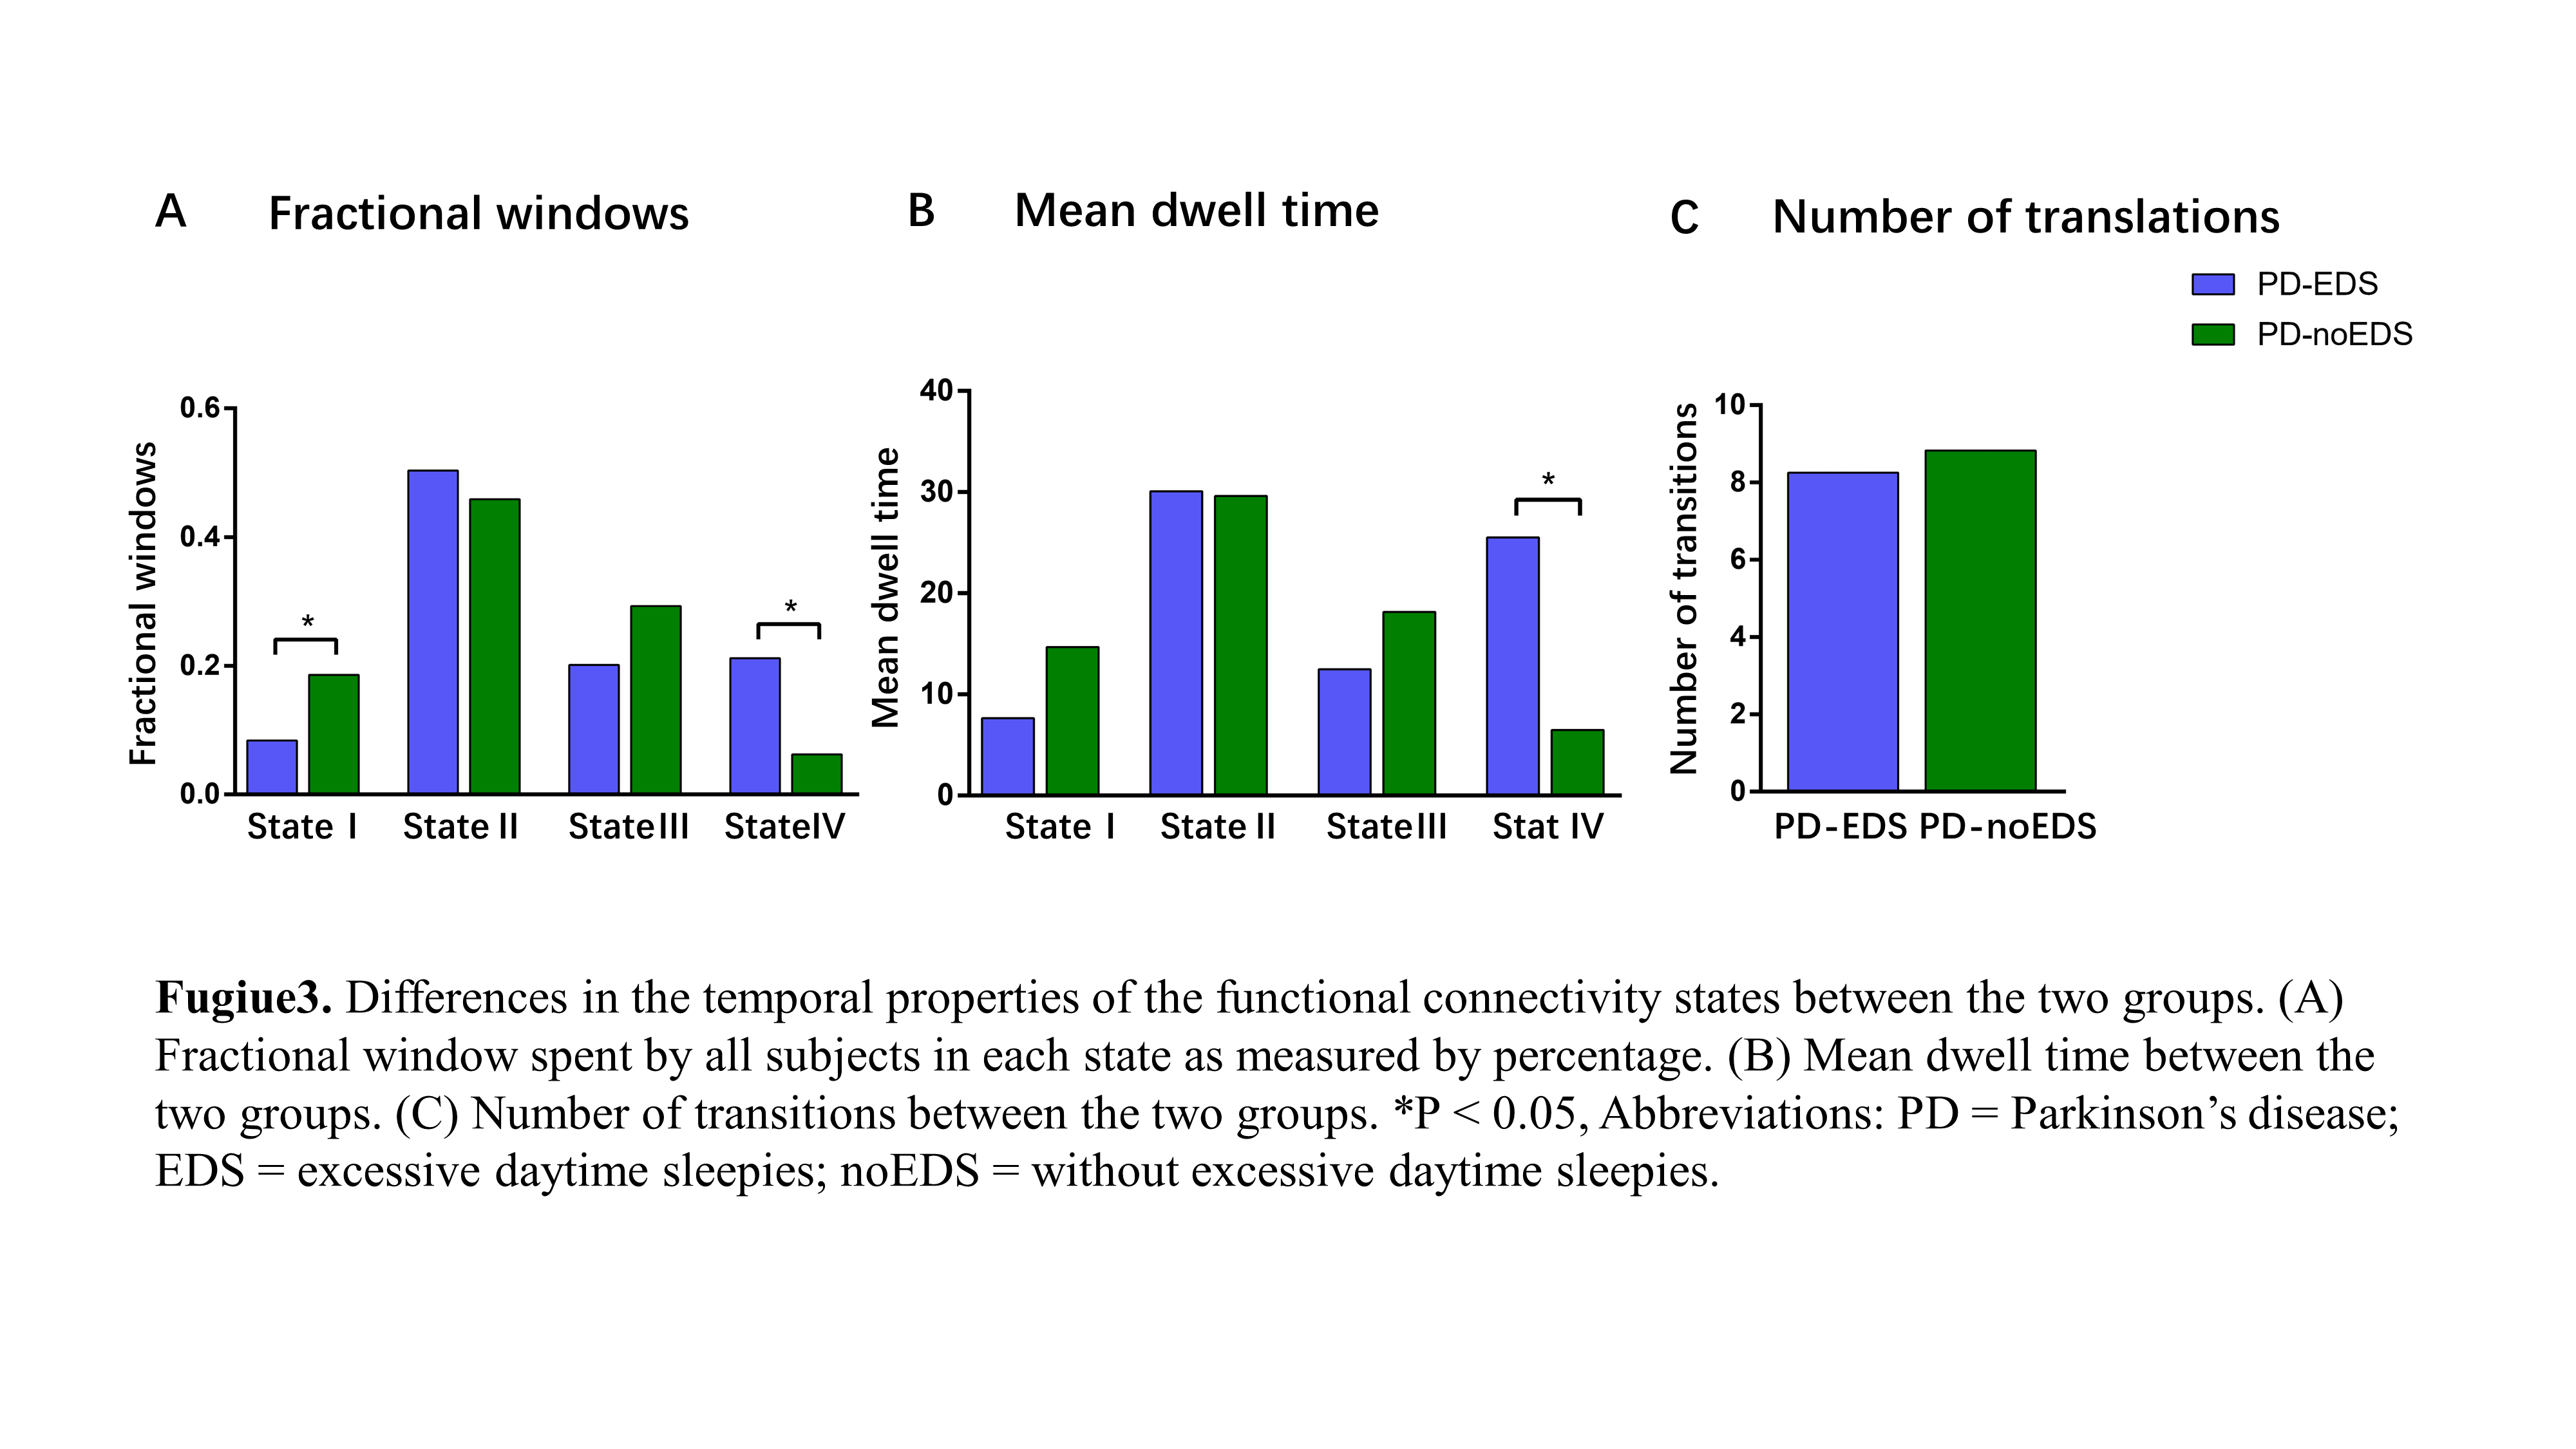
Results: The PD-EDS patients showed increased fractional time and mean dwell time in state IV. The strong connectivity within and between the sensorimotor and visual network was related to EDS in PD patients.
Impact: Our research provided new insights into the neural mechanisms underlying PD patients with EDS. The alterations of dynamic functional connectivity may serve as biomarkers of the pathophysiological features of PD with EDS patients.
Introduction
Excessive daytime sleepiness (EDS) is a frequent nonmotor symptom of Parkinson's disease1 (PD), which seriously affects the quality of life of PD patients and exacerbates other nonmotor symptoms. Previous studies have used the static resting-state functional magnetic resonance imaging (rs-fMRI) analyses to explore the pathogenesis of EDS in PD patients, which were under the assumption that the intrinsic fluctuations during MRI scans were stationary. However, the functional connectivity of brain networks changes during rs-fMRI scanning sequences2. The dynamic functional network connectivity (dFNC) analysis can capture time-varying connections over short time scales and may reveal complex functional tissues in the brain. This study aimed to identify the dFNC characteristics in PD with EDS (PD-EDS) patients in order to better explain the underlying neuropathological mechanisms of it.Methods
Based on rs-fMRI data on 3.0 T MRI scanners (Siemens, Germany) from 16 PD-EDS patients and 41 PD without EDS (PD-noEDS) patients, we applied the sliding window approach, k-means clustering and independent component analysis to estimate the temporal properties of functional network connectivity, including the fractional time, mean dwell time and number of transitions. Then, the correlations between the altered temporal properties and the Epworth sleepiness scale (ESS) scores were assessed.Results
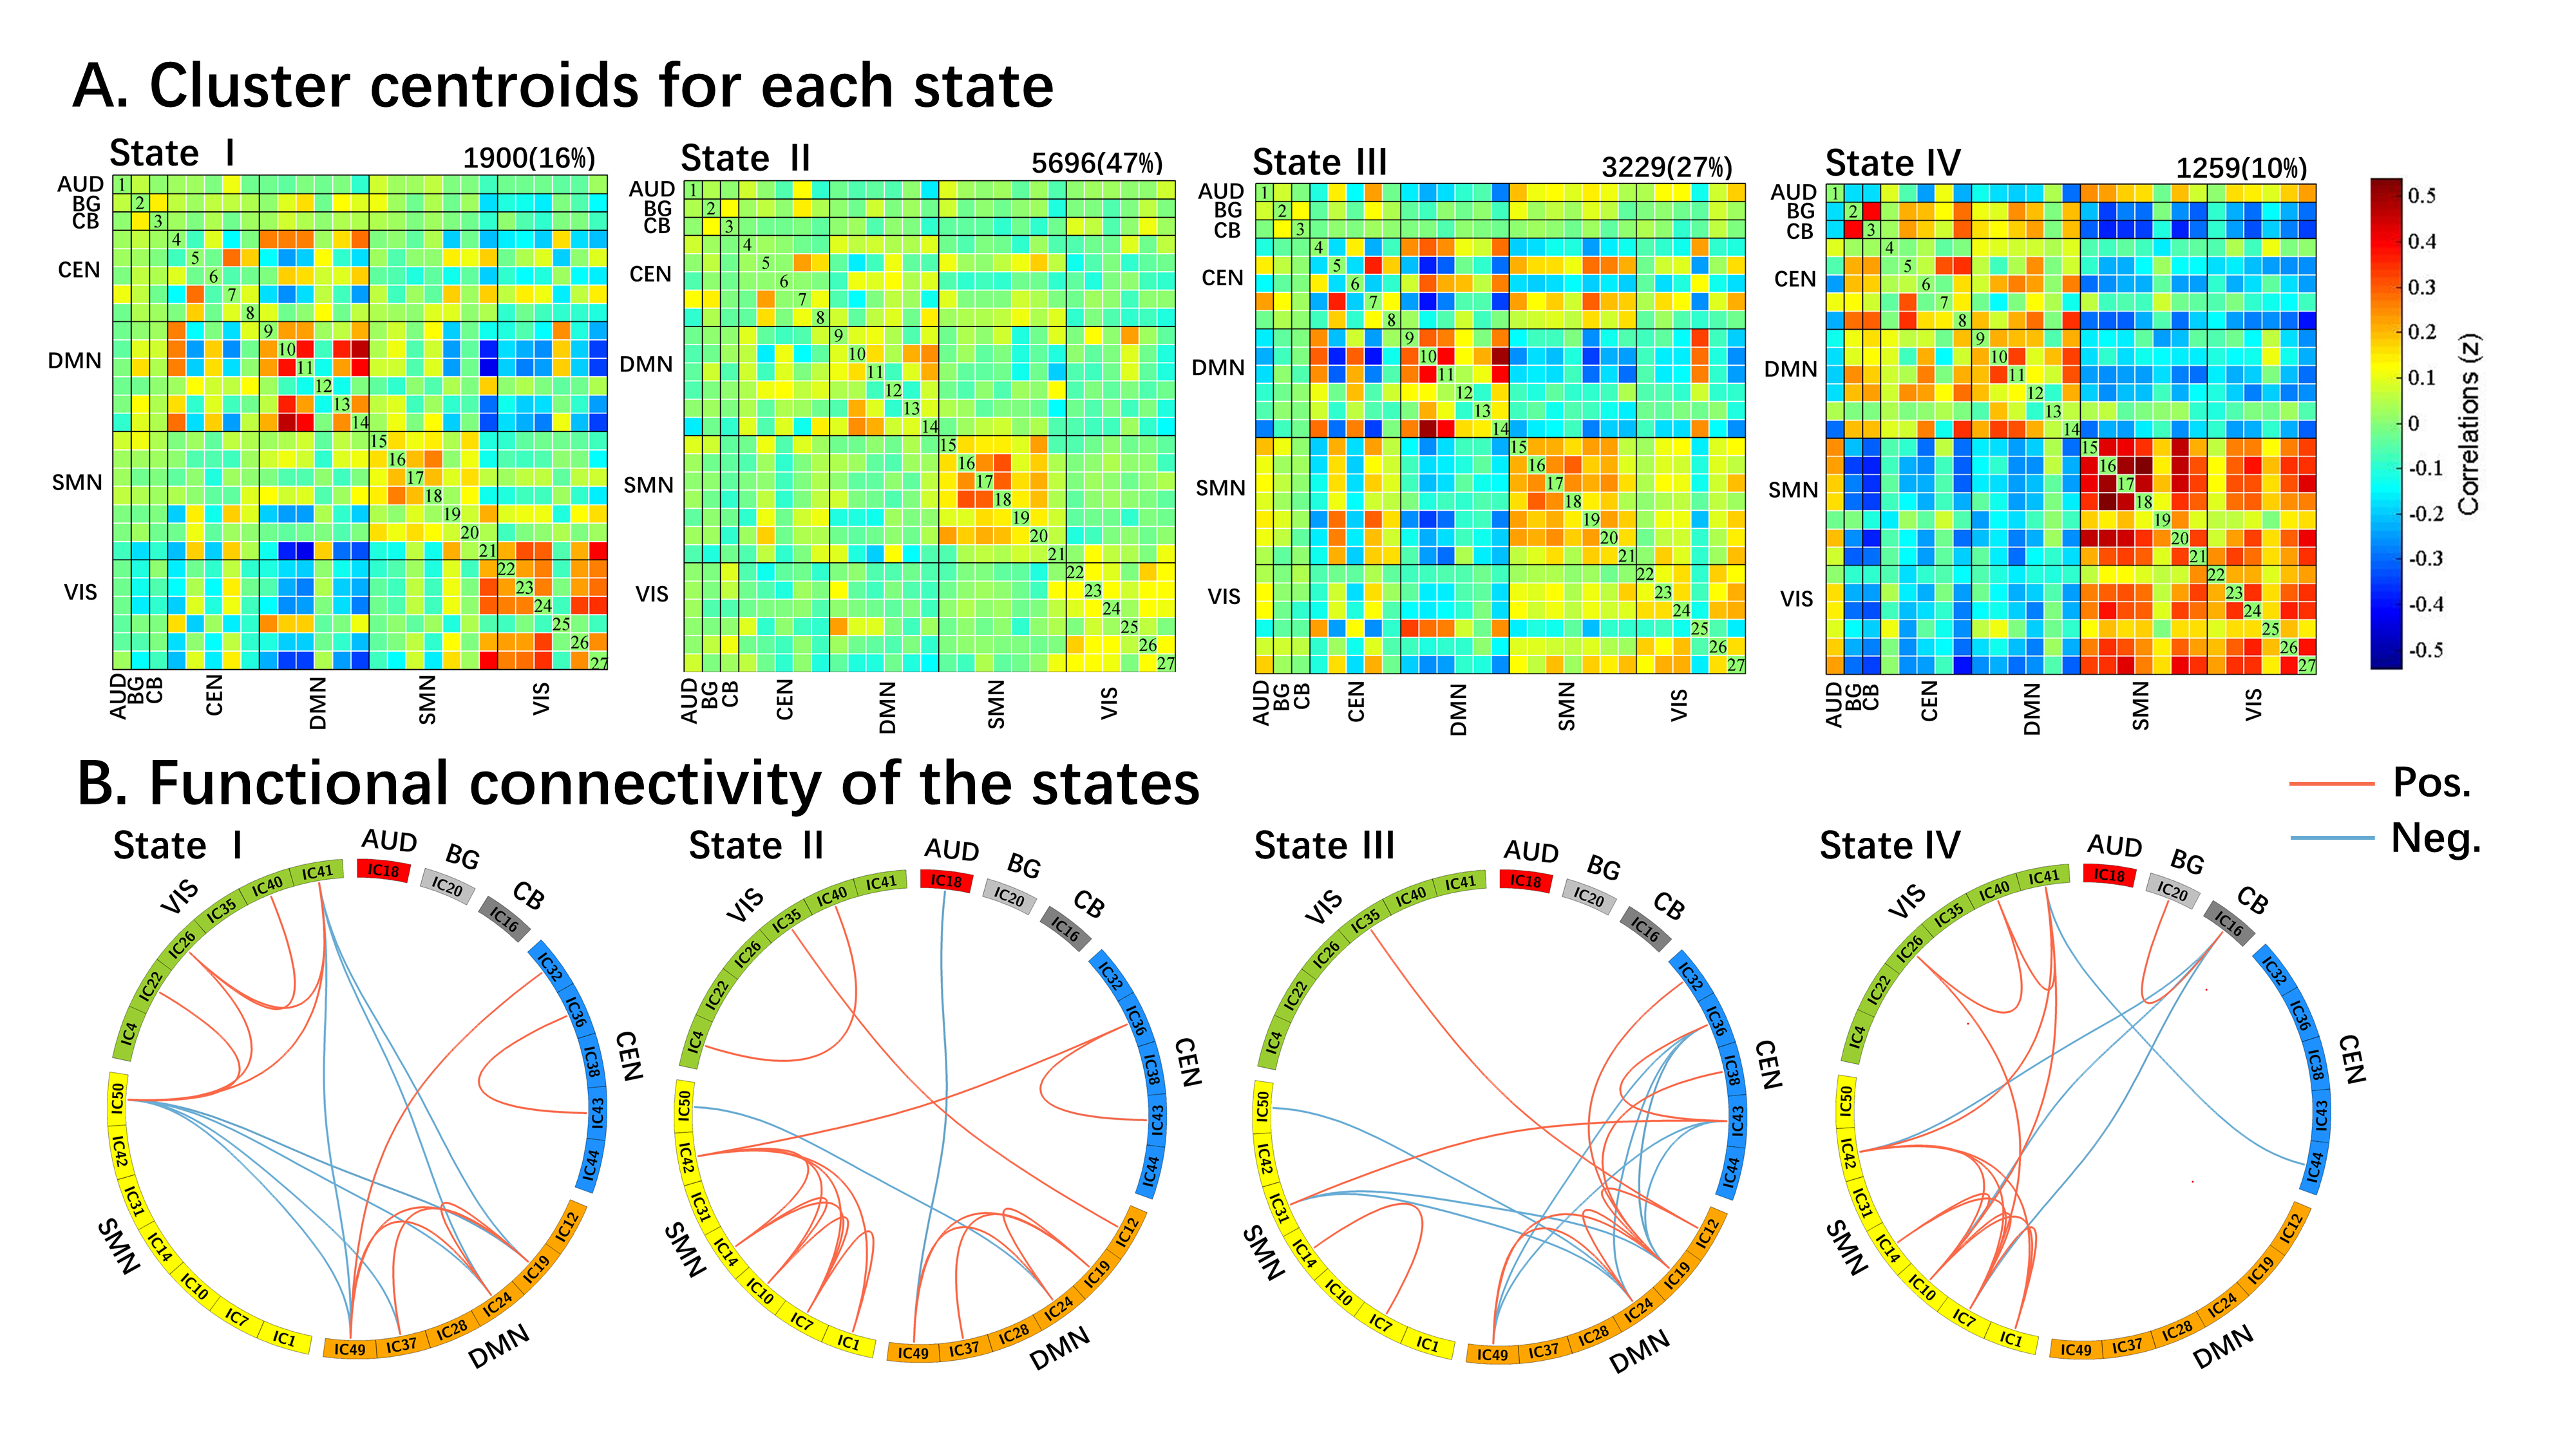
Four distinct functional connectivity states were identified in PD patients. Compared with PD-noEDS group, PD-EDS group showed increased the fractional time and mean dwell time in state IV (Figure 1) (P = 0.015, P = 0.027, FDR-corrected), which was characterized by strong connectivity in the sensorimotor (SMN) and visual (VIS) networks (Figure 2), and reduced fractional time in state I (Figure 1) (P = 0.022, FDR-corrected), which was characterized by strong positive connectivity intranetwork of the default mode network (DMN) and VIS, while negative connectivity internetwork between the DMN and VIS (Figure 2). Additionally, the ESS scores were positively correlated with fraction time in state IV.Discussion
Sensory information processing occurs during sleep. Different sensory modalities encoded by particular pathways or networks may modify physiological characteristics in the waking and sleep states3. Both the SMN and VIS are important sensory networks. In our study, PD-EDS group patients spent more time in state IV. The state IV was characterized by higher activity and integration of information transmission in the SMN and VIS regions. Moreover, the fraction time in state IV was positively correlated with the ESS scores. Our findings showed that the SMN and VIS increased the integration of visual processes and sensory processes in the patients with PD-EDS. This may suggest that the SMN and VIS actively modulate sleep and wakefulness to compensate for the damage caused by EDS. Our findings suggest that the fractional time in state IV is a potential valuable biomarker for PD-EDS.The DMN is a highly integrated task-negative network that is activated when people are in waking resting states and is responsible for conscious awareness and self-referential introspective states4,5. The VIS is one of the most important sensory networks. In our study, compared to the patients in the PD-noEDS group, the patients in the PD-EDS group showed significantly decreased fractional time in state I. The state I was characterized by strong positive connectivity intranetwork of the DMN and VIS, while negative connectivity internetwork between the DMN and VIS. These findings suggested that PD-EDS patients may achieve a more stable state by strengthening the internal regulation of DMN and VIS. However, we found state I was also characterized by negative connectivity internetwork between the DMN and VIS. This may be an interesting finding. Judging from the strong negative connectivity between the DMN and VIS in state I, the DMN and VIS were functionally competitive and inhibitory networks. Therefore, we speculated that this may be due to the competition between the DMN and VIS networks for brain resource allocation when maintaining brain stability. Nevertheless, this finding needs to be further verified by future studies.
Conclusion
These findings revealed that SMN- and VIS-dominated patterns were specific network aggregation states associated with PD-EDS. Moreover, the duration of this state correlated with the severity of EDS, suggesting that SMN- and VIS-dominated patterns may compensate for EDS damage through high-intensity information output. Our research provided new insights into the neural mechanisms underlying PD-EDS, and the SMN- and VIS-dominated patterns may serve as biomarkers of the pathophysiological features of PD-EDS.Acknowledgements
We are grateful to the patients who participated in the PPMI study, the researchers who contributed, and the Michael J. Fox Foundation. PPMI–a public-private partnership–is funded by the Michael J. Fox Foundation for Parkinson’s Research and funding partners, including 4D Pharma, AbbVie Inc. AcureX Therapeutics, Allergan, Amathus Therapeutics, Aligning Science Across Parkinson’s (ASAP), Avid Radiopharmaceuticals, Bial Biotech, Biogen, BioLegend, Bristol Myers Squibb, Calico Life Sciences LLC, Celgene Corporation, DaCapo Brainscience, Denali Therapeutics, The Edmond J. Safra Foundation, Eli Lilly and Company, GE Healthcare, GlaxoSmithKline, Golub Capital, Handl Therapeutics, Insitro, Janssen Pharmaceuticals, Lundbeck, Merck & Co., Inc., Meso Scale Diagnostics, LLC, Neurocrine Biosciences, Pfizer Inc., Piramal Imaging, Prevail Therapeutics, F. Hoffmann-La Roche Ltd., and its affiliated company Genentech Inc., Sanofi Genzyme, Servier, Takeda Pharmaceutical Company, Teva Neuroscience, Inc., UCB, Vanqua Bio, Verily Life Sciences, Voyager Therapeutics, Inc., and Yumanity Therapeutics, Inc.References
1. Liu H, Li J, Wang X, et al. Excessive Daytime Sleepiness in Parkinson's Disease. Nat Sci Sleep 2022;14:1589-1609.
2. Hutchison RM, Womelsdorf T, Allen EA, et al. Dynamic functional connectivity: promise, issues, and interpretations. Neuroimage 2013;80:360-378.
3. Velluti RA. Interactions between sleep and sensory physiology. Journal of sleep research 1997;6(2):61-77.
4. Qin P, Wu X, Huang Z, et al. How are different neural networks related to consciousness? Ann Neurol 2015;78(4):594-605.
5. Mak LE, Minuzzi L, MacQueen G, Hall G, Kennedy SH, Milev R. The Default Mode Network in Healthy Individuals: A Systematic Review and Meta-Analysis. Brain Connect 2017;7(1):25-33.
Figures