4239
Brain electro/hydrodynamic drive of vasomotor waves inverts locally in NREM sleep.1OFNI/Diagnostic Imaging, Oulu University Hospital, Oulu, Finland
Synopsis
Keywords: fMRI Analysis, Neurofluids, Consciousness
Motivation: Vasomotor waves increase in sleep but their causal impact on brain electrical activity and hydrodynamics is not understood.
Goal(s): We wanted to find out what is driving sleep related glymphatic solute transport.
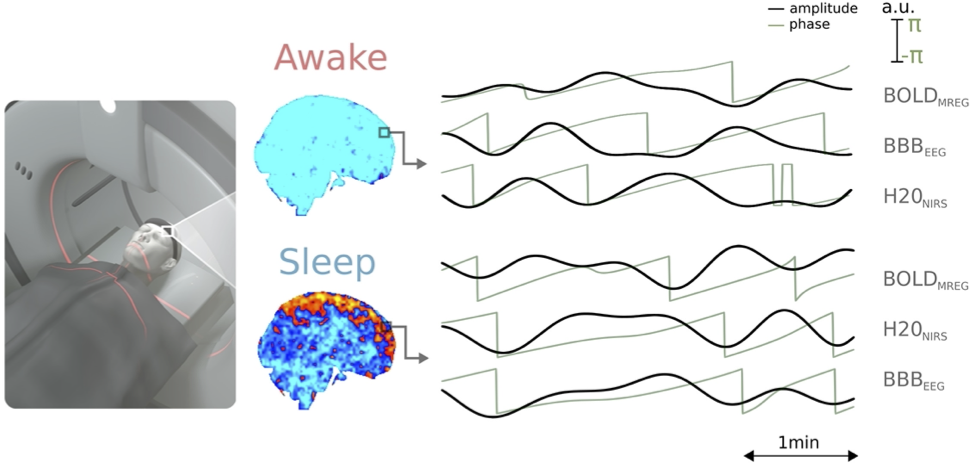
Approach: We used multimodal 3D whole brain MREG, dcEEG and waterNIRS simultaneously to find out what VLF < 0.1 Hz pulsation is driving the other(s).
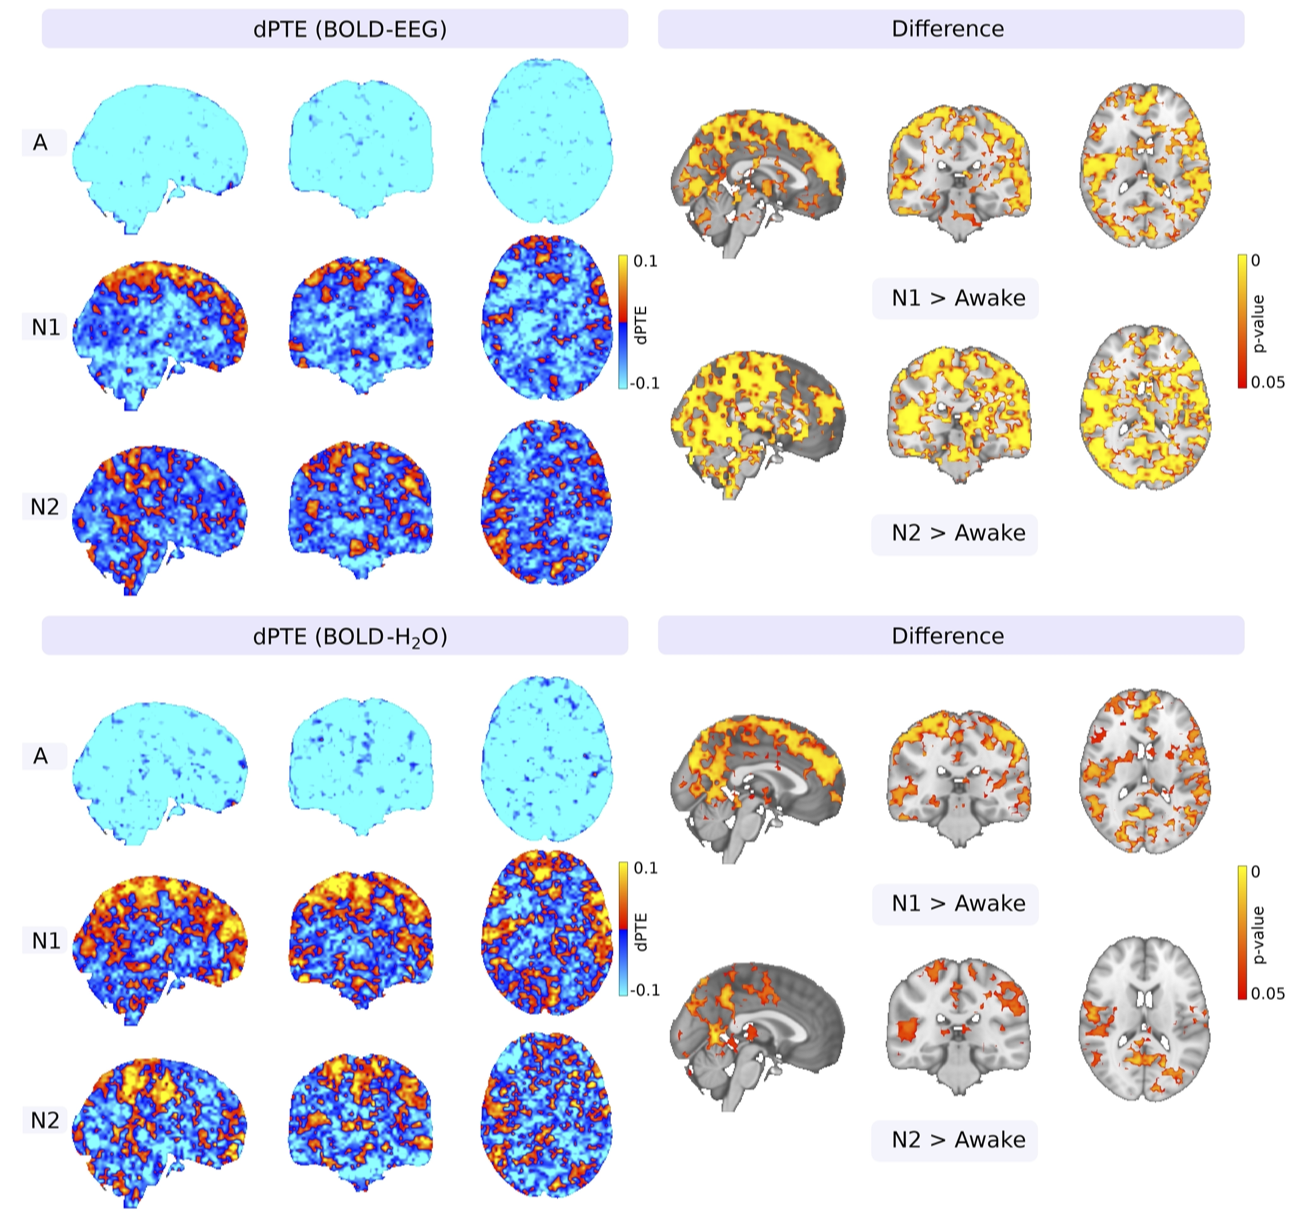
Results: In sleep the normal causal electro/hydrodynamic drive of the vasomotor BOLD waves reverses locally near upper parasagital and deeper structures.
Impact: The driver of the increase brain solute transport in human sleep has been unknown. In out ultrafast multimodal MREG study, we show significant reversals in the causal drive of vasomotor waves locally.
Background.
Background. Sleep increases brain solute convection, and this has been related to increased power of physiological brain pulsations1,2,3. In this study we investigated how the causal connection between the brain water concentrations (wNIRS) and dcEEG derived blood-brain-barrier (BBBEEG) potential dynamics4 is altered with respect to venous vasomotor BOLD fluctuations. We hypothesized that the increased brain solute transport is driven by increased vasomotor BOLD waves. To test the hypothesis, we statistically compared the causal relations of the brain water wNIRS and electrodynamic BBBEEG signals during normal awake and increased glymphatic convection in NREM sleep.Methods. After approved informed consent, healthy subjects (n=21 awake, n=19 EEG verified sleep) were scanned with: a) water sensitized near-infrared spectroscopy (wNIRS) to measure brain water concentration5 in synchrony with b) ultrafast MREG scanning (TR 100 ms, 3D whole brain, flip angle 5°) reflecting brain non-aliased venous BOLD fluctuations6,and c) 256 ch dcEEG recording (EGI) for BBBEEG. Standard FSL pre-processing was used on MREG BOLD data, dcEEG was corrected also with standard fMRI artifact removal. Water concentration wNIRS was calculated using Beer-Lambert law from 3 NIR wavelengths (690 nm, 830 nm and water sensitive 980 nm). The simultaneous dcEEG, wNIRS and MREG data were segmented into 2 min EEG-verified sleep segments and bandpass filtered to very low frequency (VLF, 0.01-0.08 Hz). Hilbert transformation was applied for both VLF traces to extract instantaneous phase time-series. Phase transfer entropy (PTE)7 was then used to study the causal directional interactions with differential form (dPTE). FSL randomise (TFCE) with 5k permutations p < 0.05 was used for statistical inferences in brain images of altered dPTE causal drive.
Results. In awake state the brain H2O-signal and dcEEG reflecting BBBEEG potential causally precede and drive VLF BOLD signal wave amplitude and phase transitions over the whole brain, blue color c.f. Fig 1-2. However, in N1 and N2 sleep this interaction inverts; the VLF BOLD waves starts to causally drive both H2O signal and BBB potential regionally, c.f. Fig’s 1-2 hot colors in cortex. In especially the BBBEEG the spatial extent in N2 > N1 and co-localizes with sensory and parasagittal areas known to have increased glymphatic slow delta activity1,2. Deeper areas of the brain seem to maintain the normal causal drive of BOLD in even in N1-N2 sleep.
Conclusion: Vasomotor waves causal relation to electro/hydrodynamic signals inverts in NREM sleep in parasagittal areas of slow delta sleep. Vasomotor waves start to drive glymphatic water and electrolyte convection over BBB.
Acknowledgements
JAES-Foundation, Aivosäätiö, VTR & Research Council of Finland are cordially acknowledged for their grant support.References
1. Xie et al., 2013. Science 342:373–377.
2. Helakari et al. 2022. J. Neurosci. 42(12):2503–2515.
3. Nedergaard et al., 2013. Science, 340(6140), 1529-1530.
4. Korhonen et al., 2014. Brain Connect. 4, 677–689.
5. Myllylä et al., 2018. Journal of biophotonics, 11(8), e201700123.
6. Kiviniemi et al., 2016. J Cereb Blood Flow Metab 36:1033–1045.
7. Lobier et al., 2014. NeuroImage. Jan 15;85 Pt 2:853-72.
Figures