4238
Spontaneous activity changes in brain networks following night shift–related sleep deprivation: A voxel‐wise degree centrality analysis1Xi`an DaXing Hospital, Xi`an, China
Synopsis
Keywords: fMRI Analysis, Brain
Motivation: This study aims to explore the spontaneous activity of the radiologists brain following night shift–related sleep deprivation (SD).
Goal(s): To study the potential brain network activity in radiologists following night shift–related SD by the degree centrality (DC) method.
Approach: Radiologists following night shift–related sleep deprivation and seven days' rest were recruited and analyzed by the voxel‐wise DC analysis.
Results: The DC values changed throughout the brain after seven days of rest after a night shift.
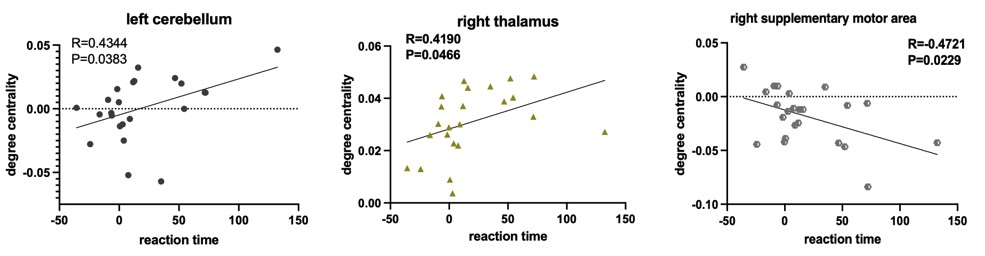
The left cerebellum and right thalamus were positively correlated with reaction time, and the right supplementary motor area (SMA) was negatively correlated with reaction time
Impact: Identifying DC variability abnormalities may broaden our understanding of neural substrates underlying night shift-related SD function alterations, The premise is to promote health and improve the efficiency of night shift work.
Introduction
Degree centrality (DC), a voxel‐level measurement of network connectivity, is one of the persuasive and reliable methods among nodal network metrics. DC distinguishes the node with the most connection by calculating the number of direct links to others to determine the relative importance of nodes within the network1. The larger the DC value is, the more brain regions are connected to the node of interest. In this study, we employed the voxel‐wise DC analysis to explore the brain-functional abnormalities in radiologists following night shift–related sleep deprivation. Further, we sought to determine whether these abnormalities were associated with the clinical characteristic scores of these participants.Methods
We recruited 24 healthy right-handed volunteers (14 men, aged 23 to 46 years, mean age 28.12± 3.69 years) from the radiology department. All participants had regular sleep patterns for at least 8 days. We performed MRI examination using a 3T MR scanner (MAGNETOM Prisma, Siemens Healthcare, Erlangen, Germany) with 64-channel head and neck coil. During the scan, foam padding and earplugs were prepared to restrict the motion of the head and curtail scanner noise. Functional images were collected with an echo‐planar imaging (EPI) sequence with the following parameters: TR = 1000 ms, TE = 38 ms, flip angle = 52°, FOV = 208 mm × 208 mm, slice thickness = 2 mm, 72 slices, total volumes = 600. Imaging data were preprocessed and analyzed on DPABI_V6.1 software. Pearson's correlation coefficient matrix was generated by calculating the temporal correlation between a gray matter mask voxel and all other voxels within the brain. Then, to eliminate the low time correlation interference caused by signal noise, we set the threshold of Pearson's correlation coefficient to r > 0.25. Our study utilized binary DC values within the brain network to conduct subsequent statistical analyses. Afterwards, the fisher‐z transformation was served to convert the voxel‐wise DC values into a z‐score graph to enhance normality. Ultimately, all individual DC graphs were spatially smoothed together in the preprocessing stage (FWHM = 6 × 6 × 6 mm3). Finally, the DC map of each participant were used for paired t-test between night shift and seven days of rest. All statistical significance complied with a cluster‐level p value <0.05 after false discovery rate (FDR). Before each MR scan, a Pyramid Vision Transformer(PVT) test was conducted on each patient, using PC-PVT2.02. Participants’ demographic factors and clinical characteristics (i.e., age, sex, Pittsburgh Sleep Quality Index, PVT test results) were also recorded. The DC values of abnormal brain regions were extracted for further correlation analysis.Results
In the present study, we found that DC values decreased in the left cerebellum, bilateral thalamus, bilateral posterior cingulate, while increased in the right fusiform gyrus, left paracentral lobule, left precentral gyrus, and right supplementary motor area after the night shift as compared to the data after seven days' rest. Figure 1 showed the regions in the brain with altered DC values. The reaction time was negatively correlated with the DC signal value of the left cerebellum (r=0.43, p=0.03), right thalamus (r=0.42, p=0.04), and right supplementary motor area (r=-0.47, p=0.02) (Figure 2).Discussion and Conclusion
This study analyzed the alterations in DC for the radiologists with night shift as compared to the data after seven days' rest based on rs-fMRI data. Recent studies have shown that it plays an important role in cognition and movement. Changes in the cerebellum may affect the corresponding functions, thereby affecting work efficiency and error probability3,4.In summary, the present results suggest that radiologists with night shift is associated with DC abnormalities in brain regions associated with sensorimotor activity, emotional processing, and cognitive impairment. This study may help us to formulate appropriate night shift policies in the future, it is important to understand the challenges faced by radiologists during night shifts.Acknowledgements
No acknowledgement found.References
1. Yang Y, Dong Y, Chawla NV. Predicting node degree centrality with the node prominence profile. Sci Rep. 2014 Nov 28;4:7236. 2. Reifman, J., Kumar, K., Khitrov, M. Y., et al. (2018). PC-PVT 2.0: An updated platform for psychomotor vigilance task testing, analysis, prediction, and visualization. Journal of neuroscience methods, 304, 39–45. 3. Spampinato, D. A., Casula, E. P., & Koch, G. (2023). The Cerebellum and the Motor Cortex: Multiple Networks Controlling Multiple Aspects of Behavior. The Neuroscientist : a review journal bringing neurobiology, neurology and psychiatry, 10738584231189435. Advance online publication. 4. Mundorf, A., Siebert, A., Desmond, J. E., & Peterburs, J. (2023). The role of the cerebellum in internet gaming disorder-A systematic review. Addiction biology, 28(10), e13331.Figures