4234
Impact of slice-specific z-shimming on T2*-weighted EPI for functional MRI of the human spinal cord at 7 Tesla1Max-Planck-Institute for Human Cognitive and Brain Sciences, Leipzig, Germany, 2Stanford University, Stanford, CA, United States, 3Systems Neuroscience, University Medical Center Hamburg-Eppendorf, Hamburg, Germany
Synopsis
Keywords: fMRI Acquisition, fMRI, z-shim
Motivation: Slice-specific z-shimming reduces signal losses in T2*-weighted EPI of the human spinal cord at 3T.
Goal(s): To investigate its impact for acquisitions at 7T performed with thinner slices and shorter echo times that are less susceptible to signal losses.
Approach: EPI images (16 slices, 0.8×0.8×3.0 mm3) with 31 different z-shim settings compensating linear field inhomogeneities within ±0.3 mT m-1 were acquired. For each slice, the image with the maximum signal in the spinal cord was determined and compared to the image without z-shim.
Results: Averaged across 20 healthy volunteers, slice-specific z-shimming significantly improves overall EPI signal intensity and reduces signal variations across slices.
Impact: Z-shimming can improve the signal intensity and homogeneity of T2*-weighted EPI of the human cervical spinal cord at 7T and could thus help to improve the performance of spinal cord fMRI.
Introduction
Functional MRI of the human spinal cord has gained increased attention in recent years allowing for a non-invasive investigation of spinal processing and transmission of somatosensory as well as nociceptive input and motor output. Corresponding studies have been performed at 3 Tesla or below, but with neck coils becoming available for human applications at higher field strengths, interest to perform spinal cord fMRI at 7 Tesla has risen1. At 3 T, it has been shown that applying slice-specific z-shims improves the signal intensity2, yet so far, its impact and feasibility at 7 T has not been evaluated. On the one hand, one would expect that susceptibility-induced field inhomogeneities are increased due to the higher field strength, but on the other hand the use of thinner slices and shorter echo times might lead to decreased through-slice dephasing.In this work, T2*-weighted EPI data without and with slice-specific z-shim were compared in a group of healthy volunteers with respect to the signal intensity in the cervical spinal cord at 7T.
Methods
We acquired data from 20 healthy volunteers on a 7 T whole-body MR system (Terra, Siemens Healthineers, Erlangen, Germany) in single-transmit mode equipped with a 24-channel transmit/receive cervical-spine coil (MRI.Tools, Berlin, Germany). In order to mitigate large-scale field variations arising from air-tissue interfaces at the neck, passive B0-shimming was realized by placing pads filled with liquid perfluorocarbon (SatPad Inc., West Chester, USA) around the neck. EPI data were acquired with a pulse sequence supporting slice-specific z-shimming2 and the following parameters: 16 transversal slices, 0.8×0.8×3.0 mm3 voxel size, TR of 1123ms, TE of 27ms (with a partial Fourier factor of 6/8 and GRAPPA acceleration factor of 3 involving FLASH-based reference scans). 31 z-shim settings compensating gradients within ±0.3 mT m-1 were covered in a single acquisition with images #1 and #31 corresponding to the minimum and maximum z-shim value, respectively, and #16 representing the case of no z-shim. For each slice, the z-shim setting providing the maximum spinal cord signal amplitude was determined in an automated manner, using a previously developed procedure3. Data without z-shim (image #16) and with optimum z-shim were compared with respect to the signal intensity in the spinal cord as described previously3.Results and Discussion
Example images with different z-shims are presented in Figure 1 for two slices of the same volunteer with the image providing the maximum signal intensity in the spinal cord for each slice marked in blue. The optimum z-shim settings differ strongly between slices (‒0.10 mT m‒1 vs. +0.14 mT m‒1 for the compensated gradient), indicating that slice-specific z-shim settings are required for signal optimization.To demonstrate the effect of z-shimming on spinal cord EPI image quality, Figure 2 depicts single-volume data from two further volunteers, once with z-shimming (blue) and once without (red). Without z-shimming, several slices present with reduced signal intensity and dorsally-located signal drop-out, both of which are improved with the application of slice-specific z-shims.
Figure 3 depicts the distribution of slice-specific z-shim indices across the group of 20 participants (left), as well as in all individual participants (right): a large range of values is necessary to compensate for through-slice dephasing and the setting of no z-shim is only providing optimal signal intensity in approximately 12% of the slices.
At the group-level, we observed an average increase in spinal cord signal intensity across participants of 16.3% (range 6 to 46%) due to z-shimming. Such a signal increase is similar to what has been observed at 3T2, though now at a higher field strength with thinner slices (3.0 mm vs 5.0 mm) and shorter echo time (27 ms vs 40 ms). This increase was evident for every single participant and thus highly significant (t = 8.6, p < .001; Figure 4). When considering signal intensity variations across slices (which should be mitigated by slice-specific z-shimming), we observed a variability decrease of 38.2% (range -13 to 69%) due to z-shimming. This decrease was observed in 18 out of 20 participants and was also highly significant at the group level (t = 5.2, p < .001; Figure 4). Both effect sizes were large, with Cohen's d of .85 (signal intensity) and .95 (signal intensity variation), speaking for their relevance.
Conclusions
Even for slices as thin as 3.0 mm and echo times below 30 ms, slice-specific z-shimming can significantly reduce through-slice dephasing and increase the signal intensity in the human spinal cord at 7 Tesla, thus being able to improve spinal cord fMRI applications at ultra-high fields.Acknowledgements
FE is supported by the Max Planck Society and the European Research Council (under the European Union’s Horizon 2020 research and innovation programme; grant agreement No 758974).References
1. Barry RL, Vannesjo SJ, By S, Gore JC, Smith SA. Spinal cord MRI at 7T. NeuroImage 2018; 168: 437-451.
2. Finsterbusch J, Eippert F, Büchel C. Single, slice-specific z-shim gradient pulses improve T2*-weighted imaging of the spinal cord. NeuroImage 2012; 59: 2307–15.
3. Kaptan M, Vannesjo SJ, Mildner T, Horn U, Hartley-Davies R, Oliva V, Brooks JCW, Weiskopf N, Finsterbusch J, Eippert F. Automated Slice-Specific z-Shimming for Functional Magnetic Resonance Imaging of the Human Spinal Cord. Human Brain Mapping 2022: 43: 5389-5407.
Figures
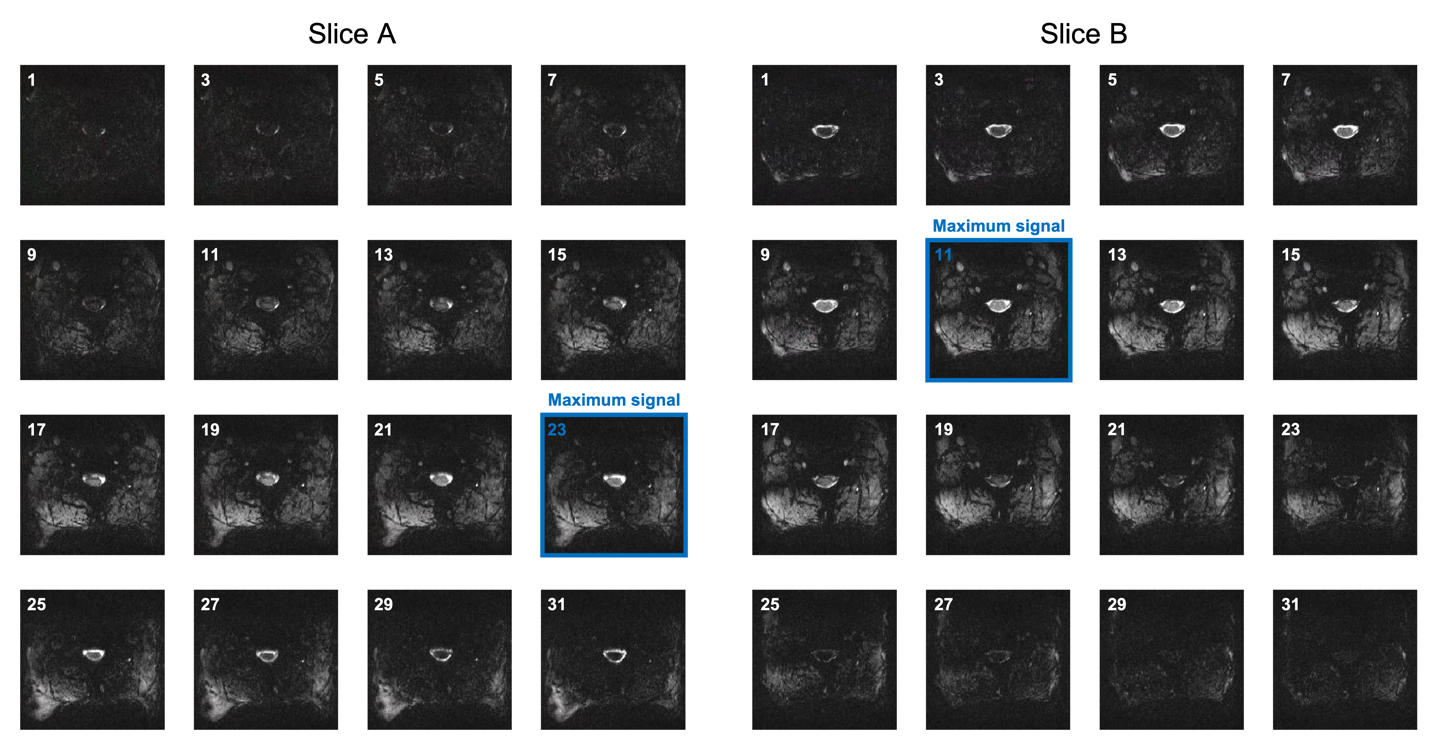
Fig. 1: Images of 16 of the 31 z-shim settings covered by the reference acquisition for two slices of the same volunteer, with the acquisitions providing the maximum signal intensity in the spinal cord marked in blue for each slice. The optimum z-shim settings markedly differ between slices, demonstrating that slice-specific z-shim settings are required to optimize the signal in the spinal cord.
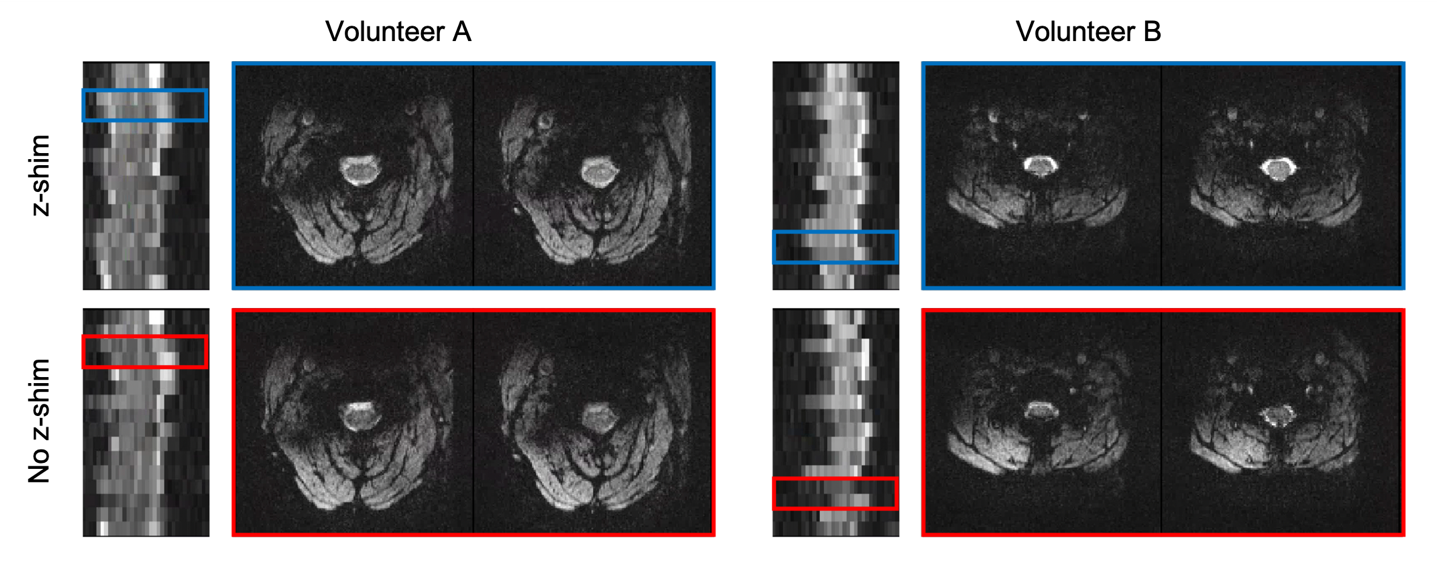
Fig. 2: Sagittal view of all 16 slices and two selected transverse slices with (blue) and without (lower, red) z-shim in two volunteers. While in some volunteers, the improvement due to slice-specific z-shimming is less pronounced overall (left), a marked gain in signal intensity and reduction in signal variation across slices could be observed for other volunteers (right).
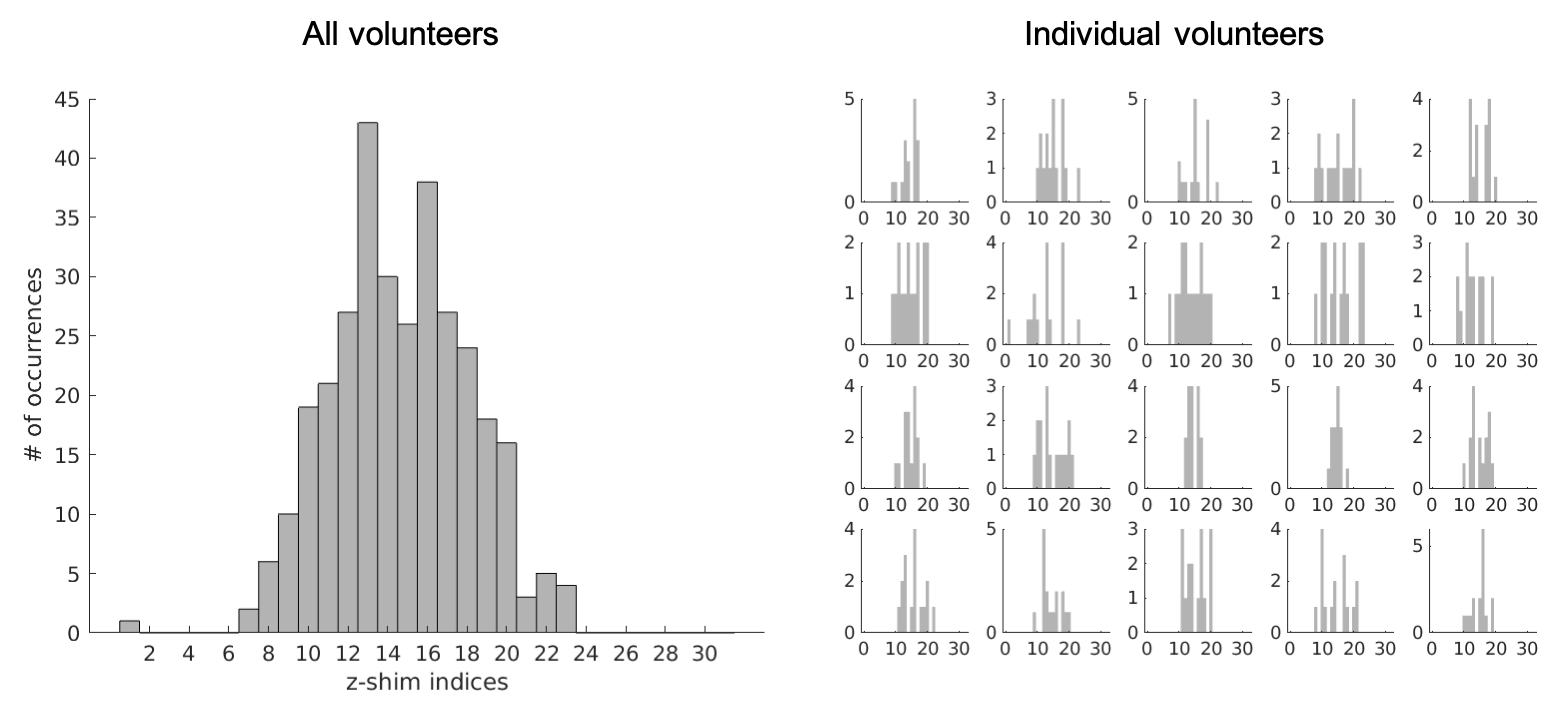
Fig. 3: Histograms of the optimum z-shim settings for all slices of all volunteers (left) and individual volunteers (right). The central index 16 corresponds to the no z-shim case and is the optimum setting for 38 of the 320 slices. For all other slices, the signal intensity in the spinal cord could thus be improved by appropriately selected z-shims.
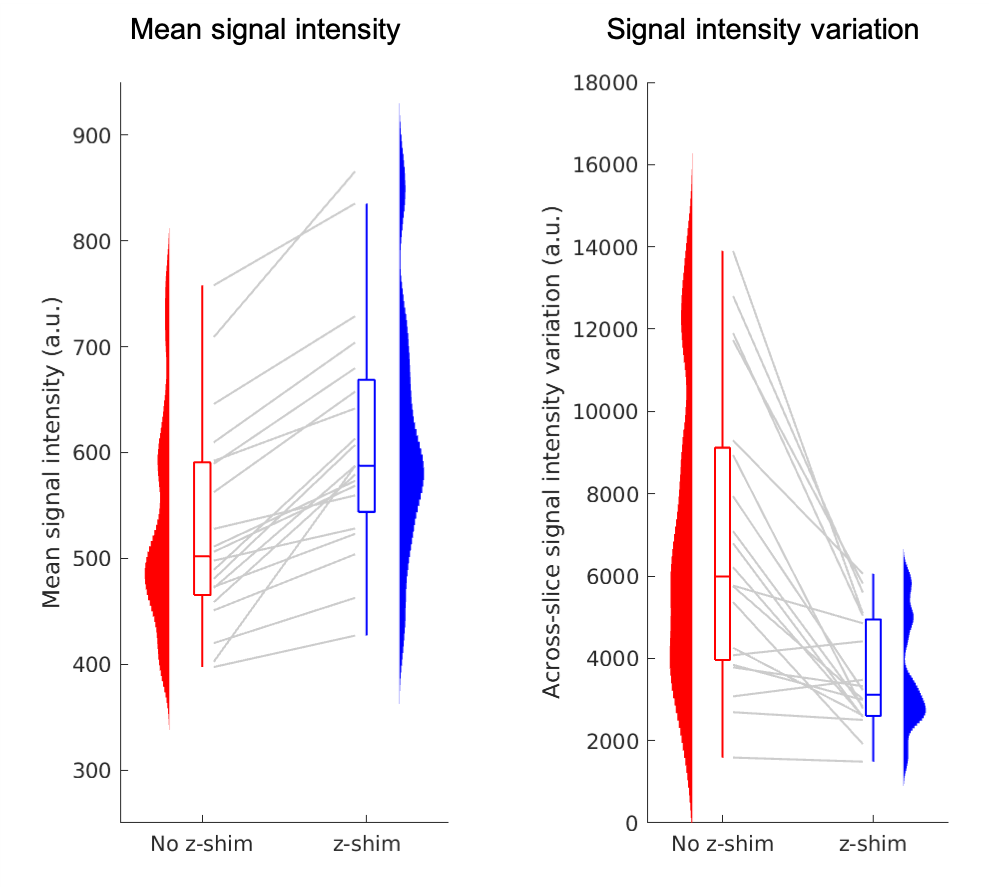
Fig. 4: Group-level effects regarding mean signal intensity (left) and signal intensity variation across slices (right) are depicted via box-plots and half-violin plots, with individual data depicted via gray lines. Slice-specific z-shimming (blue) leads to a marked and consistent increase in mean signal intensity and a reduction in signal intensity variation across slices compared to no z-shim (red).