4232
Structural and functional changes in obstructive sleep apnea and their associated gene expression profiles1Department of Radiology, The Second Xiangya Hospital of Central South University, Changsha, China, 2Clinical Research Center for Medical Imaging in Hunan Province, Changsha, China
Synopsis
Keywords: Neurotransmission, Genetics, Biomarkers, fMRI (resting state)
Motivation: The genetic mechanisms underlying the structural and functional changes in the brain of patients with obstructive sleep apnea (OSA) are largely unknown.
Goal(s): This study investigates the gene expression patterns related to brain structure and function in patients with OSA.
Approach: We explore the gene expression profiles associated with changes in brain structure and function in OSA based on transcriptome-neuroimaging spatial correlation analysis.
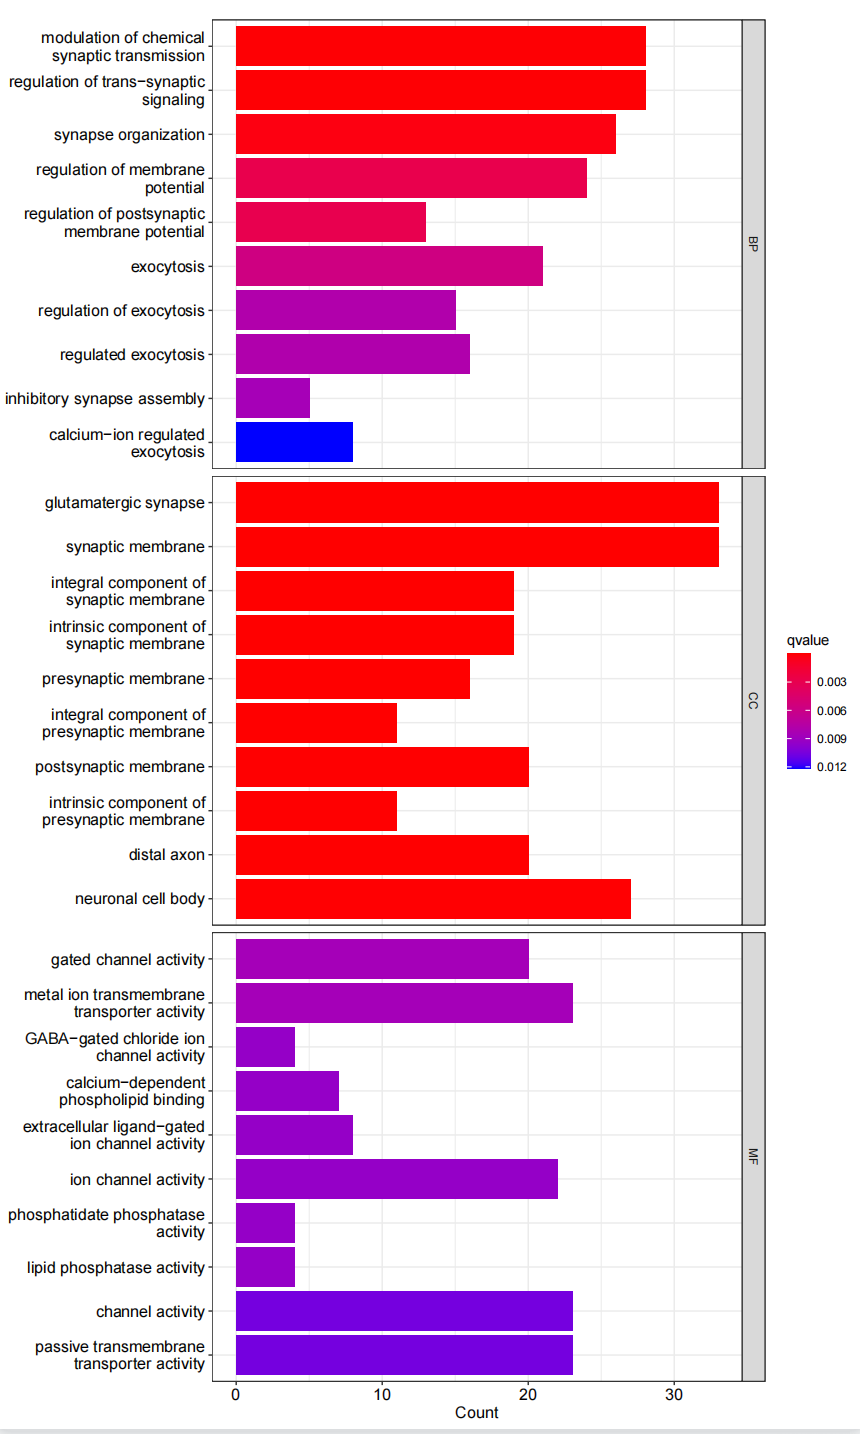
Results: The brain regions associated with cognition, emotion, and sleep regulation have undergone changes in the OSA group. Genes associated with altered brain structure and function are predominantly enriched in activities related to gated channels and synaptic communication.
Impact: Our study suggests that complex polygenic genetic mechanisms play a role in brain morphological and functional abnormalities in OSA, providing a new perspective on the relationship between genes, and brain function in patients with obstructive sleep apnea.
Introduction
Obstructive sleep apnea (OSA) is a common sleep disorder widely reported as an abnormality in brain structure and function [1,2]. However, the genetic mechanisms [3] behind the structural and functional alterations remain largely unexplored. This study utilized transcriptome-neuroimaging spatial correlation analyses to investigate the gene expression patterns related to brain structure and function in patients with OSA.Methods
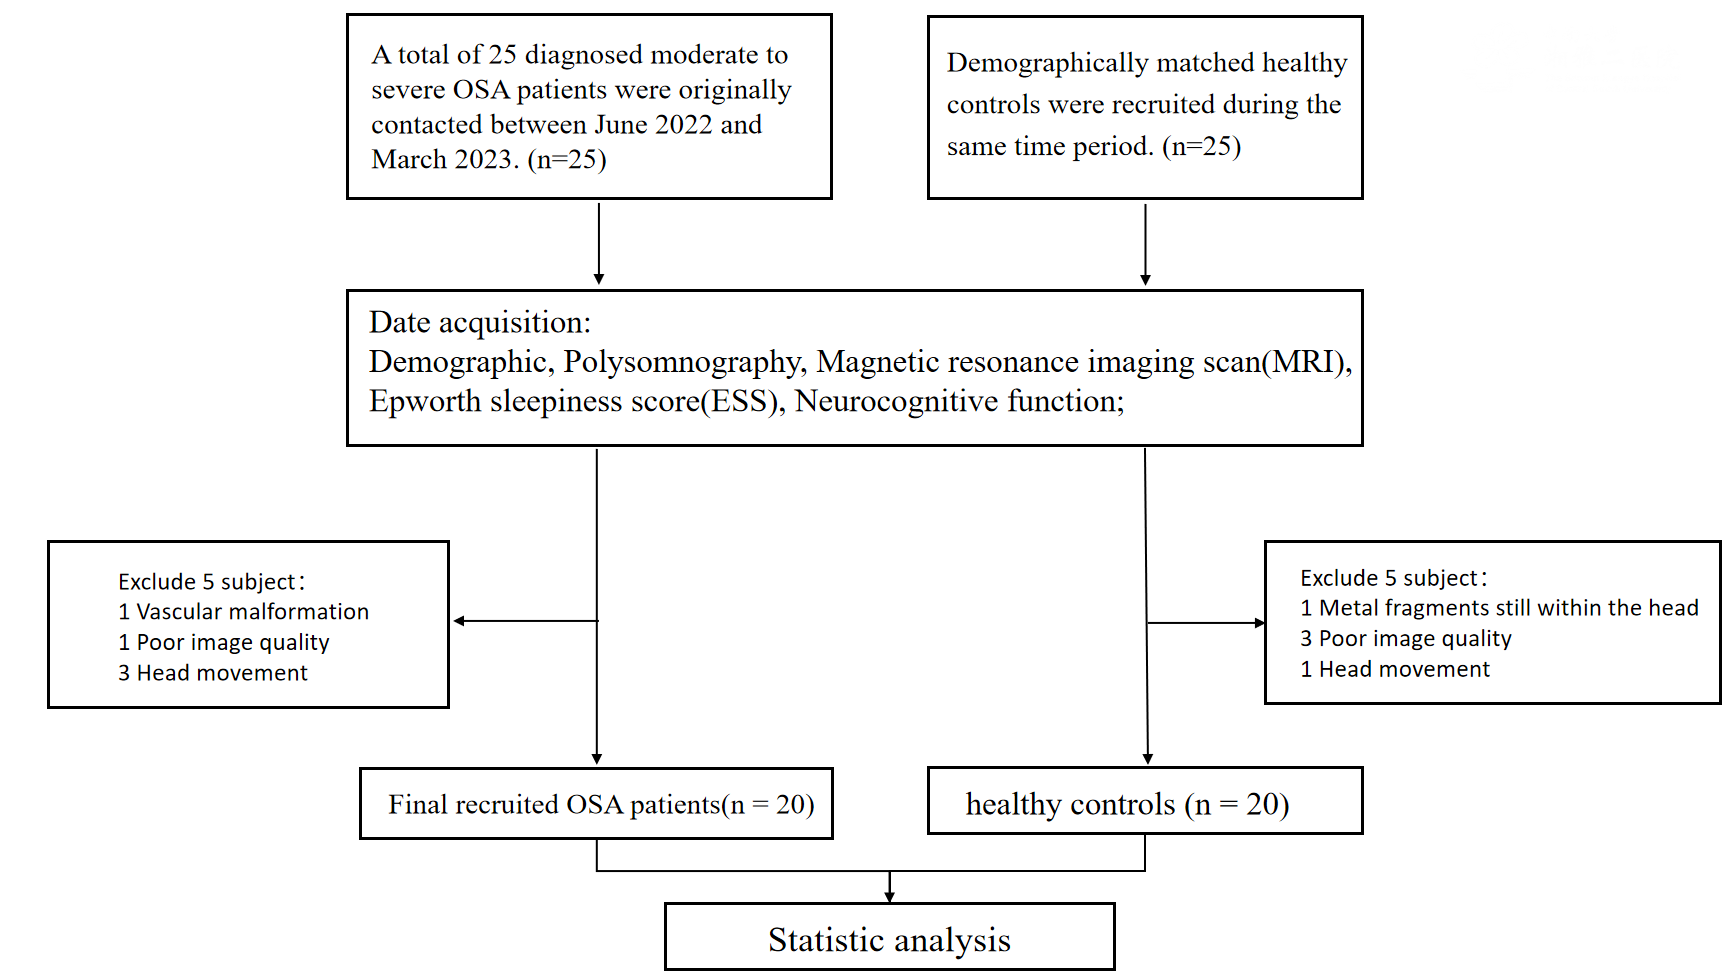
In this study, 20 newly diagnosed OSA patients and 20 healthy controls were ultimately recruited from the Sleep Disorders Center of the Second Xiangya Hospital of Central South University and their MRI data were collected. The inclusion criteria for patients with OSA required apneahypopnea index (AHI) exceeding 15 times per hour. The exclusion criteria for all participants were as follows:(1) structural brain abnormalities; (2) severe physical ailments; (3) serious psychiatric or neurological conditions; (4) history of traumatic brain injury and cranial surgery and history of substance abuse; (5) previously evaluated using comparable or indistinguishable cognitive measures; (6) the head moving more than 2 mm in translation or 2 in rotation, or poor image quality; Healthy controls were excluded from participation if they received a polysomnography diagnosis of any form of sleep-disordered breathing.A Siemens Skyra 3T MRI scanner (Siemens Healthcare, Erlangen, Germany) to collect all MRI data. The resting-state fMRI parameters were as follows: repetition time (TR) / echo time = 2000 ms / 30ms; matrix, 64 x 64; flip angle = 90°, voxel size = 3.5mm x 3.5 mm x 3.5 mm, with a total of 37 axial slices and slice thickness set at 3.4 mm, field of view = 192 mm; Acquisition parameters for the three-dimensional T1-weighted sequence were as follows: 192 slices per slab with a 256×256 in-plane resolution; repetition time was set at 2.3s, echo time at 2.32 milliseconds, slice thickness = 0.9 mm and flip angle at 8°. The voxel size was 0.9 x 0.9 x 0.9mm3 and inversion time at 900 milliseconds.
Using structural and resting-state functional magnetic resonance imaging data from 20 patients with moderate-to-severe OSA and 20 healthy controls (Fig. 1), we compared cortical morphology and spontaneous brain activity between the two groups using voxel-based morphometry (VBM) and amplitude of low-frequency fluctuations (ALFF) analyses. The significance level was set at P < 0.05 corrected using the False Discovery Rate (FDR) method. In conjunction with the Allen Human Brain Atlas[4]. we utilized transcriptome-neuroimaging spatial correlation analyses to investigate gene expression patterns associated with alterations in gray matter volume (GMV) and changes in ALFF in OSA.
Gene expression data preprocessing through the ALLEN Brain Atlas database and using the abagen [5] toolkit (https://www.github.com/netneurolab/abagen). We then enriched the genes that were significantly associated with both ALLL and GMV changes for analysis. We performed gene ontology (GO) analysis of molecular functions, cellular components, and biological processes by clusterProfifiler, org.Hs.eg.db, enrichplot, complexHeatmap and ggplot2 packages. We simultaneously performed spearman correlation analyses of discrepant imaging metrics kernel clinical cognitive scales and sleep parameters, The significance level was set at P < 0.05.
Results
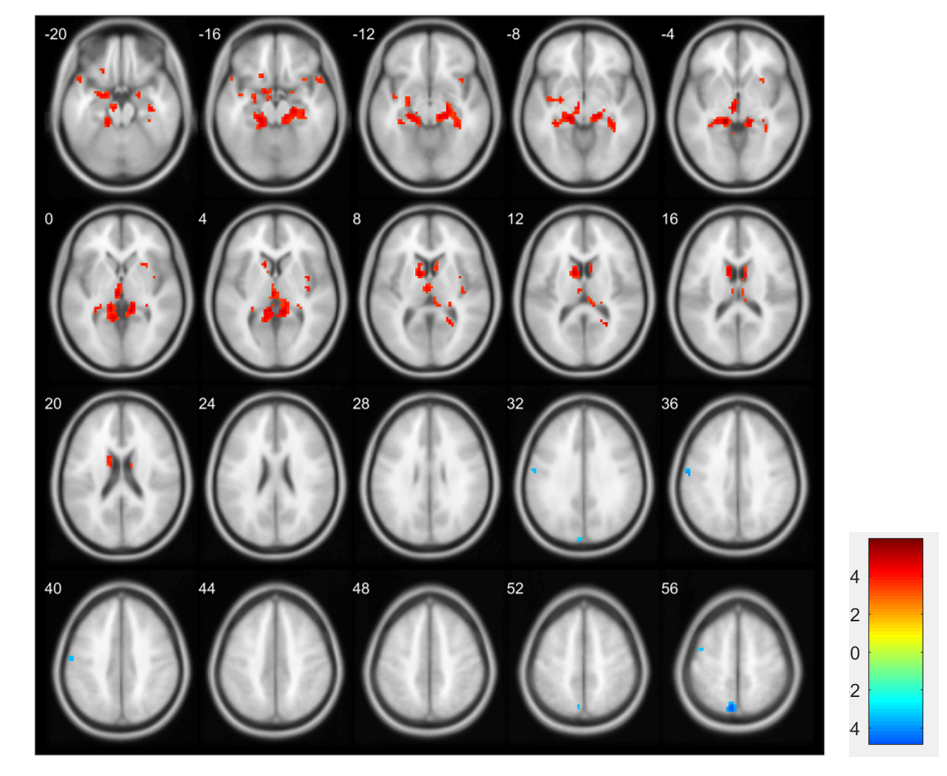
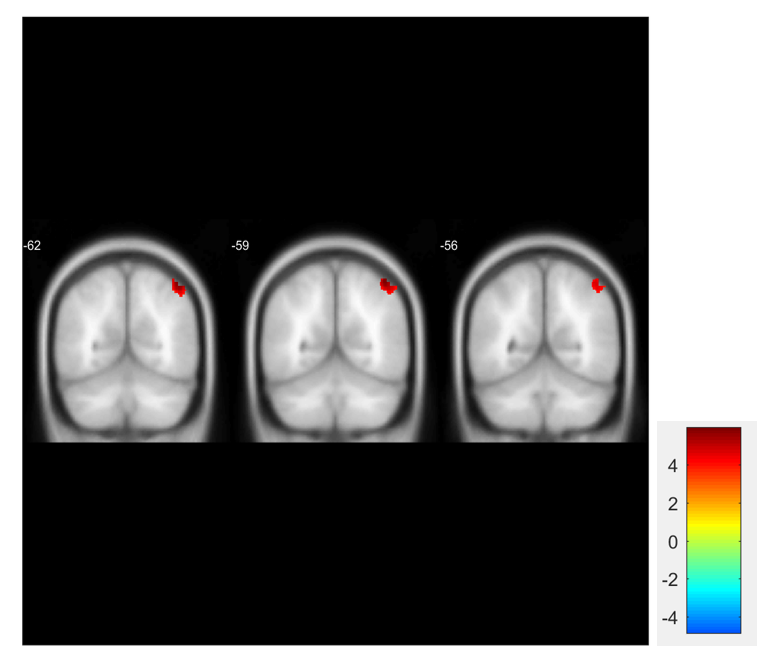
Compared with the HCs, the OSA group showed increased ALFF values in the left hippocampus (t= 5.628),left amygdala (t= 4.233) , left caudate (t=4.539), and decreased ALFF values at left precuneus (t=- 4.658) . VBM analysis demonstrated significantly increased GMV in the right inferior parietal lobe (t=5.258) in OSA (Fig. 2,3). In addition, the functional enrichment analyses indicated that genes linked to both ALFF and GMV cross-sampling exhibited enrichments in activities related to gated channels and synaptic communication, specifically glutamatergic synapses and neurons (Fig. 4).Discussion
The brain regions associated with cognition, emotion, and sleep regulation have undergone changes in the OSA group,these abnormal brain regions may play an important role in cognitive deficits. Our enriched pathways of differential genes obtained by spatial correlation analysis of transcriptome-neuroimaging provide new insights into the gene expression patterns of cognitive deficits in OSA patients.Conclusion
The focus of our study was to investigate gene expression patterns associated with brain structure and function in patients with OSA, providing a new perspective on the relationship between sleep, genes, and brain function in OSA.Acknowledgements
This research was funded by the National Natural Science Foundation of China (81970086, 81671671)References
1. Ji, T., et al., Brain function in children with obstructive sleep apnea: a resting-state fMRI study. Sleep, 2021. 44(8).
2. Taylor, K.S., et al., Cortical autonomic network gray matter and sympathetic nerve activity in obstructive sleep apnea. Sleep, 2018. 41(2).
3. Xu, H., et al., Genome-Wide Association Study of Obstructive Sleep Apnea and Objective Sleep-related Traits Identifies Novel Risk Loci in Han Chinese Individuals. Am J Respir Crit Care Med, 2022. 206(12): p. 1534-1545.
4. Hawrylycz, M.J., et al., An anatomically comprehensive atlas of the adult human brain transcriptome. Nature, 2012. 489(7416): p. 391-399.
5. Markello, R.D., et al., Standardizing workflows in imaging transcriptomics with the abagen toolbox. Elife, 2021. 10.
Figures