4230
qMRI based investigation of neuronal brain changes following mindfulness practice in a population with sleep disorders1Sagol School of Neuroscience, Tel Aviv University, Tel Aviv, Israel, 2School of Education, Tel Aviv University, Tel Aviv, Israel, 3Department of Biomedical Engineering, Tel Aviv University, Tel Aviv, Israel, 4Center for Advanced Imaging Innovation and Research, New York University Langone Medical Center, New York, NY, United States
Synopsis
Keywords: White Matter, Quantitative Imaging
Motivation: Provide evidence for the positive effect of Mindfulness on sleep quality, and investigate the corresponding neuronal changes in the white matter.
Goal(s): Quantify the improvement in sleep quality following Mindfulness meditation in subjects suffering from sleep disorders, and correlate these to change in quantitative T1, T2 and proton-density values.
Approach: Meditation naïve subjects underwent MRI scans and filled sleep-quality questionnaires before and after participating in an 8-week MBSR course. Waitlist control group was scanned at the same time-points without intervention.
Results: Sleep quality improved significantly in the MBSR group, compared to controls. No changes were observed in qMRI values in the white matter.
Impact: Discover the psychological-physiological mechanism underlying the improvement of sleep following mindfulness practice; introduce new ways to study the effects of mindfulness; advance better and more personalized treatment plans for insomnia/sleep disorders.
Introduction
Current estimations put the prevalence of people suffering from ongoing sleep disorders at 10-25% of the global adult population1,2, the most common being Insomnia – impaired sleep initiation, interrupted sleep and/or sleep lightness. Mindfulness is defined as the nonjudgmental awareness to the present experience and has been repeatedly shown to improve sleep quality3,4. The effects of Mindfulness meditation on the brain have been investigated mostly using fMRI and basic brain morphology5-7. Quantitative MRI (qMRI) has the ability to quantify subtle microscopic changes in brain microstructure and may therefore provide a more sensitive tool for studying the effects of meditation on the brain. Here, we employed a new qMRI protocol8, for probing neuronal changes in people with sleep disorders, before and after participating in an 8-weeks mindfulness-based stress reduction (MBSR) course.Methods
Population: Forty-three meditation naive subjects with poor sleep quality were randomly assigned to either experimental (MBSR) or waitlist control (WL) groups.MBSR course: MBSR group participated in an 8-weeks course, passed by a qualified instructor.
ISI questionnaire9: were filled pre (t1) and post (t2) MBSR course.
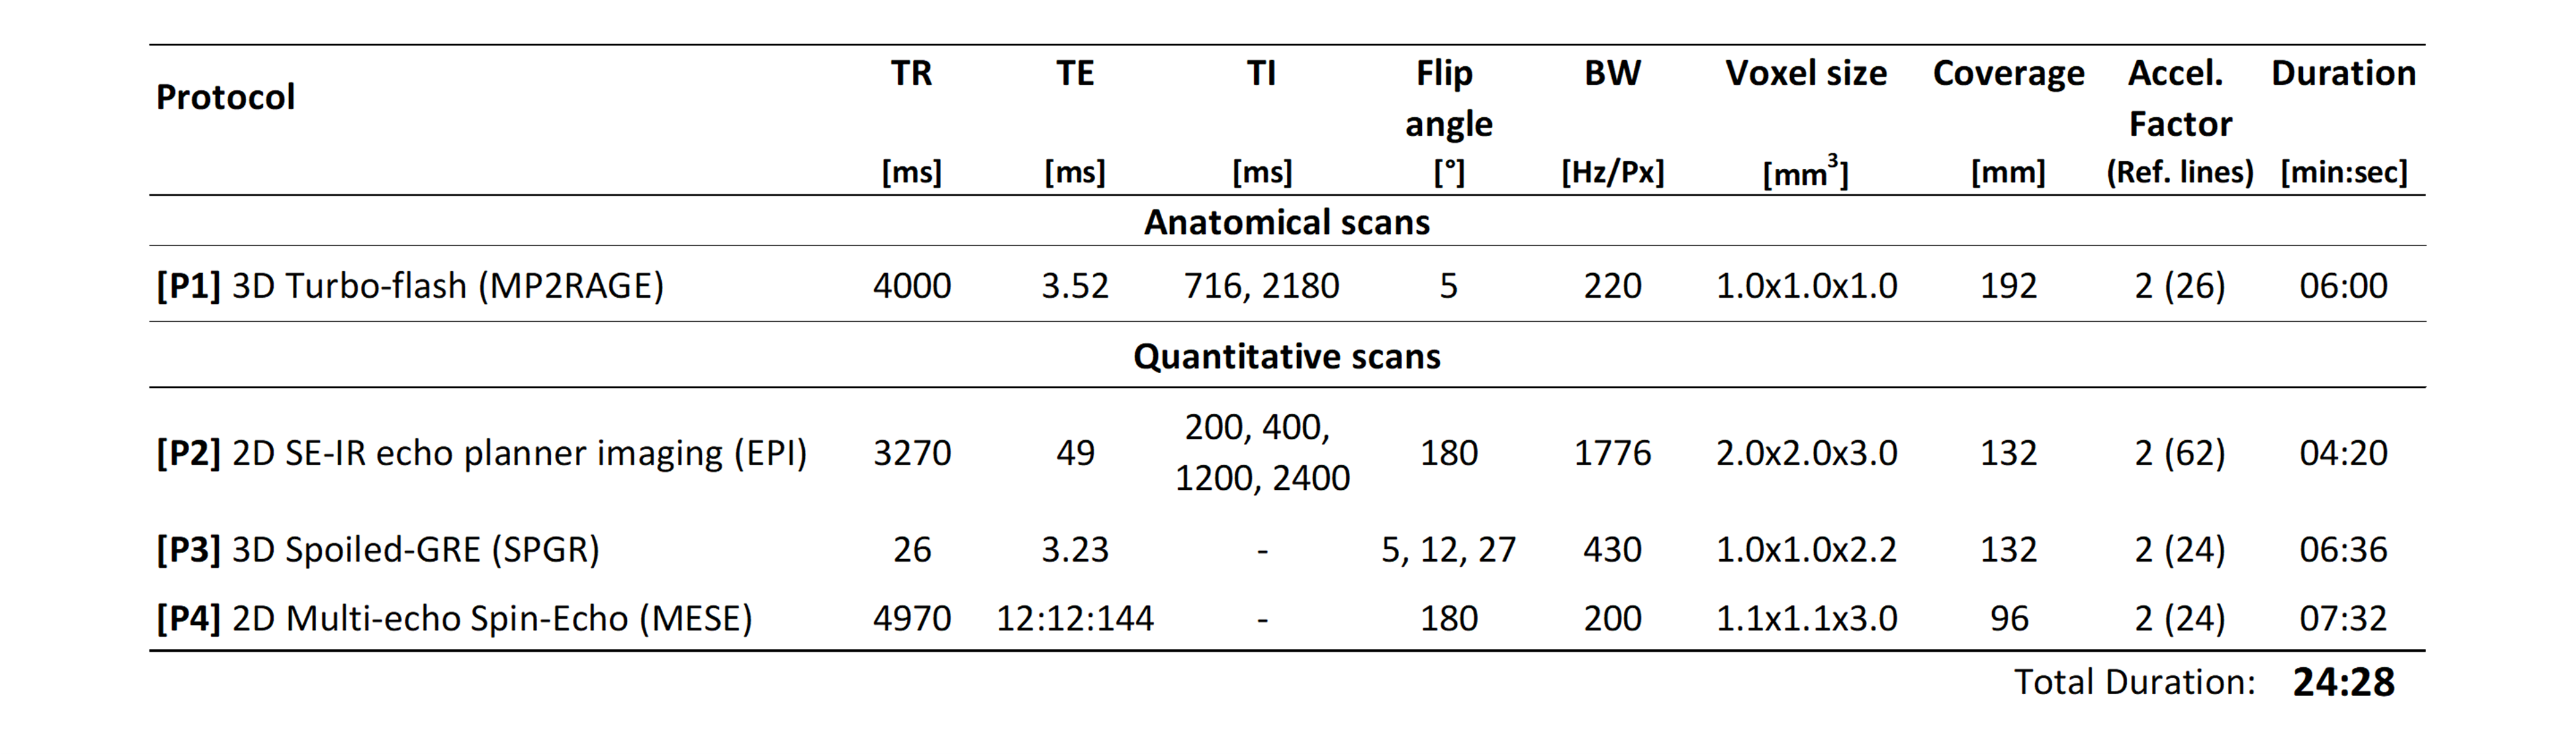
MRI scans: were done on a 3T Prisma scanner (Siemens Healthineers) under IRB (SMC-3933-17) pre (t1) and post (t2) MBSR course. Scans and parameters are listed in Table 1 and included MP2RAGE for anatomical segmentation, EPI and SPGR for quantitative T1 (qT1), and a MESE protocol for quantitative T2 (qT2) and proton density (PD) mapping.
Data processing: qT1 maps were generated using the mrQ software10. qT2 and PD maps were generated from MESE data using the EMC algorithm11,12.
Statistical analysis: The white matter (WM) was chosen as the region of interest due to its plasticity and based on evidence of WM changes induced by long term routine practice of meditation13,14. WM masks were segmented using Freesurfer software. Mean, standard deviation (SD), median, skewness and kurtosis were calculated for the WM region in each qMRI map, to a total of 15 statistical features. Repeated measures ANOVAs were performed for the within-subject factor of time (t1 vs. t2), and the between-subject factor of group (WL vs. MBSR). Analysis was repeated for each statistical feature.
Results
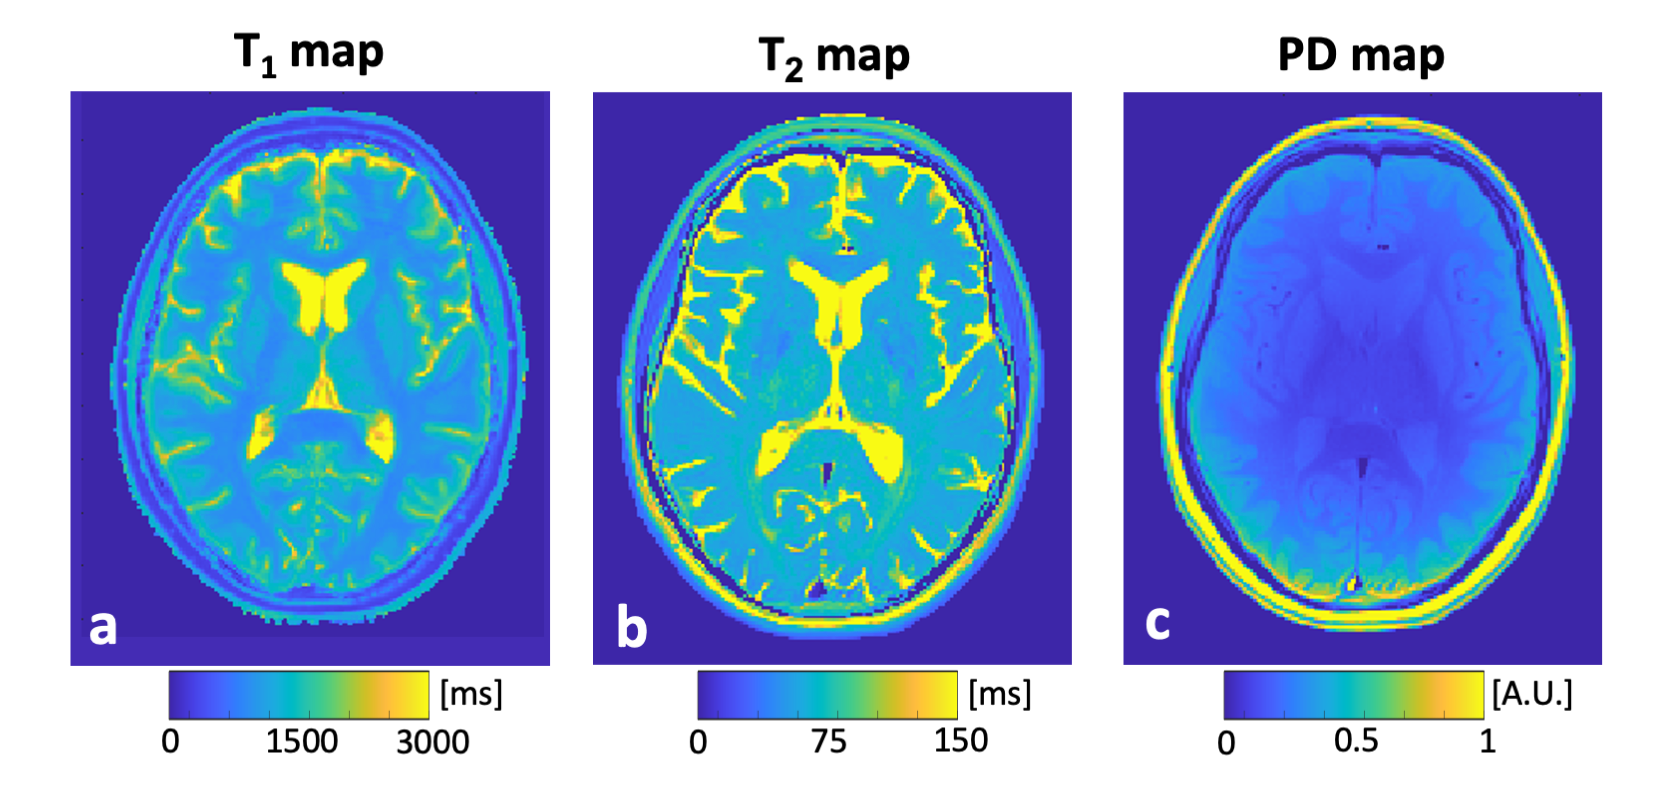
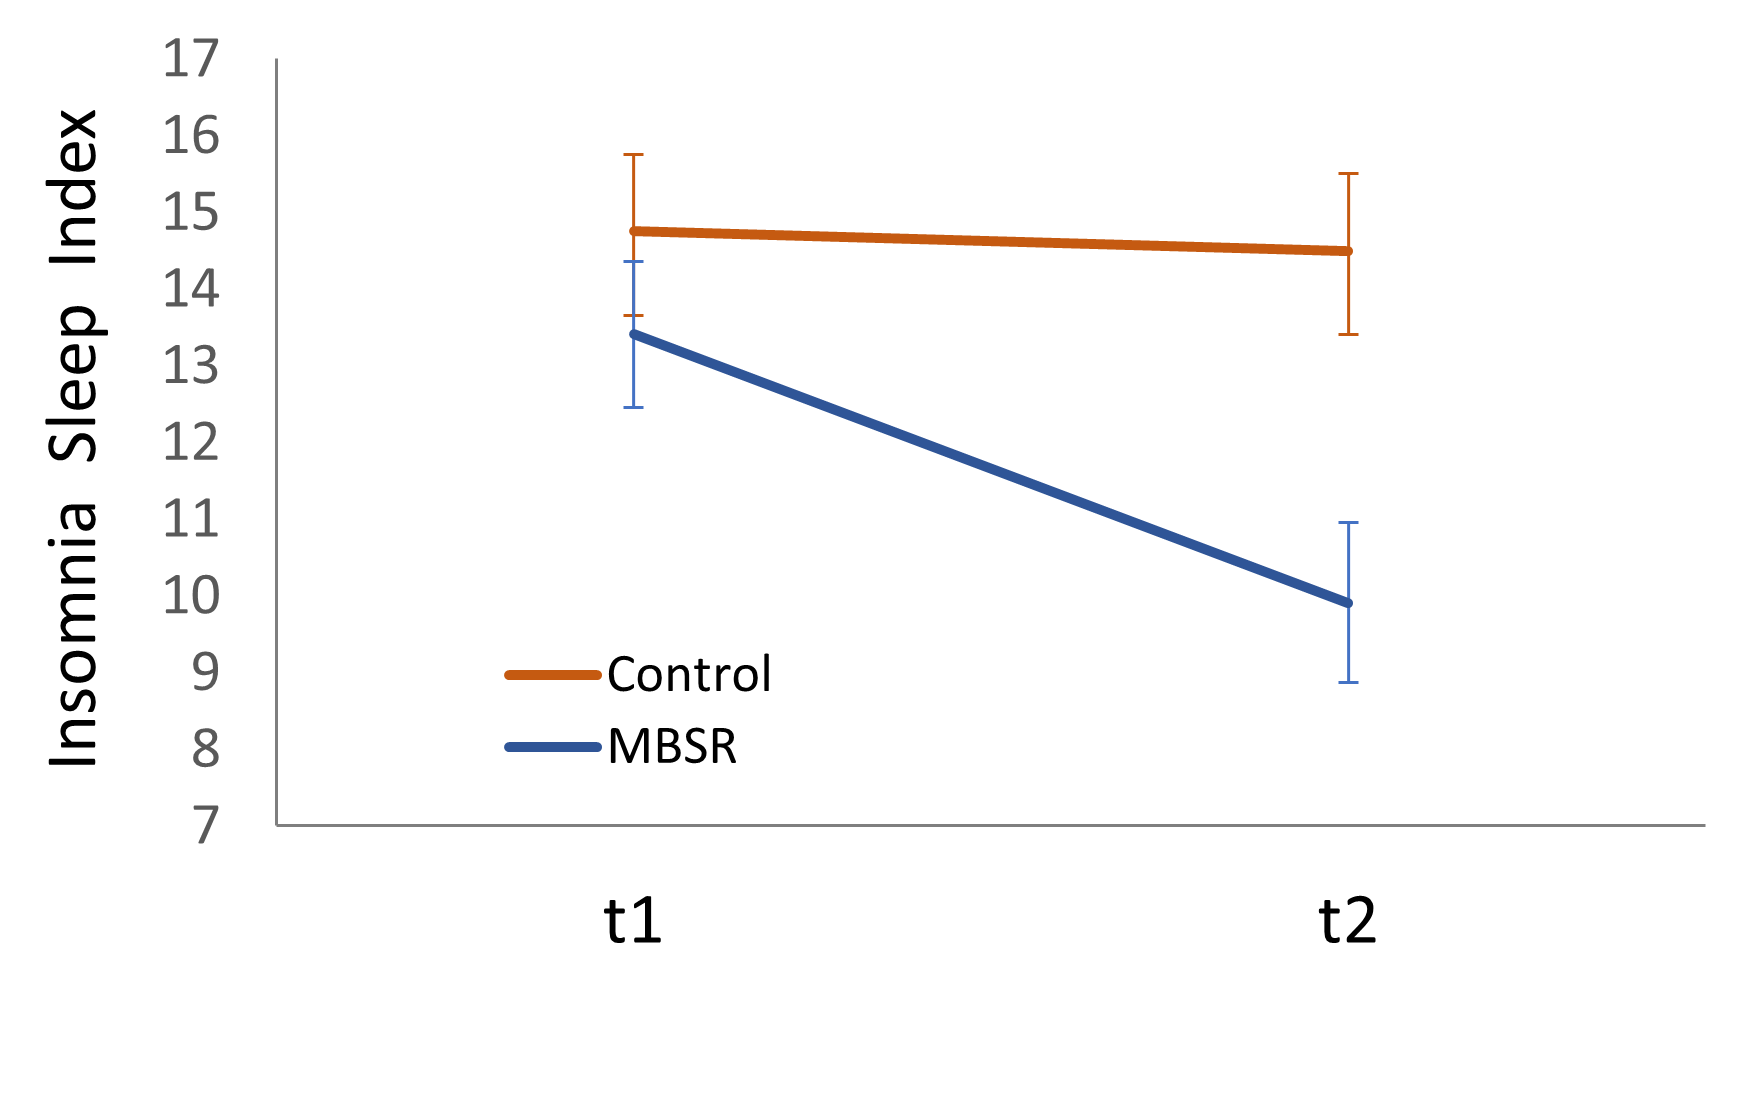
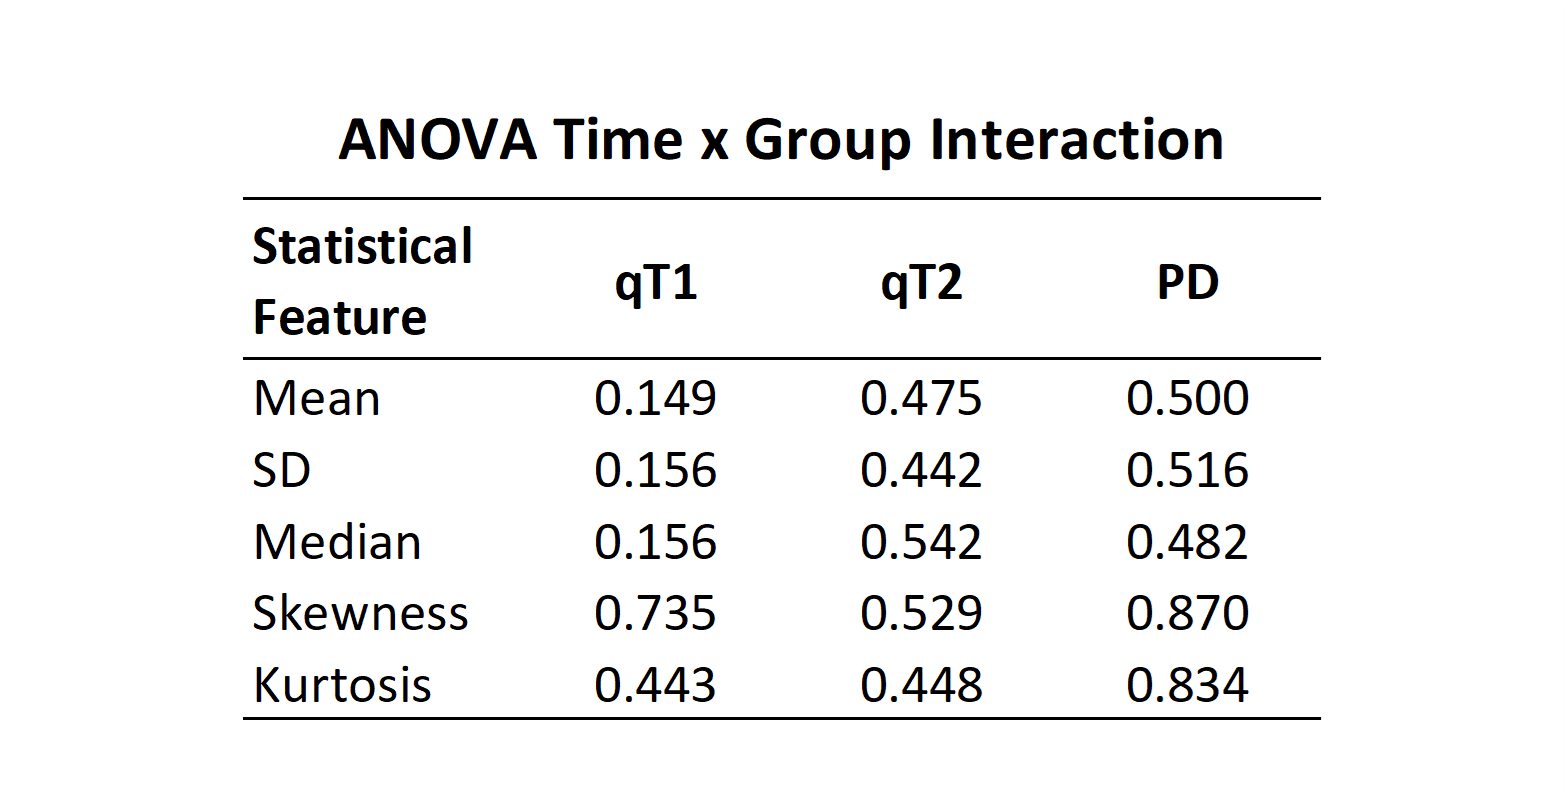
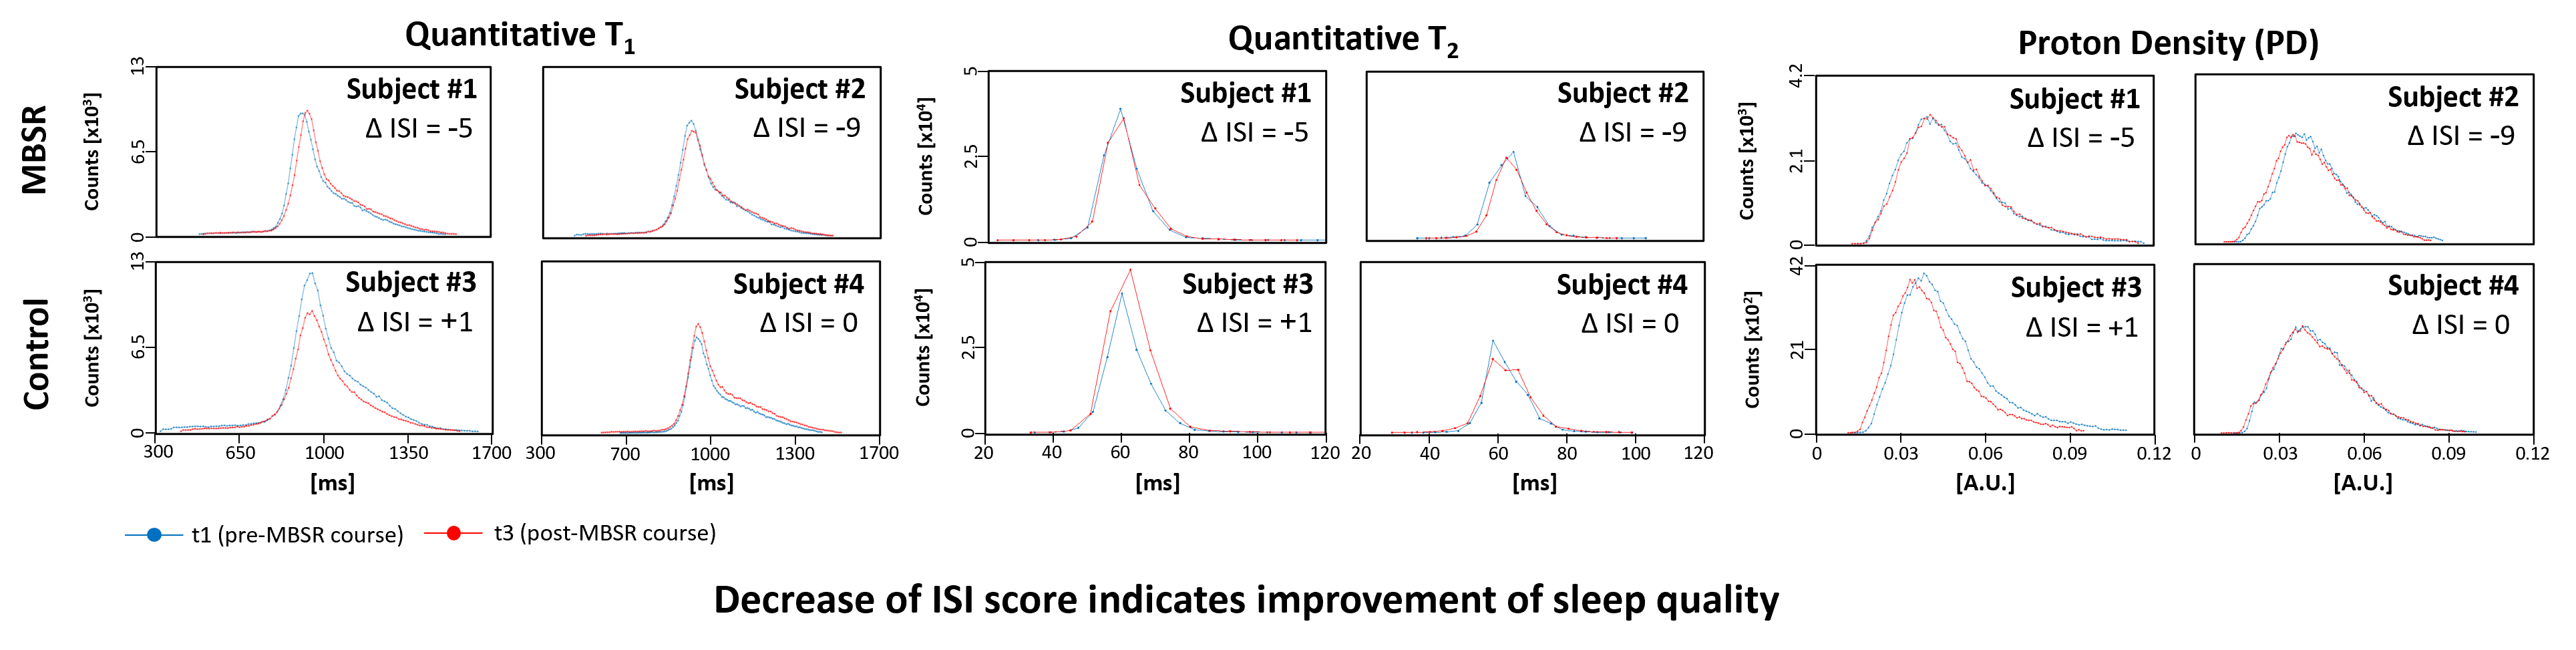
Representative T1, T2, and PD maps are shown in Figure 1 for a single subject. Figure 2 presents the change in sleep quality for the MBSR and control groups based on the self-reported sleep quality ISI score9 (lower ISI score corresponds to better sleep quality). Repeated measures ANOVA produced significant Time x Group interaction (p < 0.001), while tukey post-hoc within-group comparisons revealed a significant elevation in sleep quality in the MBSR group (p < 0.001, Cohen’s d = 0.86), with no significant difference in the control group (p = 0.99).Repeated measures ANOVA of Group x Time interaction of quantitative values in the white matter is shown in Table 2 for the three examined maps (T1, T2 and PD). No significant interaction was found in this case using either of the statistical metrics (p-values > 0.05), indicating lack of consistent change in qMRI values for both groups pre- / post- MBSR course. Histograms of WM qMRI values are shown in Figure 3 for representative subjects from the MBSR and control groups. Visual inspection reveals similar positive / negative changes in the range of values for both groups, with no apparent correlation to the change in ISI scores (∆ ISI).
Discussion
This study demonstrates the effectiveness of MBSR training as an approach for rapid and efficient intervention for sleep disorders. The absence of detectable structural changes in the brain within the study's timeframe can be attributed to the unique nature of MBSR training, i.e., the high variability between training regimes of each individual, and the lack of repetitive, spatially localized brain activity15. The observed enhancement in sleep quality provides a strong indication for the presence of neurobiological changes, albeit possibly too subtle to observe. These findings emphasize the need for further research to uncover these intricate mechanisms using either additional contrasts or more localized and region-specific investigations.Acknowledgements
No acknowledgement found.References
1. Morin, C. M., & Jarrin, D. C. (2013). Epidemiology of Insomnia. Sleep Medicine Clinics; Elsevier BV. https://doi.org/10.1016/j.jsmc.2013.05.002
2. Roth T. & Roehrs T. (2003). Insomnia: Epidemiology, Characteristics, and Consequences. Clinical Cornerstone, 5(3), p. 5–15. https://doi.org/10.1016/S1098-3597(03)90031-7
3. Rusch, H.L., Rosario, M., Levison, L.M., Olivera, A., Livingston, W.S., Wu, T. and Gill, J.M. (2019). The effect of mindfulness meditation on sleep quality: a systematic review and meta-analysis of randomized controlled trials. Ann. N.Y. Acad. Sci., 1445: 5-16. https://doi.org/10.1111/nyas.13996
4. Tarrasch, R. (2015). Mindfulness Meditation Training for Graduate Students in Educational Counseling and Special Education: A Qualitative Analysis. J Child Fam Stud 24, pp. 1322–1333 https://doi.org/10.1007/s10826-014-9939-y
5. Fayed, N., Cifre, I., Garcia-Campayo, J., & Viguera, L. (2015). Mindfulness and neuroimaging. Psychiatry and neuroscience update: Bridging the divide, pp. 389–401. https://doi.org/10.1007/978-3-319-17103-6_27
6. Gotink, R. A., Meijboom, R., Vernooij, M. W., Smits, M., & Hunink, M. (2016). 8-week Mindfulness Based Stress Reduction induces brain changes similar to traditional long-term meditation practice – A systematic review. Brain and Cognition; Elsevier BV. https://doi.org/10.1016/j.bandc.2016.07.001
7. Fox, K. C. R., Nijeboer, S., Dixon, M. L., Floman, J. L., Ellamil, M., Rumak, S. P., Sedlmeier, P., & Christoff, K. (2014). Is meditation associated with altered brain structure? A systematic review and meta-analysis of morphometric neuroimaging in meditation practitioners. Neuroscience & Biobehavioral Reviews; Elsevier BV. https://doi.org/10.1016/j.neubiorev.2014.03.016
8. Radunsky, D. et al, A comprehensive protocol for multiparametric brain MRI. 31st Proc Intr Soc Magn Reson Med, London, 2022, p. 1270.
9. Bastien, C., Vallières, A., & Morin, C. M. (2001). Validation of the Insomnia Severity Index as an outcome measure for insomnia research. Sleep Medicine; Elsevier BV. https://doi.org/10.1016/s1389-9457(00)00065-4
10. Mezer A, Yeatman JD, Stikov N, Kay KN, Cho NJ, Dougherty RF, Perry LM, Parvizi J, Hua LH, Butts-Pauly K and Wandell BA. (2013). Quantifying the local tissue volume and composition in individual brains with magnetic resonance imaging. Nature Medicine, 19, pp. 1667-1672 http://www.nature.com/nm/journal/v19/n12/full/nm.3390.html?WT.ec_id=NM-201312
11. Ben-Eliezer, N., Sodickson, D.K., Block, K.T. (2015) Rapid and accurate T2 mapping from multi-spin-echo data using Bloch-simulation-based reconstruction. Magn Reson Med, 73(2), pp. 809-17. doi: 10.1002/mrm.25156
12. Radunsky D, Stern N, Nassar J, Tsarfaty G, Blumenfeld-Katzir T, Ben-Eliezer N. (2021). Quantitative platform for accurate and reproducible assessment of transverse (T2 ) relaxation time. NMR Biomed. 34(8):e4537. doi: 10.1002/nbm.4537
13. Tang, Y., Lu Q., Fan M., Yang Y., Posner, M. I. (2012). Mechanisms of white matter change induced by meditation. PNAS 109(26). https://doi.org/10.1073/pnas.1207817109
14. Posner M.I., Tang Y.Y., Lynch G. (2014) Mechanisms of white matter change induced by meditation training. Front Psychol. doi: 10.3389/fpsyg.2014.01220.
15. Kral T.R.A., Davis K., Korponay C., Hirshberg M.J., Hoel R., Tello L.Y., Goldman R.I., Rosenkranz M.A., Lutz A., Davidson R.J. (2022). Absence of structural brain changes from mindfulness-based stress reduction: Two combined randomized controlled trials. Sci Adv. 20(8) doi: 10.1126/sciadv.abk3316.
Figures