4229
Exploring the Application of Gradient Field Strength in Enhancing Motion Encoding for Whole-Brain MRE Images1Department of Radiology, The First Affiliated Hospital of Xi'an Jiaotong University, Xi'an, China, 2Shaanxi Engineering Research Center of Computational Imaging and Medical Intelligence, Xi'an, China, 3Philips Healthcare, Xi'an, China
Synopsis
Keywords: Structural Connectivity, Elastography, gradient strength
Motivation: Enhancing the propagation efficiency of shear waves in deep tissues, improving the sensitivity of motion-sensitive sequences to small shear wave displacements, optimizing inversion algorithms can enhance the quality of MRE images and increase the reliability of the results. Gradient strengt is one of the important factors affecting MRE images quality.
Goal(s): The aim of this study is to investigate the role of gradient field strength in whole-brain MRE images.
Approach: Keeping other parameters constant, varying the gradient strength of MRE yields parameter maps that are quantitatively compared.
Results: Increasing the gradient field strength appropriately can enhance the motion encoding of whole-brain MRE images.
Impact: Appropriate gradient field strength settings contribute to improving the quality of MRE images and enhancing the reliability of results
Introduction
Due to the barrier effect of the skull and cerebrospinal fluid, magnetic resonance elastography (MRE) faces challenges in generating usable shear waves in deep brain tissues compared to other tissues[1]. To obtain reliable whole-brain MRE data, appropriate scan parameters and image quality control are crucial and fundamental. Enhancing the propagation efficiency of shear waves in deep tissues, improving the sensitivity of motion-sensitive sequences to small shear wave displacements, optimizing post-processing, and inversion algorithms can enhance the quality of MRE images and increase the reliability of the results[2]. Gradient strength(GS) is one of the important factors affecting MRE images[3]. This study aims to investigate the impact of gradient strength on whole-brain MRE images, aiming to improve the quality of whole-brain MRE images and the credibility of the results.Method
Five participants, including 2 males and 3 females, with an average age of 23±1 years, were enrolled in this study. All participants underwent MR imaging using a 3.0T scanner (Ingenia CX, Philips, the Netherlands) with 32-channel head coil. The whole scanning protocols were including structural T1, and 3D-MRE. The MRE excitation equipment was brought by Resoundant (Mayo Clinic, Rochester, MN, USA). The dedicated sequence and post-processing software were provided by Mayo Clinic and Philips. The gradient strength is set to 36mT/m or 70mT/m, other parameters of the 3D 3D-MRE images were as follows: motion encoding in the positive and negative x, y, and z directions; 8 phase offsets sampled over one period of the 60 Hz; 3 mm isotropic resolution; TR/TE = 4900/90 ms; FOV=240mmx240mm; 48 contiguous 3 mm thick axial slices. Figure 1 shows the specific post-treatment process for shear stiffness. The confidence map is an additional image obtained through post-processing in MRE, used to assess the reliability of data and analyze its region. A higher value typically indicates greater confidence in the shear stiffness results obtained through post-processing. Quantitative analysis of the confidence map is conducted using post-processing methods similar to those used for shear stiffness. Masks of Regions of Interest: Segmentation of gray matter and white matter was performed by using SPM12. The yield probability maps were binarized to obtain Global White Matter (GWM) and Cortical Gray Matter (CGM) mask, respectively. Regions of interest (ROIs) of cortical brain region were extracted and combined with Desikan–Killiany–Tourville atlas, including subcortical gray matter (CGM), frontal cortex (FC), parietal cortex (PC), temporal cortex (TC), and occipital cortex (OC). Subcortical Gary matter ROIs such as amygdala (AM), caudate (CA), hippocampus (HC), pallidum (PA), putamen (PU), thalamus (TH), and Accumbens (AC) were extracted from the HarvardOxford-sub -1mm atlas.Result
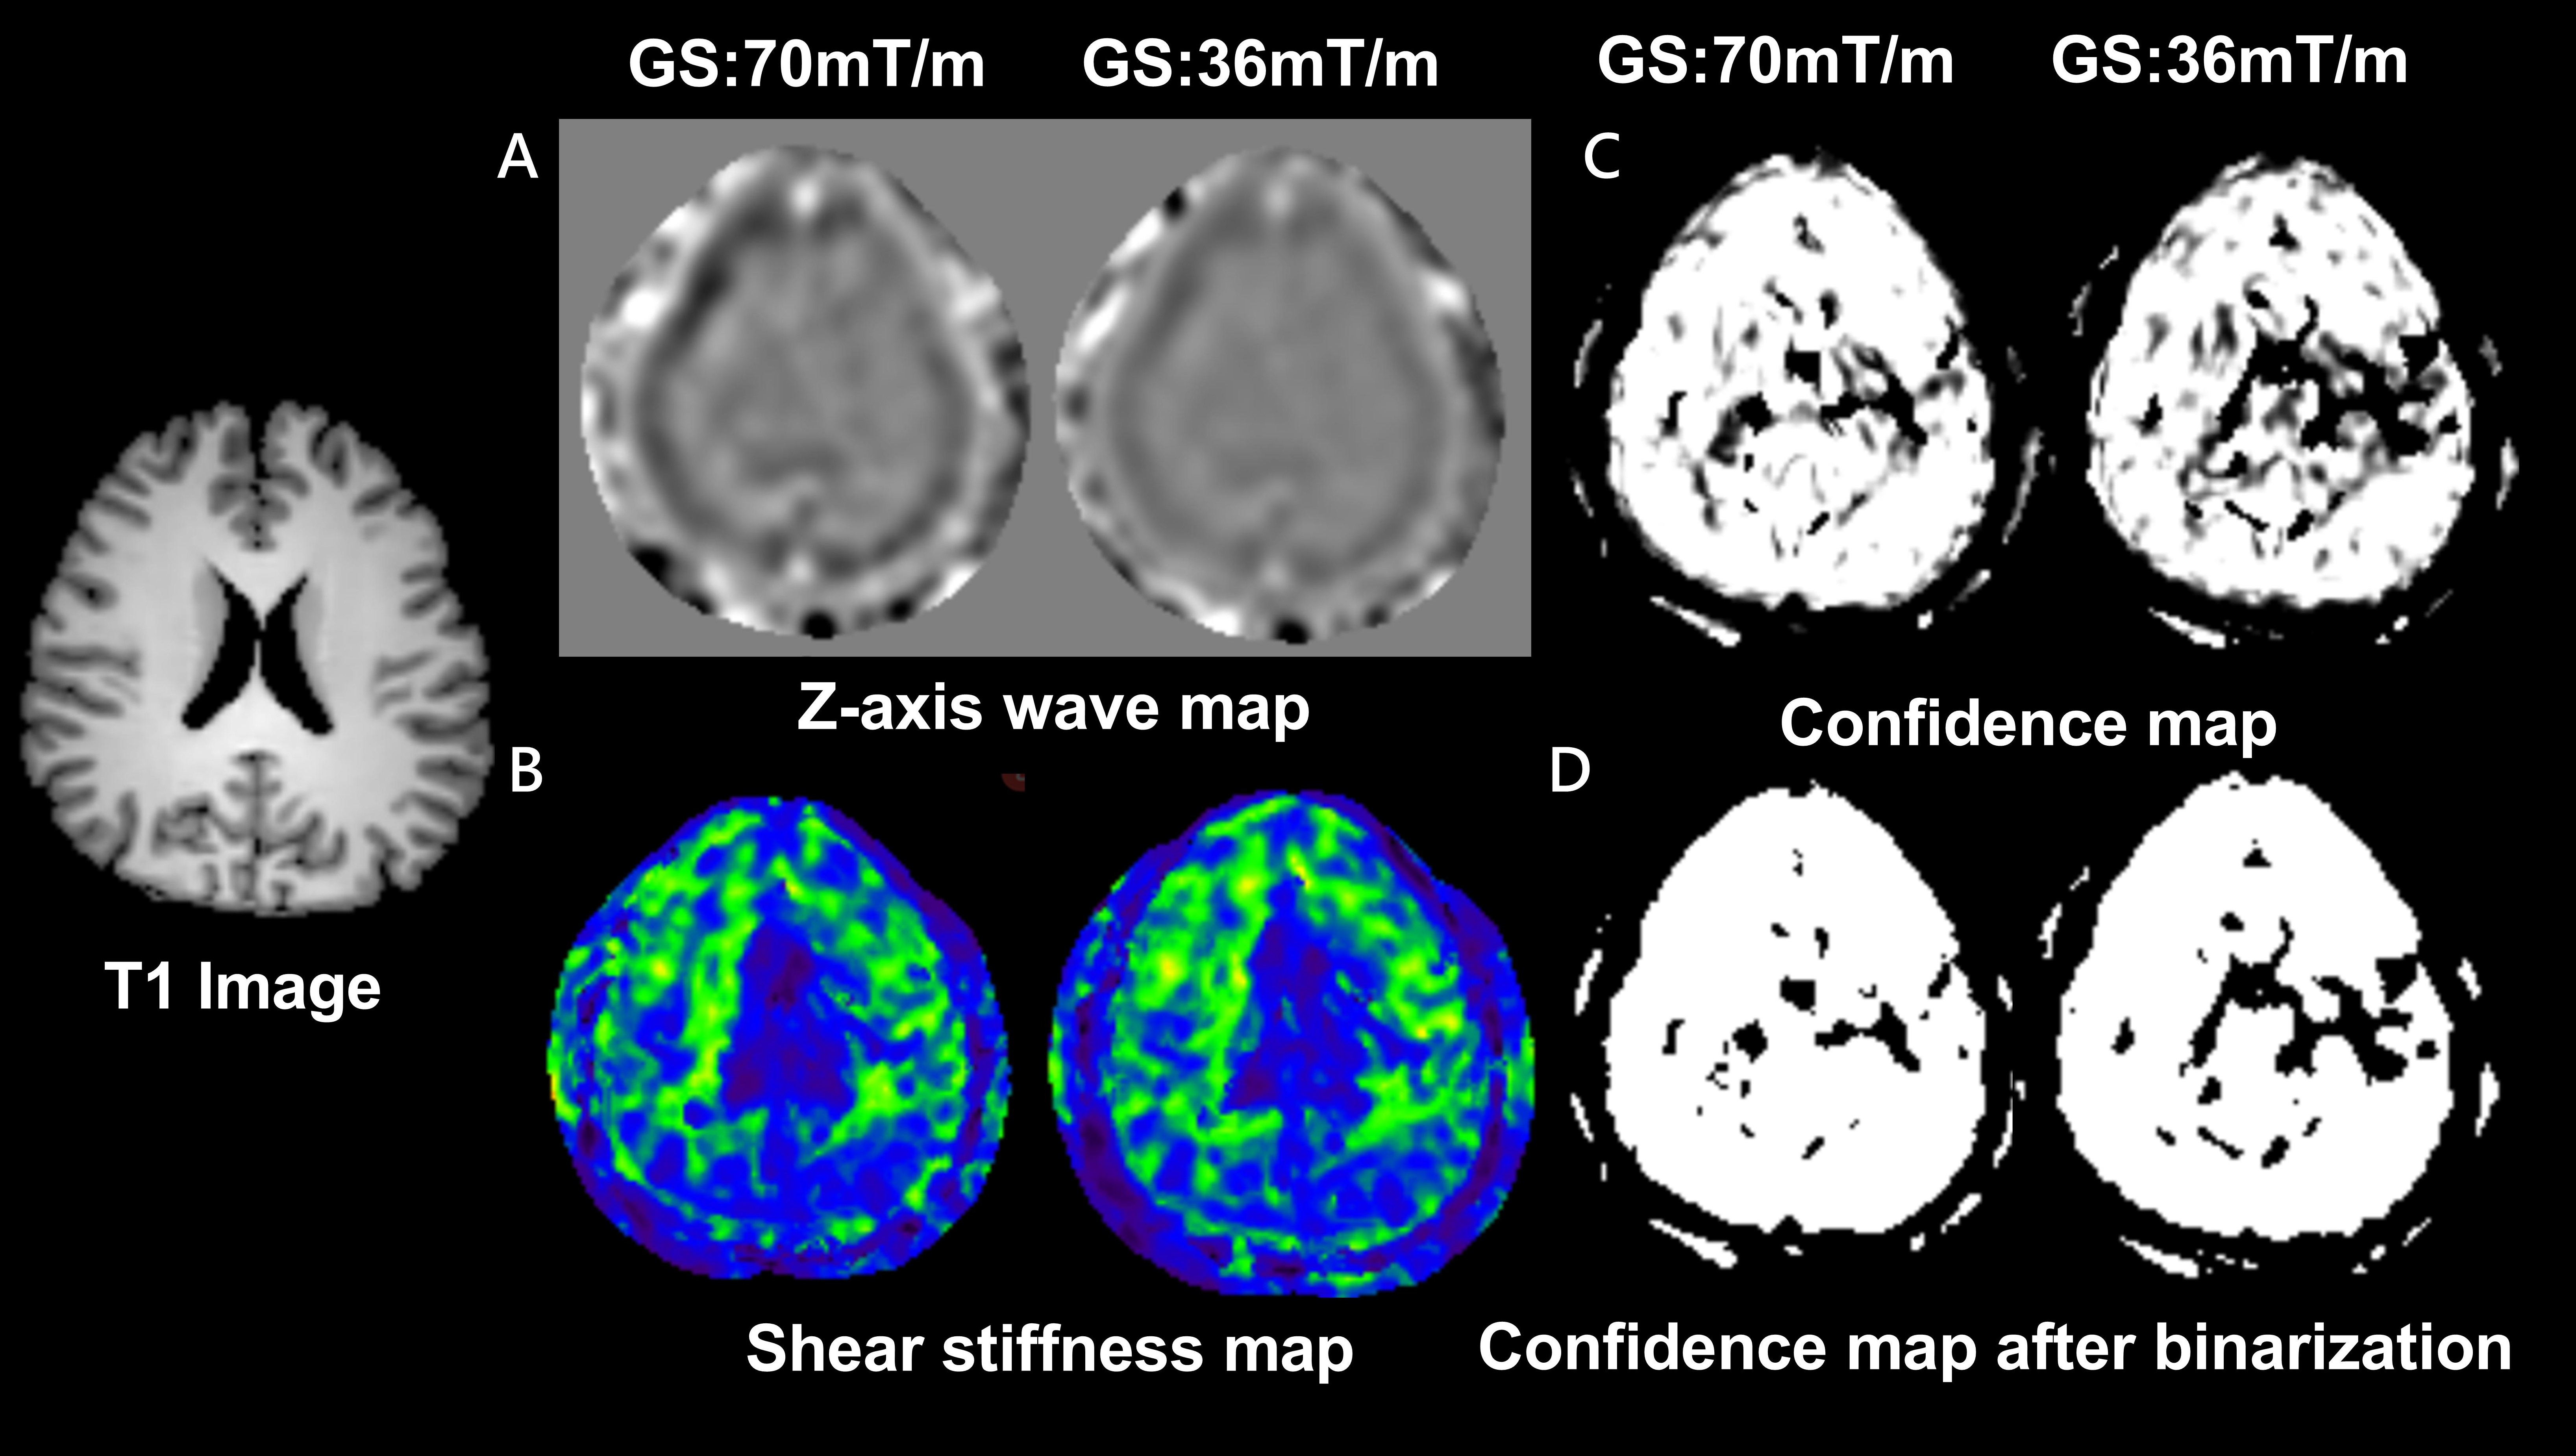
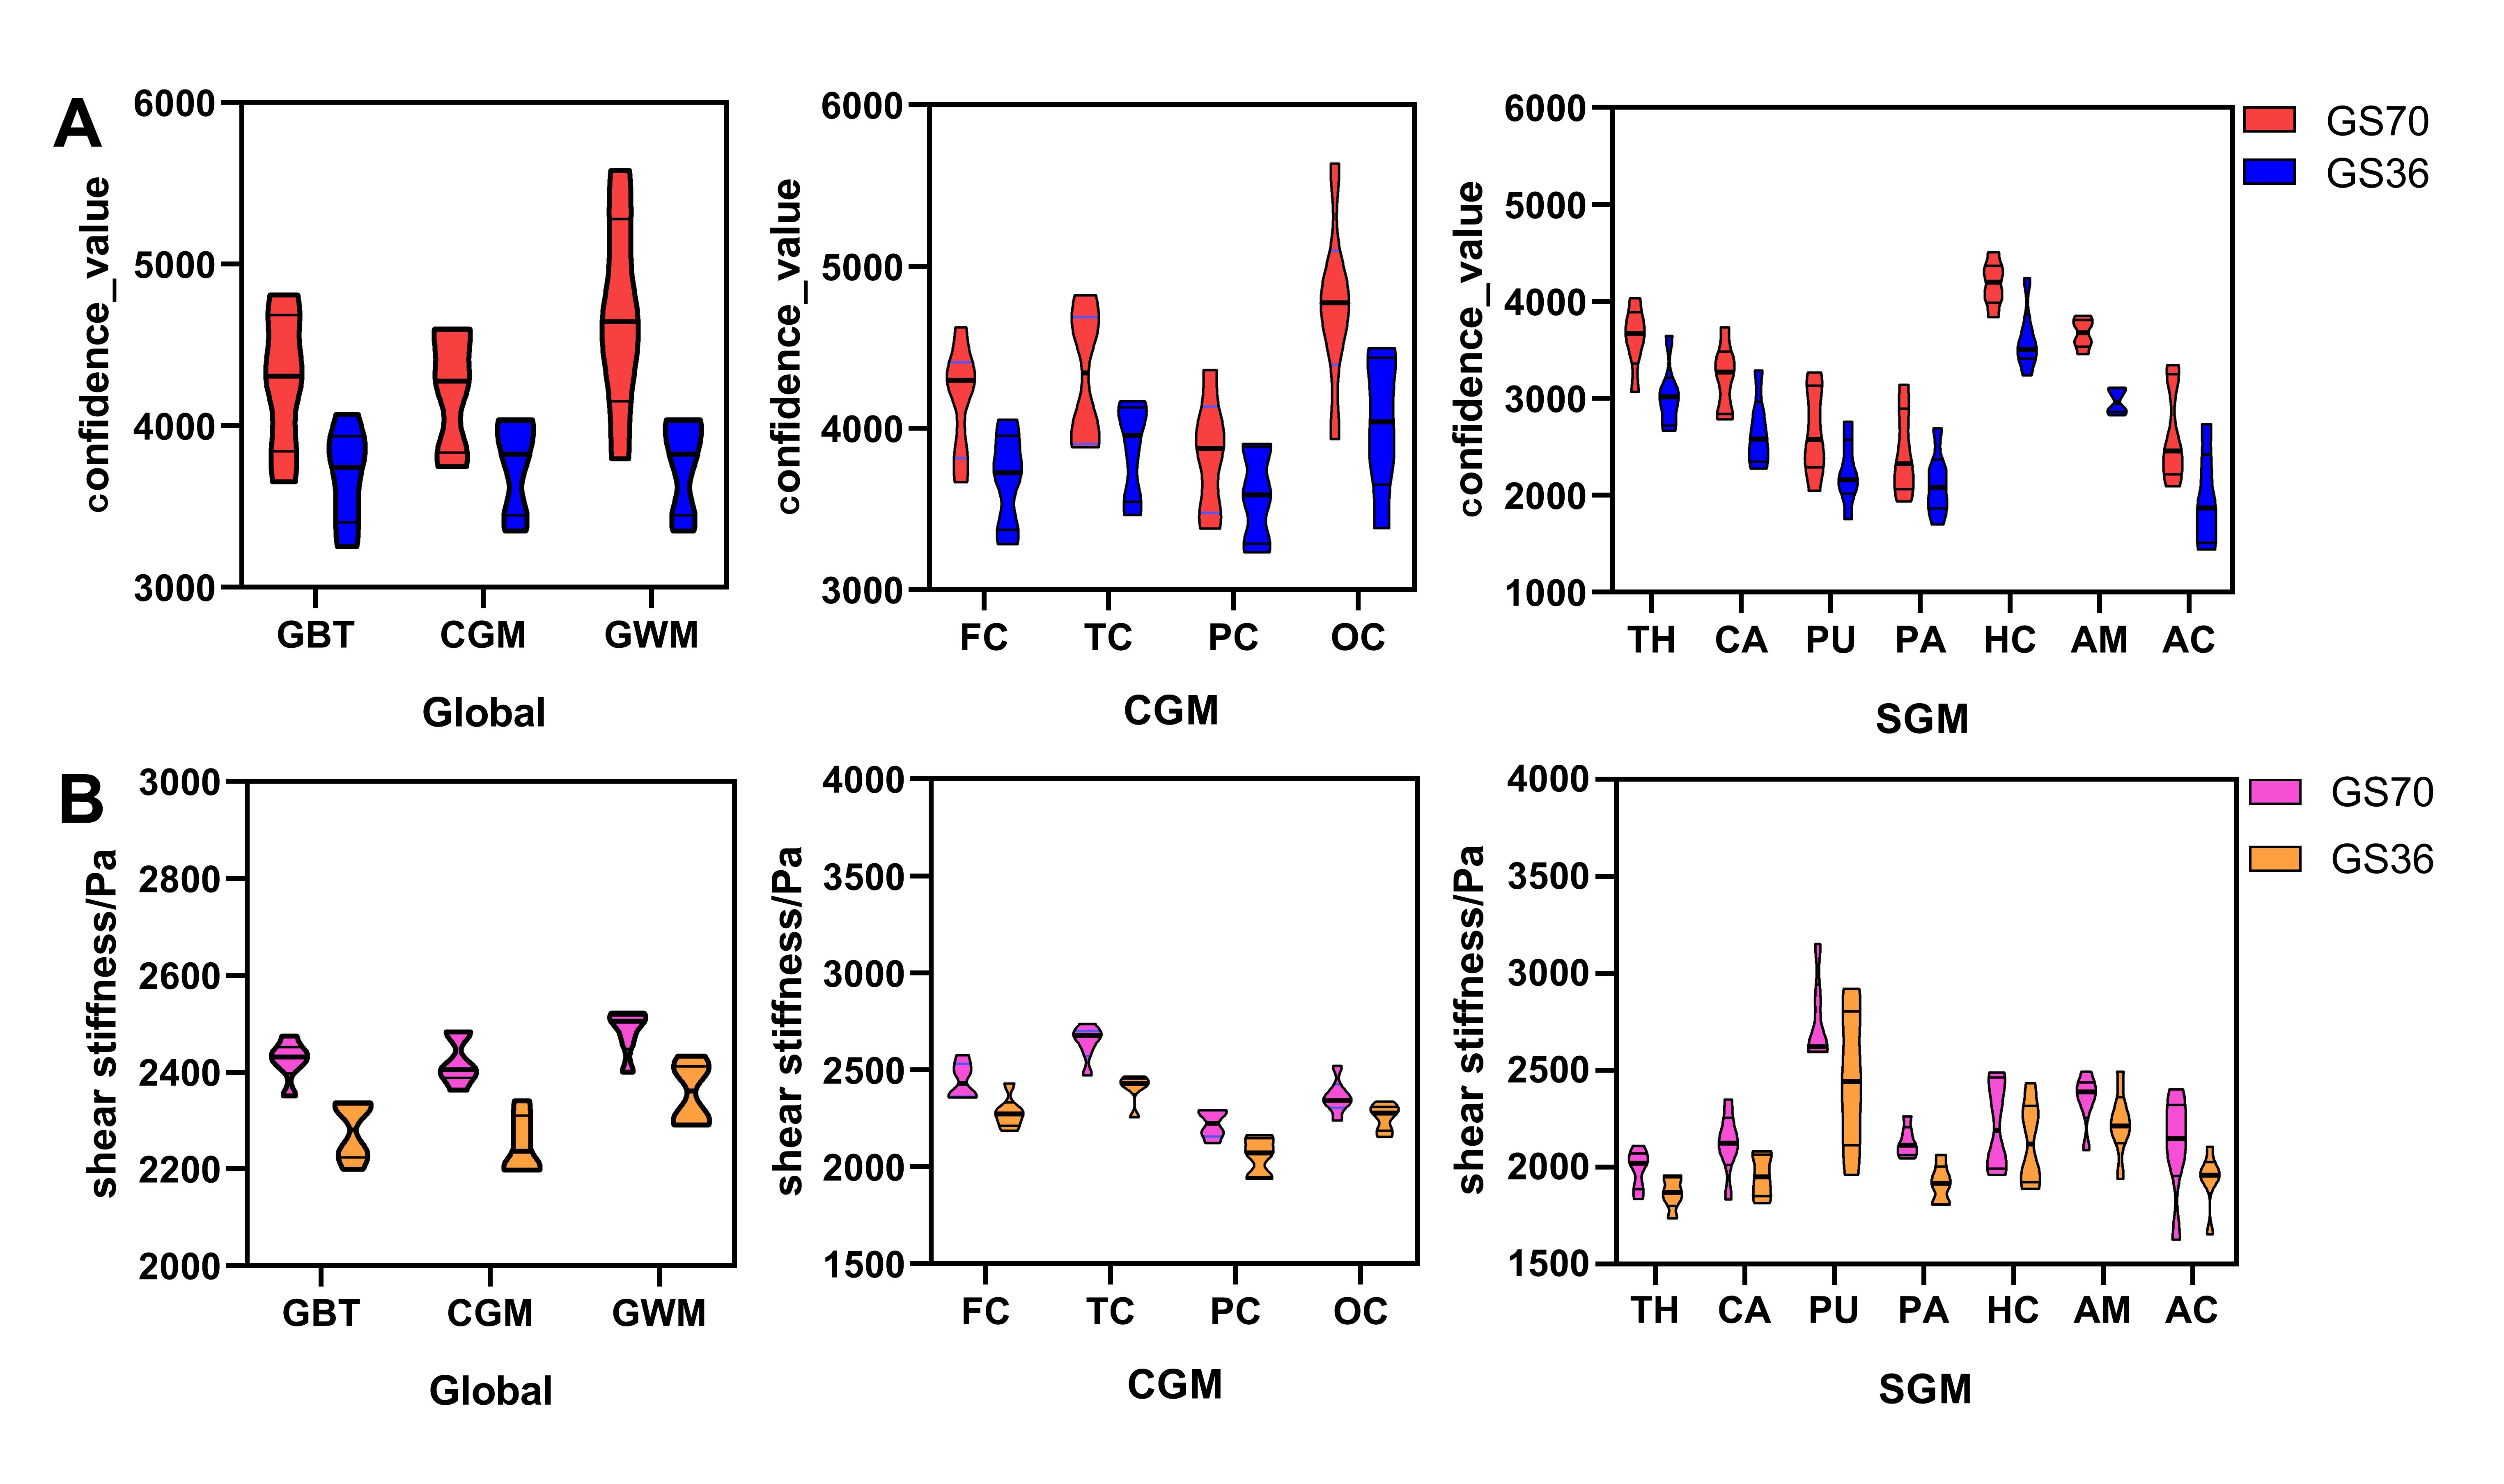
Figure 2 illustrates the shear stiffness map, z-axis wave image, confidence map, and binary confidence map under different gradient strengths,reveals that at a gradient strength (GS) of 70mT/m, clear and continuous shear wave propagation of z-axis shear waves was observed in deep brain tissues, accompanied by a slight increase in shear stiffness values compared to GS of 36mT/m; The confidence map indicated significantly higher confidence values for the entire brain at 70mT/m compared to 36mT/m. After binarization of the confidence map, a larger analyzable area was observed at 70mT/m, allowing for more accurate and analyzable data. Quantitative analysis of the confidence map showed a significant improvement in confidence values for all regions of interest (p<0.05). Therefore, GS of 70mT/m yielded more accurate data. Quantitative analysis of the shear stiffness map also revealed higher parameter values, attributed to the influence of gradient field strength on the amplitude of phase information generated in magnetic resonance elastography, thus affecting the final inversion results.Disscussion
The inclusion of motion encoding gradients (MEG) in specific MRI sequences is fundamental for recognizing and capturing tiny displacements generated by harmonic motion, forming the basis of MRE imaging[4]. Achieving effective, clear, and continuous wave propagation in deep brain tissues is essential for accurate whole-brain biomechanical information inversion calculations[5]. A comparison of different gradient strengths showed that higher gradient field strength enhances MEG's efficiency in recognizing and capturing small displacements, resulting in clearer and continuous harmonic propagation in wave images. Theoretically, increasing gradient field strength during phase unwrapping and conversion processes can reduce the influence of background phase and noise phase on the real harmonic motion phase. Consequently, this leads to more accurate biomechanical feature information during the inversion calculation process. Obtaining analyzable and trustworthy data for the entire brain is challenging due to the brain's unique geometric characteristics and biological structural composition. Therefore, opting for higher gradient field strength in whole-brain MRE is advantageous for obtaining more accurate and reliable data.Acknowledgements
This work was supported by the National Natural Science Foundation of China (81971581, 82272618) . Please address correspondence to Jian Yang, e-mail: yj1118@mail.xjtu.edu.cn and Xianjun Li, e-mail: xianj.li@mail.xjtu.edu.cn., Miaomiao Wang, e-mail: wangmm407@163.com.References
1. Hiscox LV, Johnson CL, Barnhill E, McGarry MD, Huston J, van Beek EJ, Starr JM, Roberts N: Magnetic resonance elastography (MRE) of the human brain: technique, findings and clinical applications. Phys Med Biol 2016, 61(24):R401-r437.
2. Guenthner C, Kozerke S: Encoding and readout strategies in magnetic resonance elastography. NMR Biomed 2018, 31(10):e3919.
3. Guenthner C, Runge JH, Sinkus R, Kozerke S: Analysis and improvement of motion encoding in magnetic resonance elastography. NMR Biomed 2018, 31(5):e3908.
4. Manduca A, Bayly PJ, Ehman RL, Kolipaka A, Royston TJ, Sack I, Sinkus R, Van Beers BE: MR elastography: Principles, guidelines, and terminology. Magn Reson Med 2021, 85(5):2377-2390.
5. Arani A, Manduca A, Ehman RL, Huston Iii J: Harnessing brain waves: a review of brain magnetic resonance elastography for clinicians and scientists entering the field. Br J Radiol 2021, 94(1119):20200265.
Figures
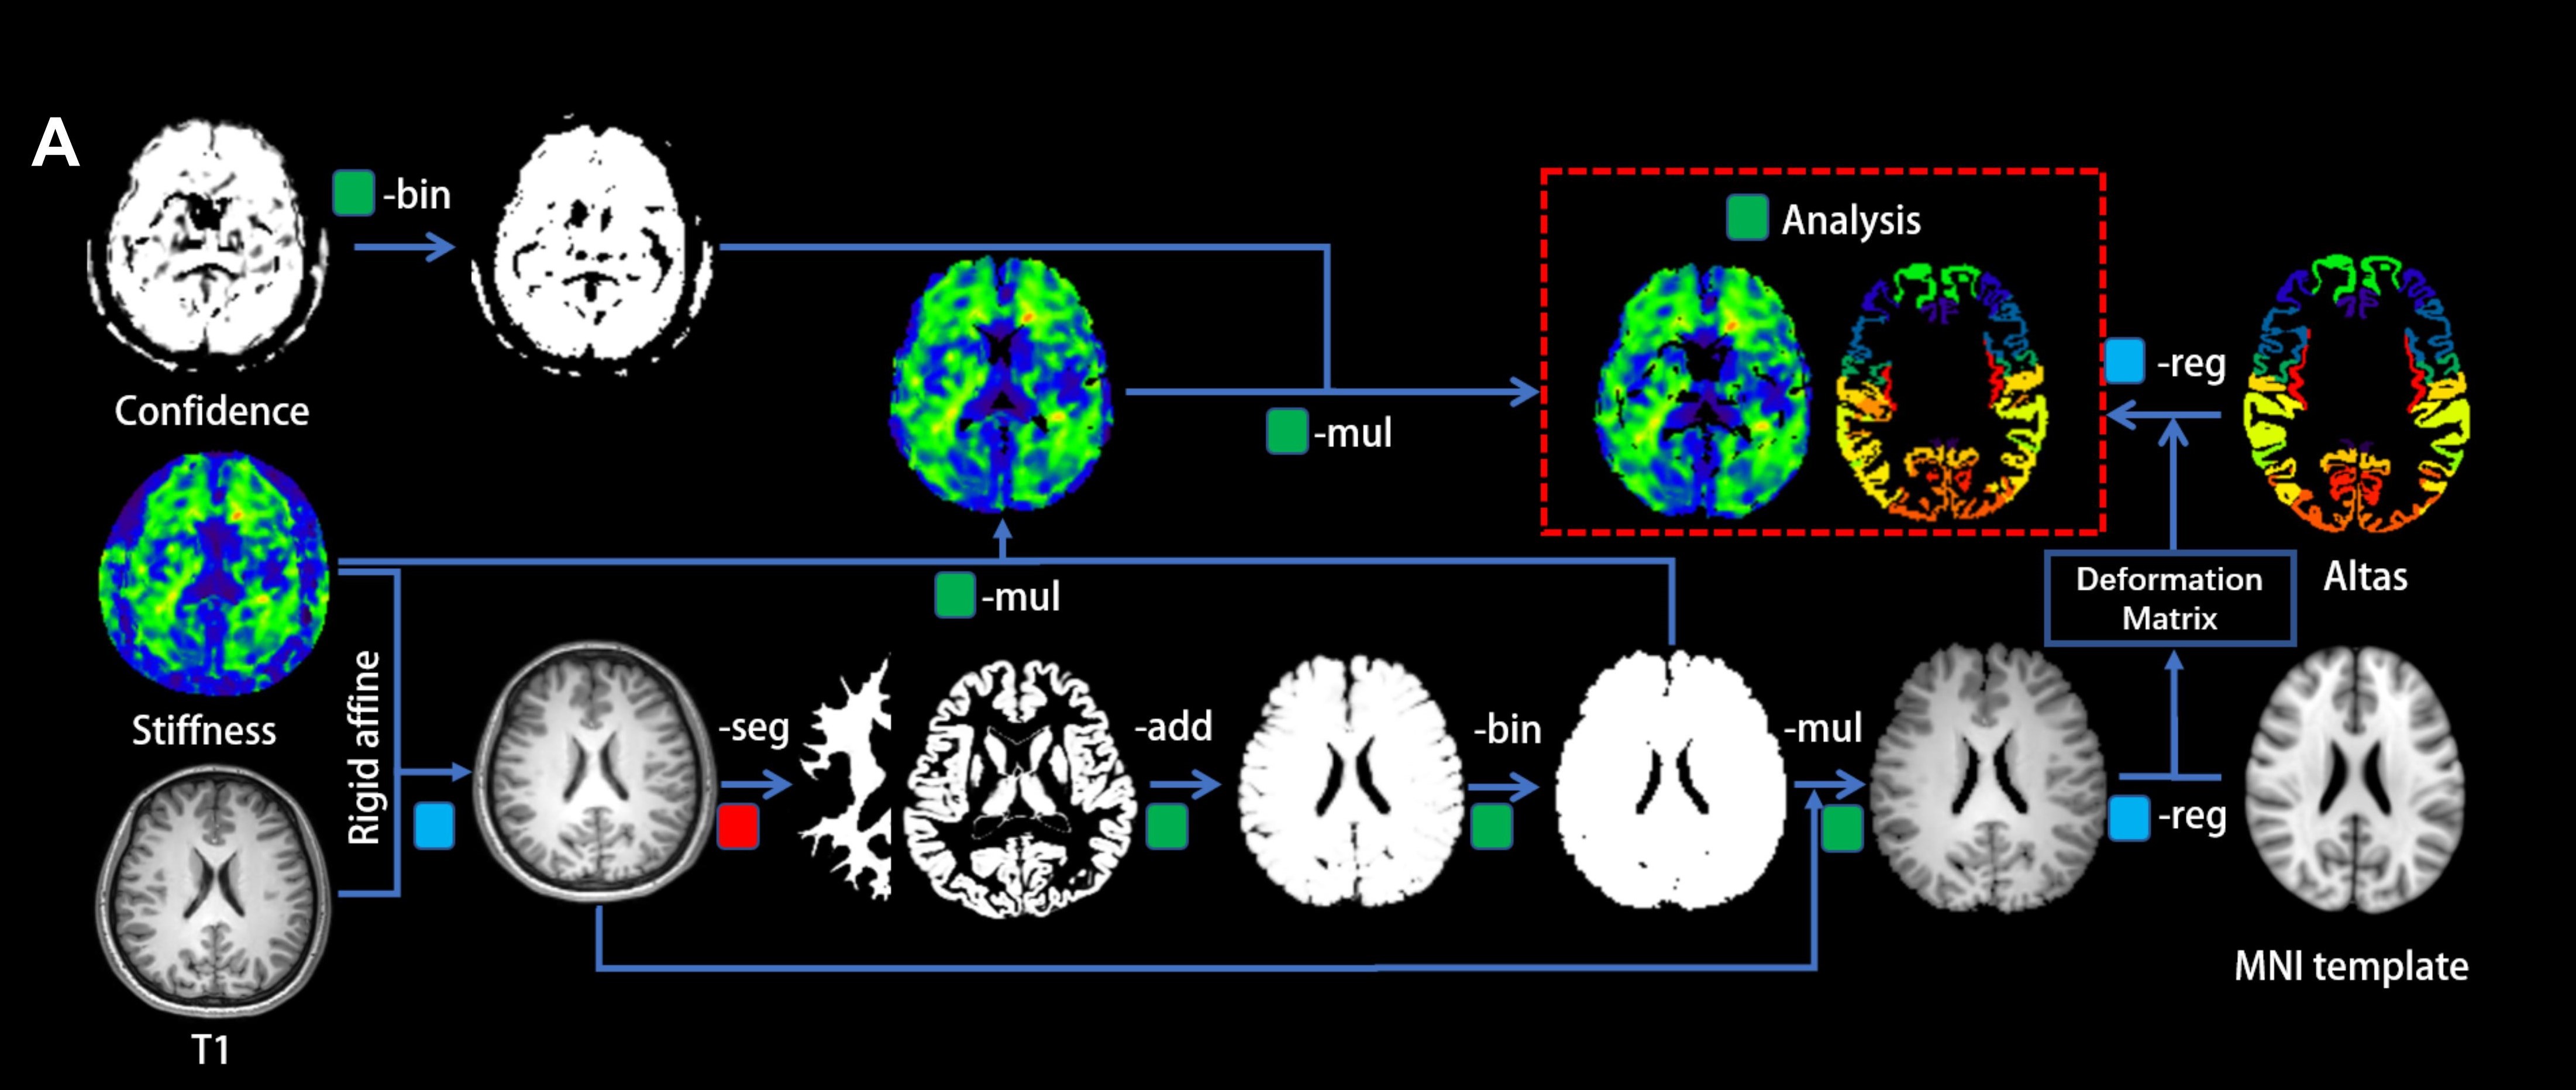
Figure 1: Schematic diagram of MER data post-processing and analysis pipeline
The obtained shear stiffness map was rigidly aligned with T1WI images. Subsequently, the MNI 1mm T1 image was registered to the individual T1WI image to obtain a deformation matrix. Finally, by using the deformation matrix, the atlas was mapped onto individual shear stiffness maps for analysis.