4227
Volumetric Assessment of Brain MRIs of Fetuses with Spina Bifida1Department of Radiology and Biomedical Research Imaging Center (BRIC), The University of North Carolina at Chapel Hill, Chapel Hill, NC, United States, 2Department of Radiology, The University of North Carolina at Chapel Hill, Chapel Hill, NC, United States
Synopsis
Keywords: Prenatal, Brain, Fetal spina bifida; deep learning; segmentation; brain development
Motivation: Spina bifida occurs during the first gestational month and causes lifelong disabilities. If fetuses with spina bifida are left undiagnosed or untreated, spinal cord defects are translated into brain abnormalities.
Goal(s): Our goal is to annotate brain regions in fetal MRIs to study typical and atypical fetal brain development in spina bifida.
Approach: We developed a deep learning fetal brain MRI segmentation method and modeled growth to statistically compare brain volumes of normal and pathological cohorts.
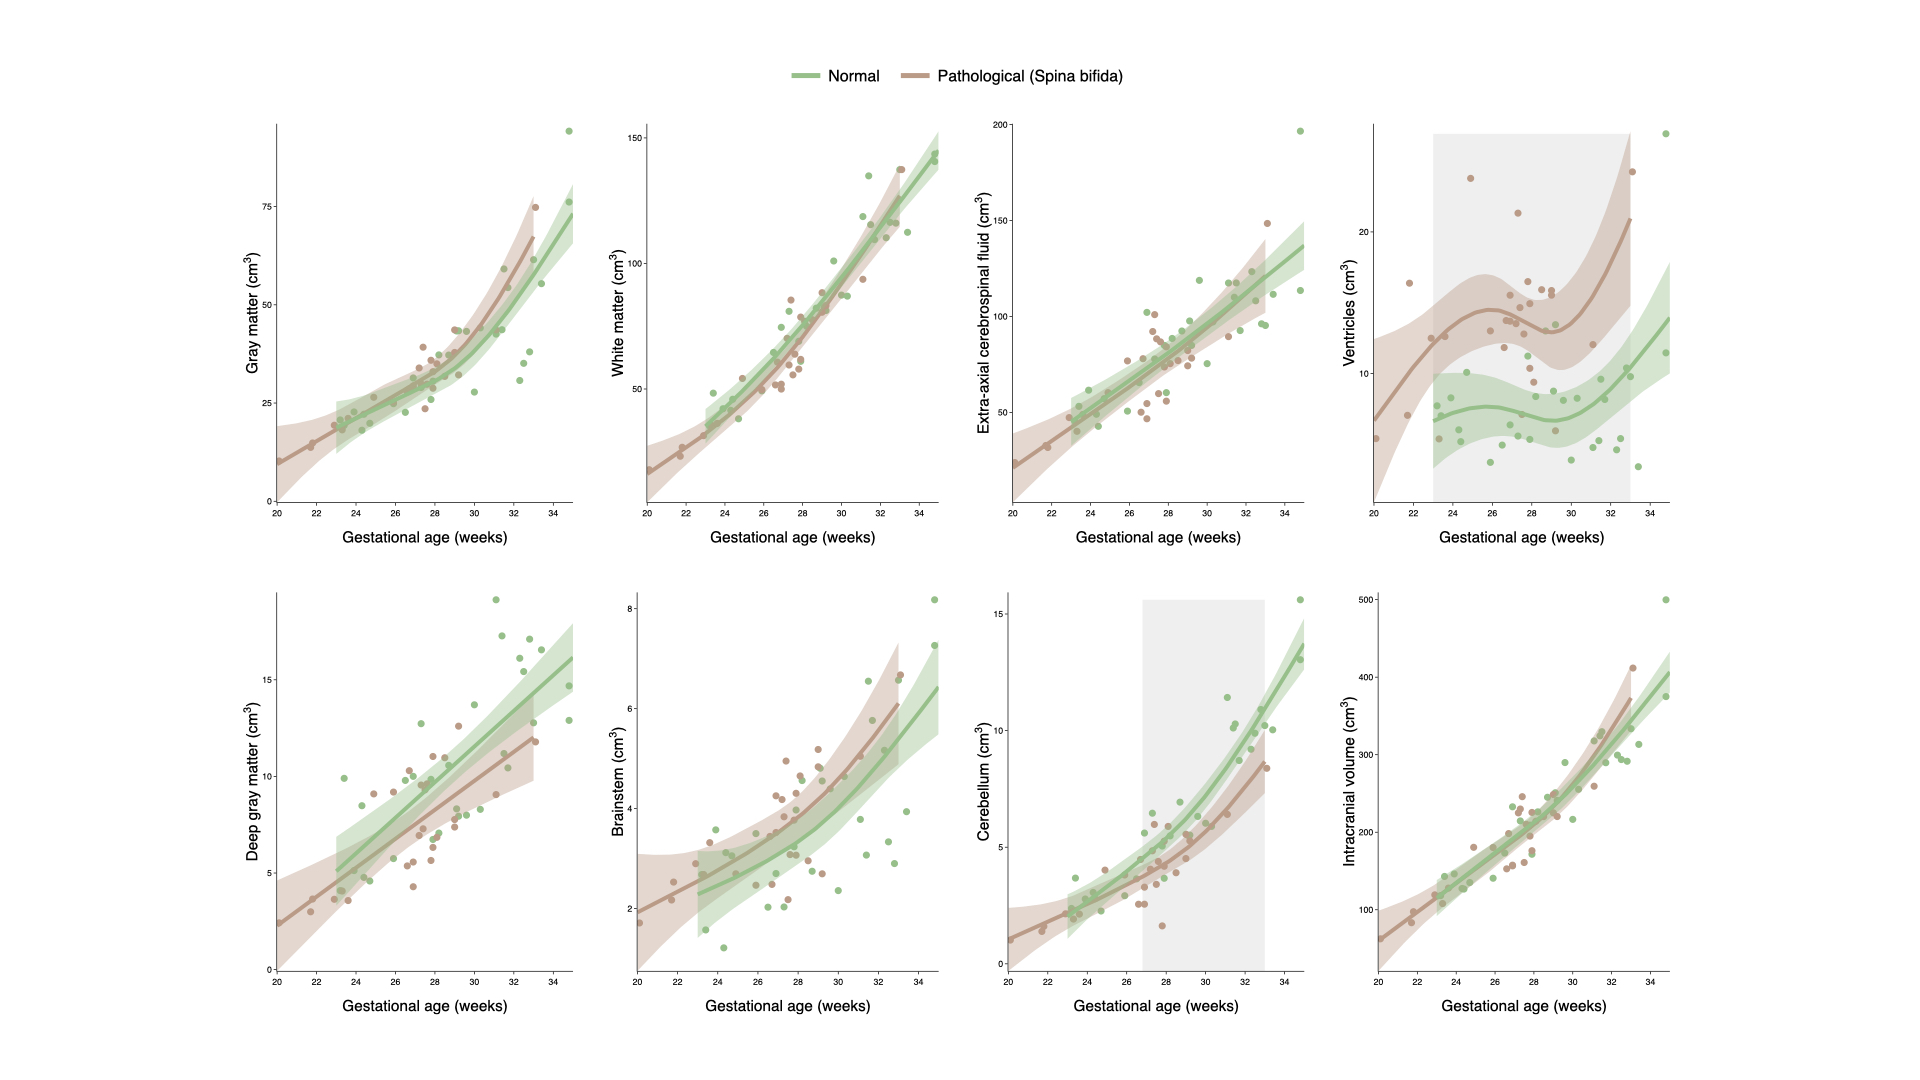
Results: Our segmentation method reliably annotates fetal brain MRIs. We observed significant increase in the ventricles and significant reduction of the cerebellum in fetuses with spina bifida.
Impact: Fetal brain MRI segmentation with our segmentation model enables precise delineation of brain tissues and anatomical structures, allowing early detection of aberrant brain development due to congenital defects such as spina bifida.
Introduction
Spina bifida is a congenital defect that causes malformation of the spinal column and results in serious lifelong morbidity. The global prevalence of spina bifida is high, and in the United States, about 1,400 babies are born with this defect every year1. This dysfunctional programming at the embryonic stage modulates fetal brain development. Latest advancements in fetal MRI have improved our understanding of intra-uterine brain growth and enabled characterization of abnormalities. Our goal here is to study early brain development for normal fetuses and those diagnosed with spina bifida. To this end, we develop a deep learning fetal brain MRI segmentation method and statistically compare whole-brain and regional growth trajectories of volumes derived from normal and pathological cohorts.Materials and Methods
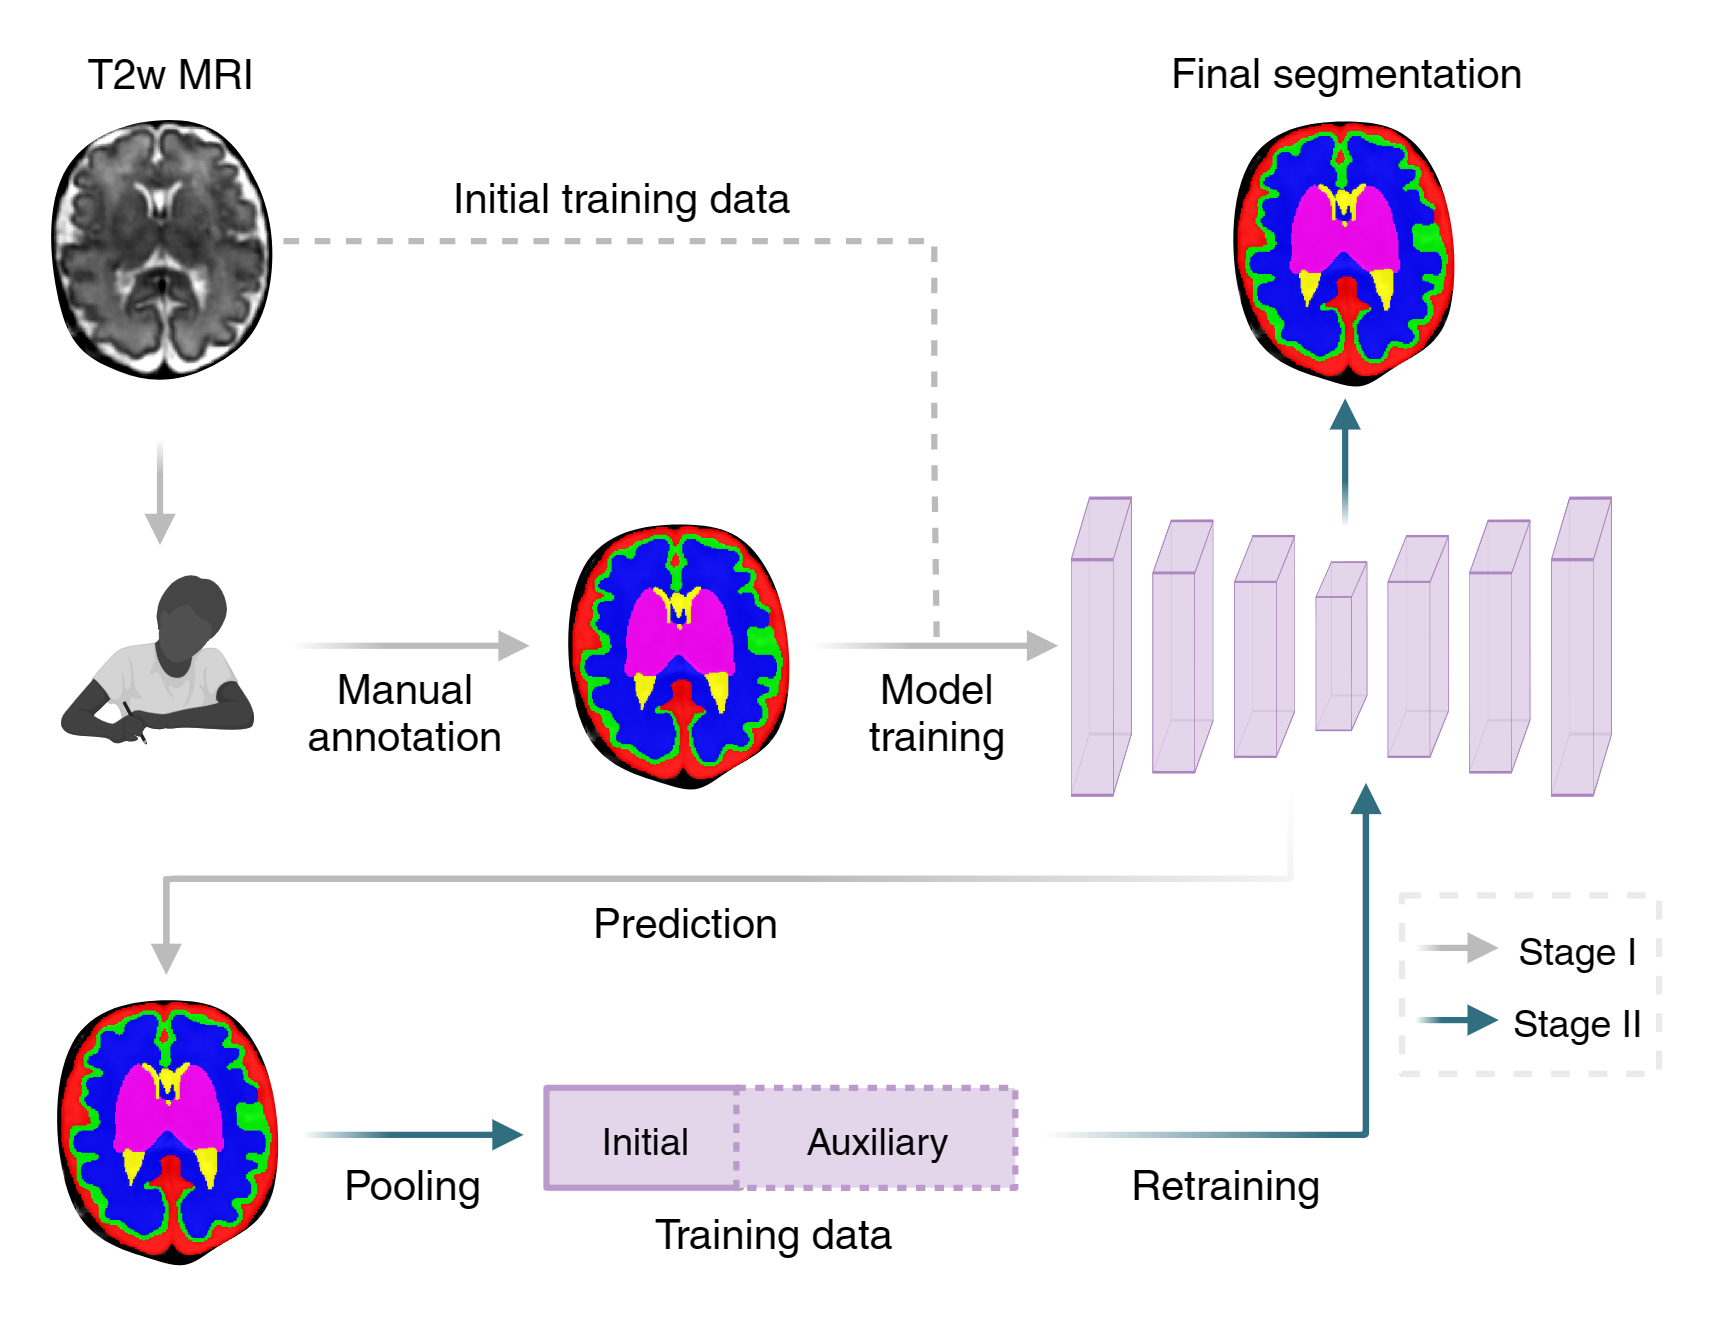
We used T2-weighted (T2w) MRIs acquired between 20 and 35 gestational weeks as part of the Fetal Tissue Annotation and Segmentation (FeTA) dataset2. The MRI dataset is augmented with manual annotations for brain tissues (gray matter - GM; white matter - WM; extra-axial cerebrospinal fluid - EA-CSF) and anatomical structures (deep GM; ventricles; cerebellum; and brainstem) for both normal and pathological scans (fetuses with spina bifida). We developed a deep learning fetal brain MRI segmentation method via a two-stage training framework (Figure 1). In the first stage, the segmentation network (nnUNet3) is trained with the T2w MRIs of normal fetuses. In the second stage, labels for new MRIs inferred with the trained network are pooled with the initial training data to retrain the segmentation network. The final trained network is applied to both the normal and pathological MRIs. To quantify differences between the normal and fetuses with spina bifida, we computed volumes of brain tissues and anatomical structures, and fitted a generalized additive mixed model (GAMM) for each region, with volume as a smooth function of age and an additional interaction term of age and cohort (normal / pathological). We used simultaneous 95% confidence bands to identify brain regions that show significant differences in spina bifida. The age window where the confidence bands did not include zero were denoted as time periods of significant differences between the two cohorts. The velocity curves (rates of change) for regional and intracranial volumes were determined by computing the first derivative of the normal and pathological trajectories.Results and Discussion
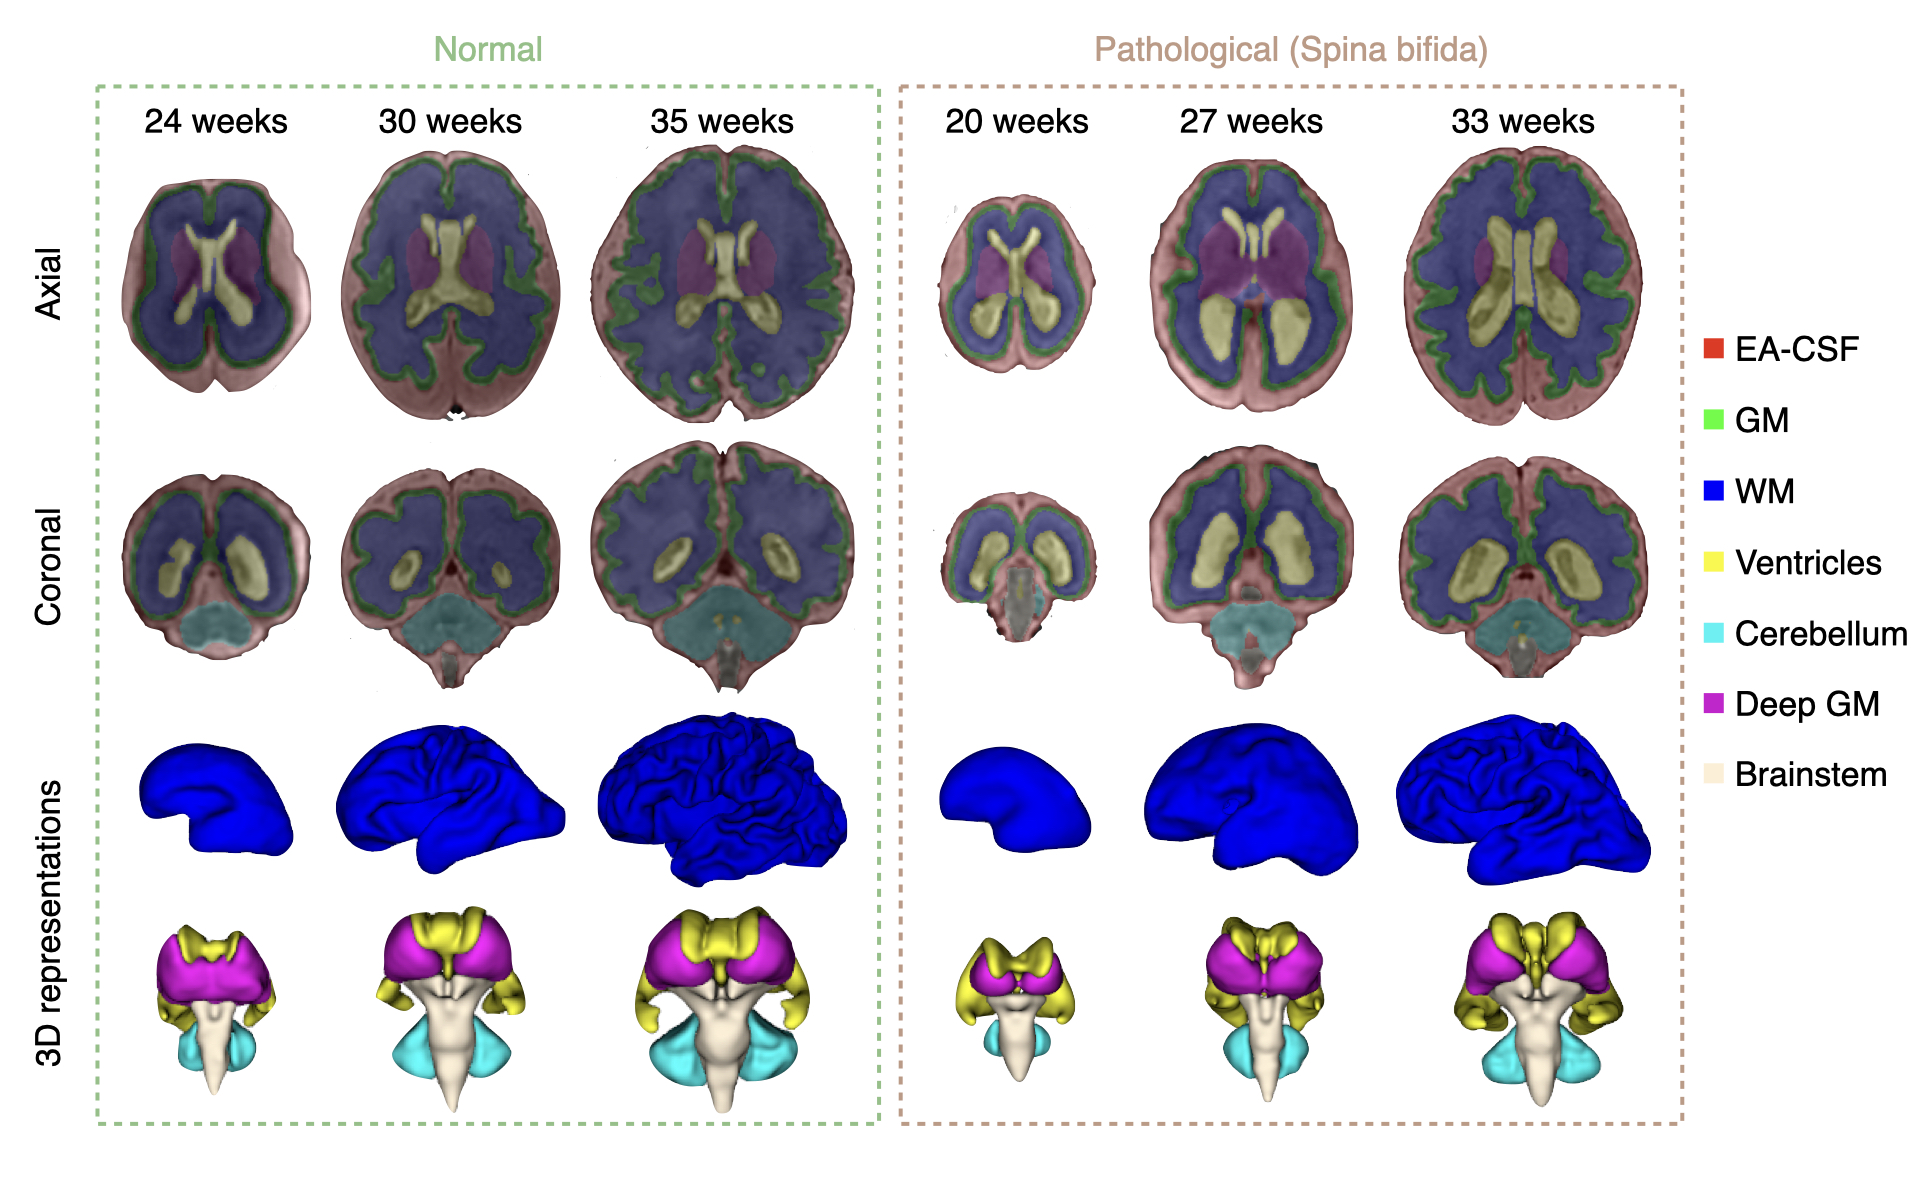
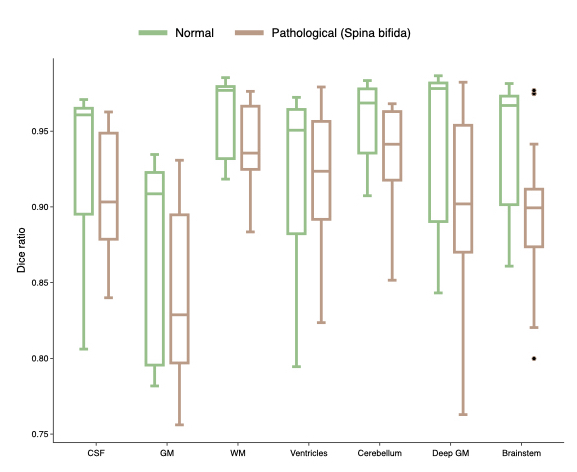
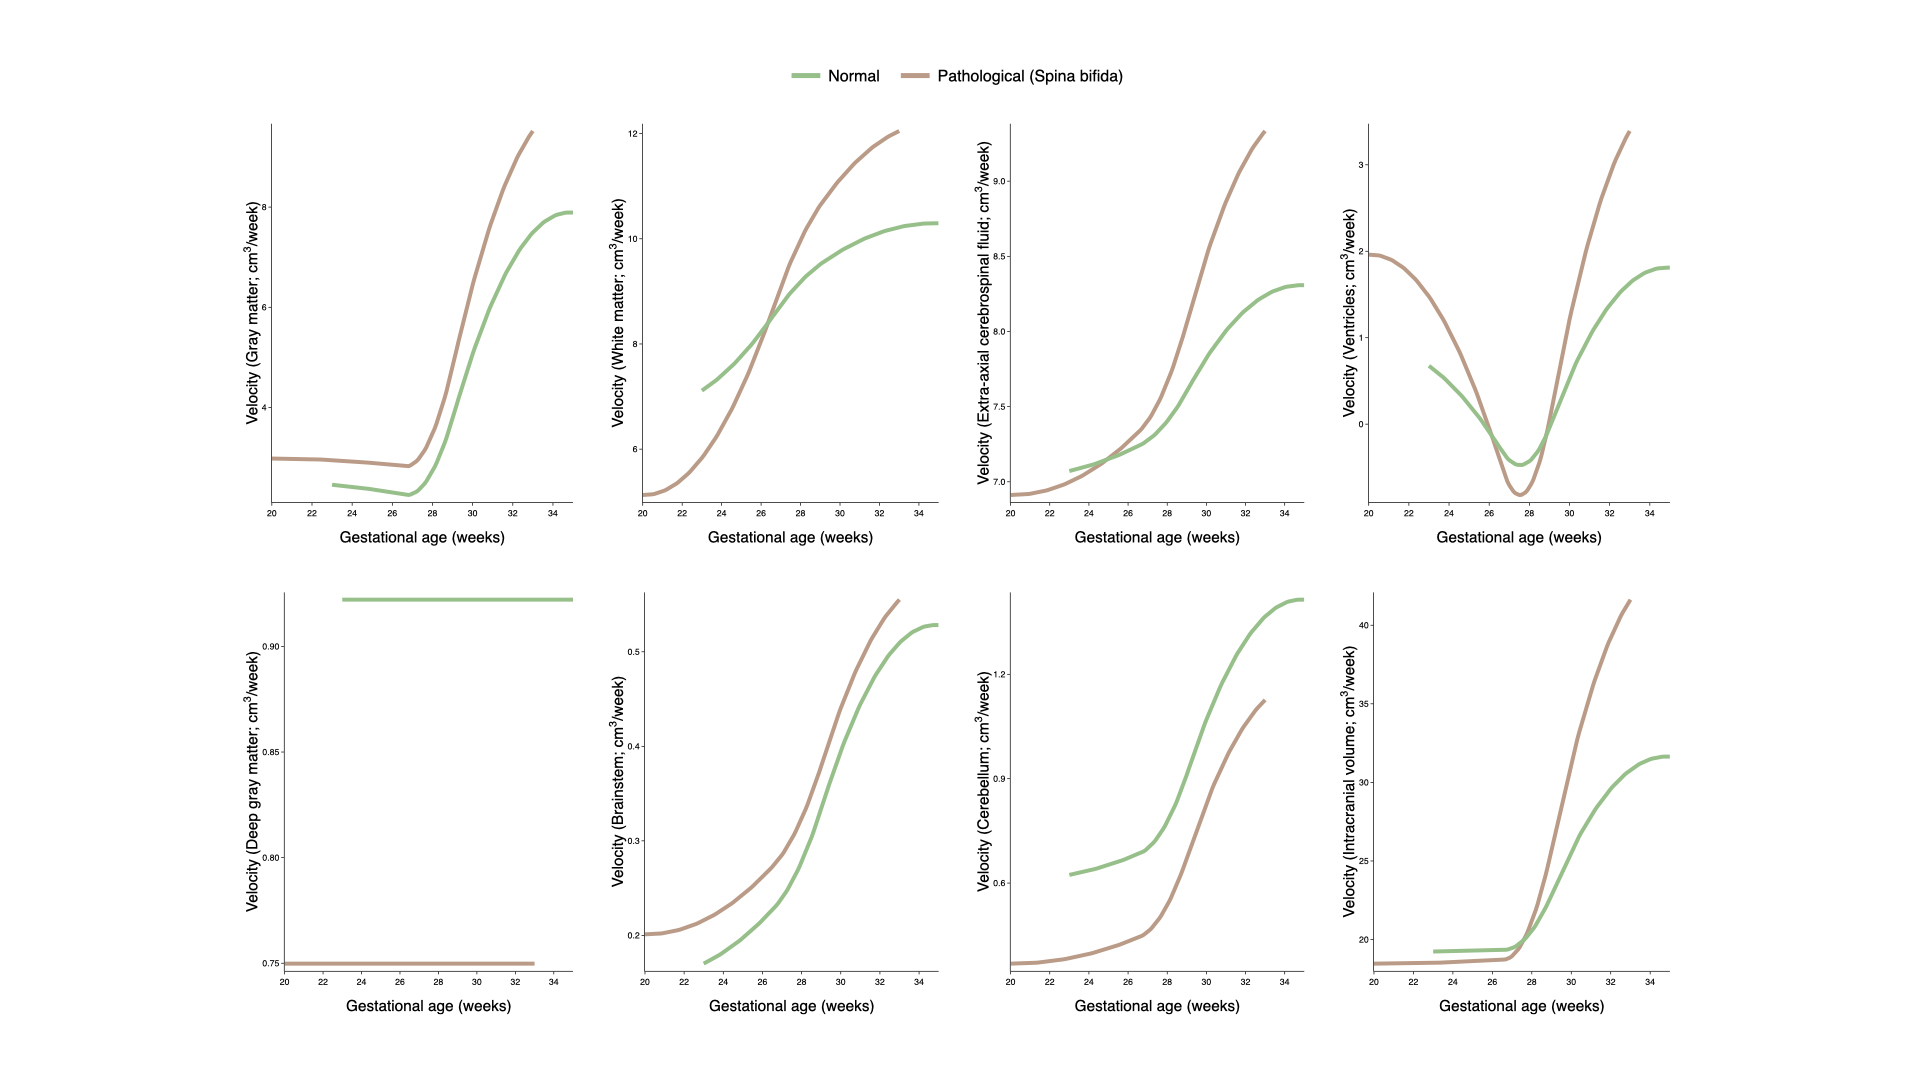
The segmentation results for both the normal and spina bifida cases at different gestational ages are shown in Figure 2. Despite rapid prenatal changes in brain morphology, our segmentation method accurately annotates brain tissues and anatomical structures. The Dice ratios computed between the ground truth and predicted annotations are consistently high for all the brain regions (Figure 3). The volumes of the annotated brain regions increase prenatally for both the normal and spina bifida fetuses (Figure 4). However, in spina bifida, the ventricles and cerebellum significantly deviate from the normal trajectories (p < 0.01). Spina bifida shrinks the cerebellum, compresses the fourth ventricle, and ultimately dilates the lateral ventricles. We also show the volumetric velocity curve of each brain region in Figure 5.Conclusion
Our deep learning fetal brain MRI segmentation method can accurately and consistently annotate brain tissues and anatomical structures in normal and spina bifida cases. The normative growth trajectories are indicative of rapid in-utero increase in volumes of different brain regions. Fetuses with spina bifida show significantly increased ventricular volumes and significantly reduced cerebellar volumes.Acknowledgements
This work was supported in part by National Institutes of Health (NIH) grants EB008374 and MH125479.References
- Data & statistics on spina bifida. Centers for Disease Control and Prevention. Oct 2023.
- Payette, K. et al. An automatic multi-tissue human fetal brain segmentation benchmark using the Fetal Tissue Annotation Dataset. Scientific Data. 2021; 8:167.
- Isensee F, et al. nnU-Net: a self-configuring method for deep learning-based biomedical image segmentation. Nature Methods. 2021;18:203 - 211.
Figures