4224
Visualising and Segmenting the Thalamic Reticular Nucleus at 7T1Physics and Astronomy, SPMIC, University of Nottingham, Nottingham, United Kingdom, 2School of Psychology, University of Birmingham, Birmingham, United Kingdom
Synopsis
Keywords: White Matter, Microstructure, Thalamus, SWI
Motivation: The in-vivo study of the Thalamic Reticular Nucleus is of fundamental interest and relies on the development of a pipeline for visualising and segmenting the structure.
Goal(s): Presented is a a potential framework for inducing contrast at the TRN boundary that can guide future studies in creating functional maps of the TRN.
Approach: T1 weighted FLASH and susceptibility weighted imaging paradigms are explored in a number of participants and a novel segmentation approach is tested on these data sets.
Results: The TRN is visible to a variable degree in all participants and size stable masks of the structure are produced.
Impact: This work is a stepping stone in the creation of a robust framework for visualising and segmenting the Thalamic Reticular Nucleus. It can help guide future studies which seek to explore the TRN function in-vivo.
Introduction
The Thalamic Reticular Nucleus (TRN) is a thin sheet of inhibitory GABAergic cells that covers the dorsal side of the Thalamus [1]. All motor and sensory information, for which the thalamus is a relay point, must pass through the TRN en-route from the cortex to thalamus and vice versa[2,3,4](see figure 1). As such the TRN is in a position to control corticothalamic and thalamocortical information flow. In vivo study of the TRN is of fundamental interest in the understanding how the brain interacts with the external world, as well as for of many common neurological conditions including schizophrenia[5] and epilepsy[6,7]. However, before functional in vivo studies exploring the TRN can be undertaken a reliable segmentation approach is needed. This is not trivial due to the structure’s size (2-4mm) and location at the centre of the brain and the limited available contrast distinguishing it from adjacent thalamic structures.This abstract extends previous work[8] and aims to describe how the FLASH sequence can be used to identify and segment the TRN at 7T, using magnitude and phase data and a novel segmentation approach.
Method
T1 weighted Fast Low Angle SHot (FLASH) images have previously been found to be a reasonably reliable method of visualising the TRN at 7T[8], this sequence was acquired in six participant in both a multi-slice and 3D regime with flip angles and TRs adjusted to the Ernst angle for T1>800ms[9]. One of dataset was discarded due to large motion artefacts. Volumes were aligned along the AC-PC line to give best visualisation of the TRN.To enhance contrast, SWI images were formed from the FLASH data by taking the high-pass filter of the Fourier transformed complex data and multiplying the resultant phase by the original magnitude image to 5th power[10].
The TRN in these images appears as a strip of high intensity voxels between two low intensity contours. A novel segmentation algorithm was developed which takes the average intensity along overlapping perpendicular profiles from a user-inputted seed line to create a map of the local voxel intensities along the TRN in each slice. A contiguous line with signal close to maximum intensity, through the map for the initial seeded slice, is found in an iterative process. This is repeated for adjacent slices limited by spatial constraints from previous slices. The mapped high intensity voxels form the shell of the TRN which gains width through thresholding of local voxels to 0.8X the maximum voxel within the shell. Figure 2 demonstrates this process.
Results
Figure 3 shows a Multi Slice FLASH (A) scan with a TR of 600ms and α = 60° (which gives maximum signal at T1 of 866ms) and a 3D FLASH (B) with a TR of 50 and α of 20° (maximum signal at T1 of 804ms). Greater SNR can be achieved in MS due to longer TRs however 3D offers better coverage (slices acquired without a gap) in reasonable acquisition times.Figure 4 shows magnitude and SWI images of a 3D FLASH acquisition from 5 participants in the second and third columns. Key participant information in the first column and the features of the acquisition described in the fourth.
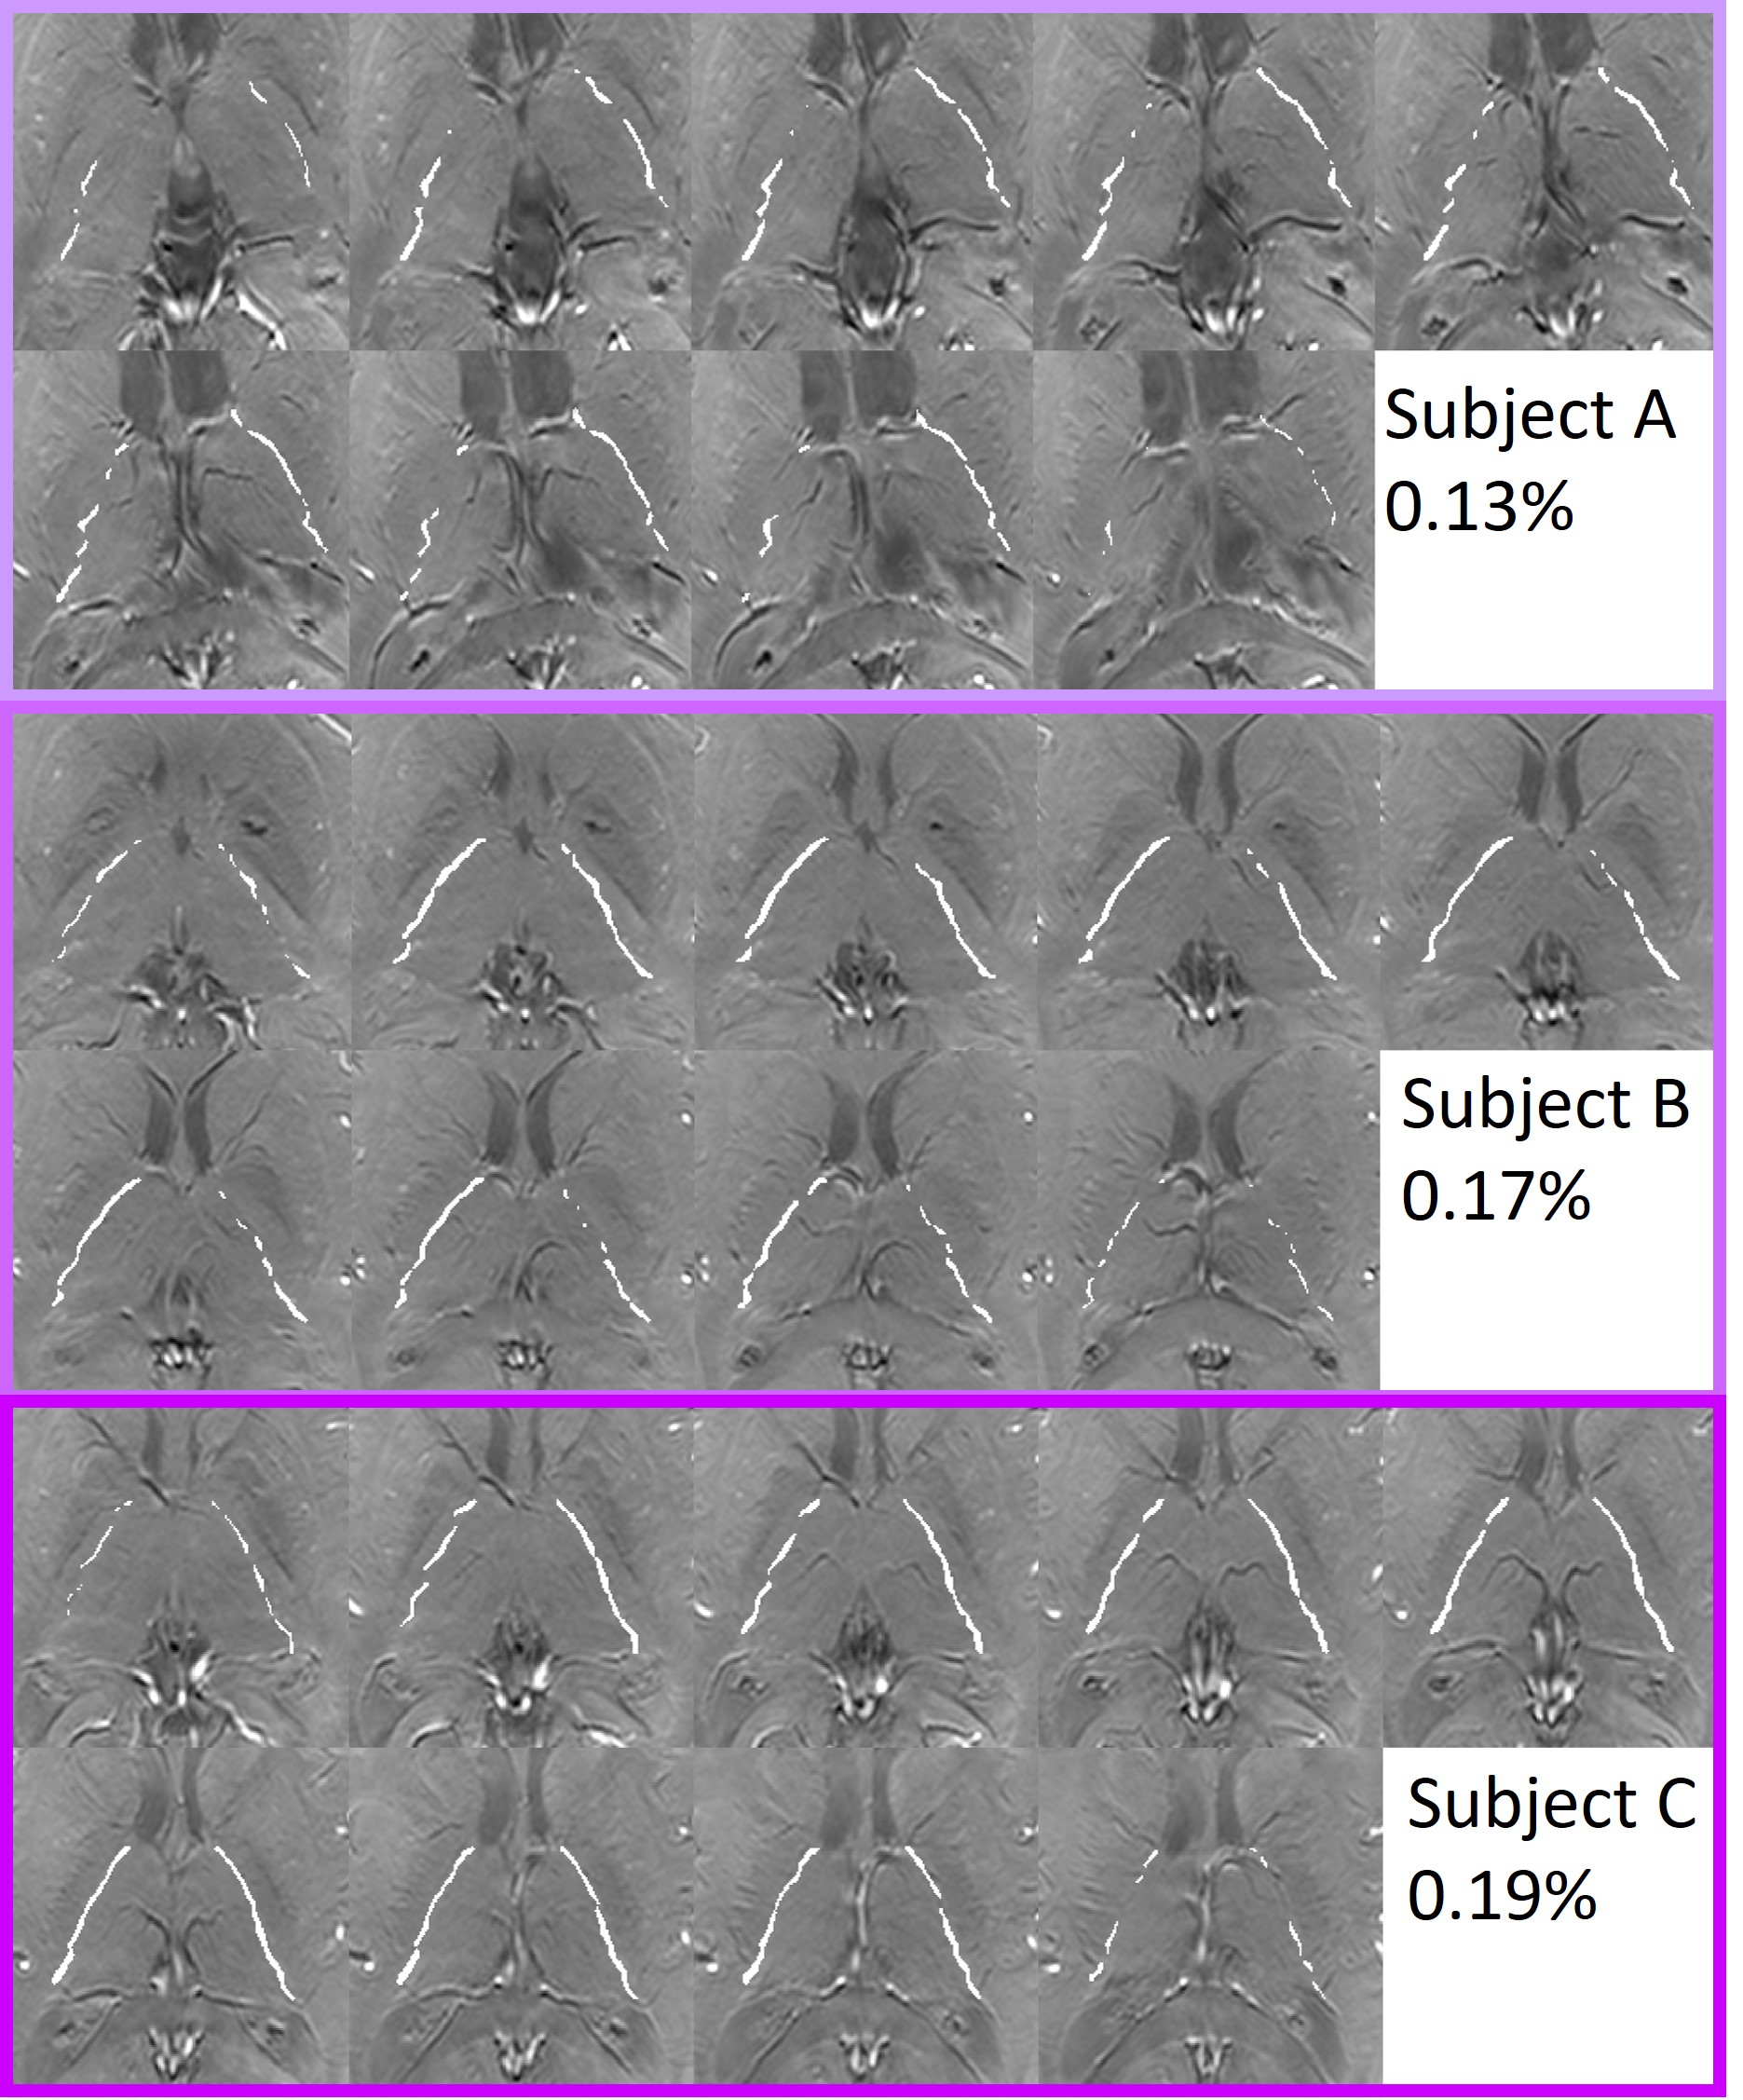
Figure 5 shows the estimated TRN masks in each slice of the first three participants using the novel segmentation approach along with the ROI size, taken as the number of voxels in the ROI over the number of voxels in the brain
Discussion
Generally, the TRN is more visible on one side of the brain. This may be due to the geometry of the thalamus in relation to the imaging plane or may be related to the participants hand chirality as suggested by participants A,B and E who show TRN on the opposite side of the brain to heir hand dominance, which may allude to the TRNs role in motor function.The consistency of the measured TRN size fraction suggest that the size of the TRN is stable relative to brain size. Future work will continue to explore alternate contrast regimes to best identify the optimum method of imaging the TRN. This will include generating T1 maps over the thalamus. Head angle relative to the B0 field will also be explored, as the white matter strands that form the TRN may have a magnetic field dependence on angle which could be used to enhance contrast[11].
Conclusion
An imaging protocol and segmentation algorithm have been developed which can reliably image the TRN at 7T. This will now be used to further optimize the imaging sequences and investigate variations in the anatomy between subjects.Acknowledgements
I would like to thank my supervisors Penny Gowland and Richard Bowtell for guiding me on this work, Andrew Bagshaw for motivating the project and all who work at the SPMIC that make this research possible.References
[1] Sherman, S. M. & Guillery, R. W. The role of the thalamus in the flow of information to the cortex. Philos. Trans. R. Soc. Lond. B. Biol. Sci. 357, 1695–1708 (2002).
[2] Saalmann, Y. B., Pinsk, M. a., Wang, L., Li, X. & Kastner, S. The Pulvinar Regulates Information Transmission Between Cortical Areas Based on Attention Demands. Science (80-. ). 337, 753–756 (2012).
[3]Saalmann, Y. B. Intralaminar and medial thalamic influence on cortical synchrony, information transmission and cognition. Front. Syst. Neurosci. 8, 83 (2014).
[4]Crabtree JW, Garraghty PE, Schneider K, Halassa MM, Guido W, Campbell PW. Functional Diversity of Thalamic Reticular Subnetworks. Front Syst Neurosci. 2018;12:41.
[5]Woodward, N. D., Karbasforoushan, H. & Heckers, S. Thalamocortical dysconnectivity in schizophrenia. Am. J. Psychiatry 169, 1092–1099 (2012).
[6]Kostopoulos, G. K. Involvement of the thalamocortical system in epileptic loss of consciousness. Epilepsia 42, 13–19 (2001).
[7] Andrew P. Bagshaw, Sleep onset uncovers thalamic abnormalities in patients with idiopathic generalised epilepsy, NeuroImage: Clinical, Volume 16, 2017, Pages 52-57, ISSN 2213-1582, https://doi.org/10.1016/j.nicl.2017.07.008.
[8] Ross Shaw, Imaging The Thaolmaic reticular Nucleus at 7T, ISMRM 2023 Abstract
[9]Ernst RR, Anderson WA. Application of Fourier transform spectroscopy to magnetic resonance. Rev Sci Instrum 1966; 37:93-102
[10]Haacke EM, Mittal S, Wu Z, Neelavalli J, Cheng YCN. Susceptibility-weighted imaging: Technical aspects and clinical applications, part 1. Am J Neuroradiol. 2009;30(1):19–30.
[11] Bender B, Klose U. The in vivo influence of white matter fiber orientation towards B(0) on T2* in the human brain. NMR Biomed. 2010 Nov;23(9):1071-6
Figures
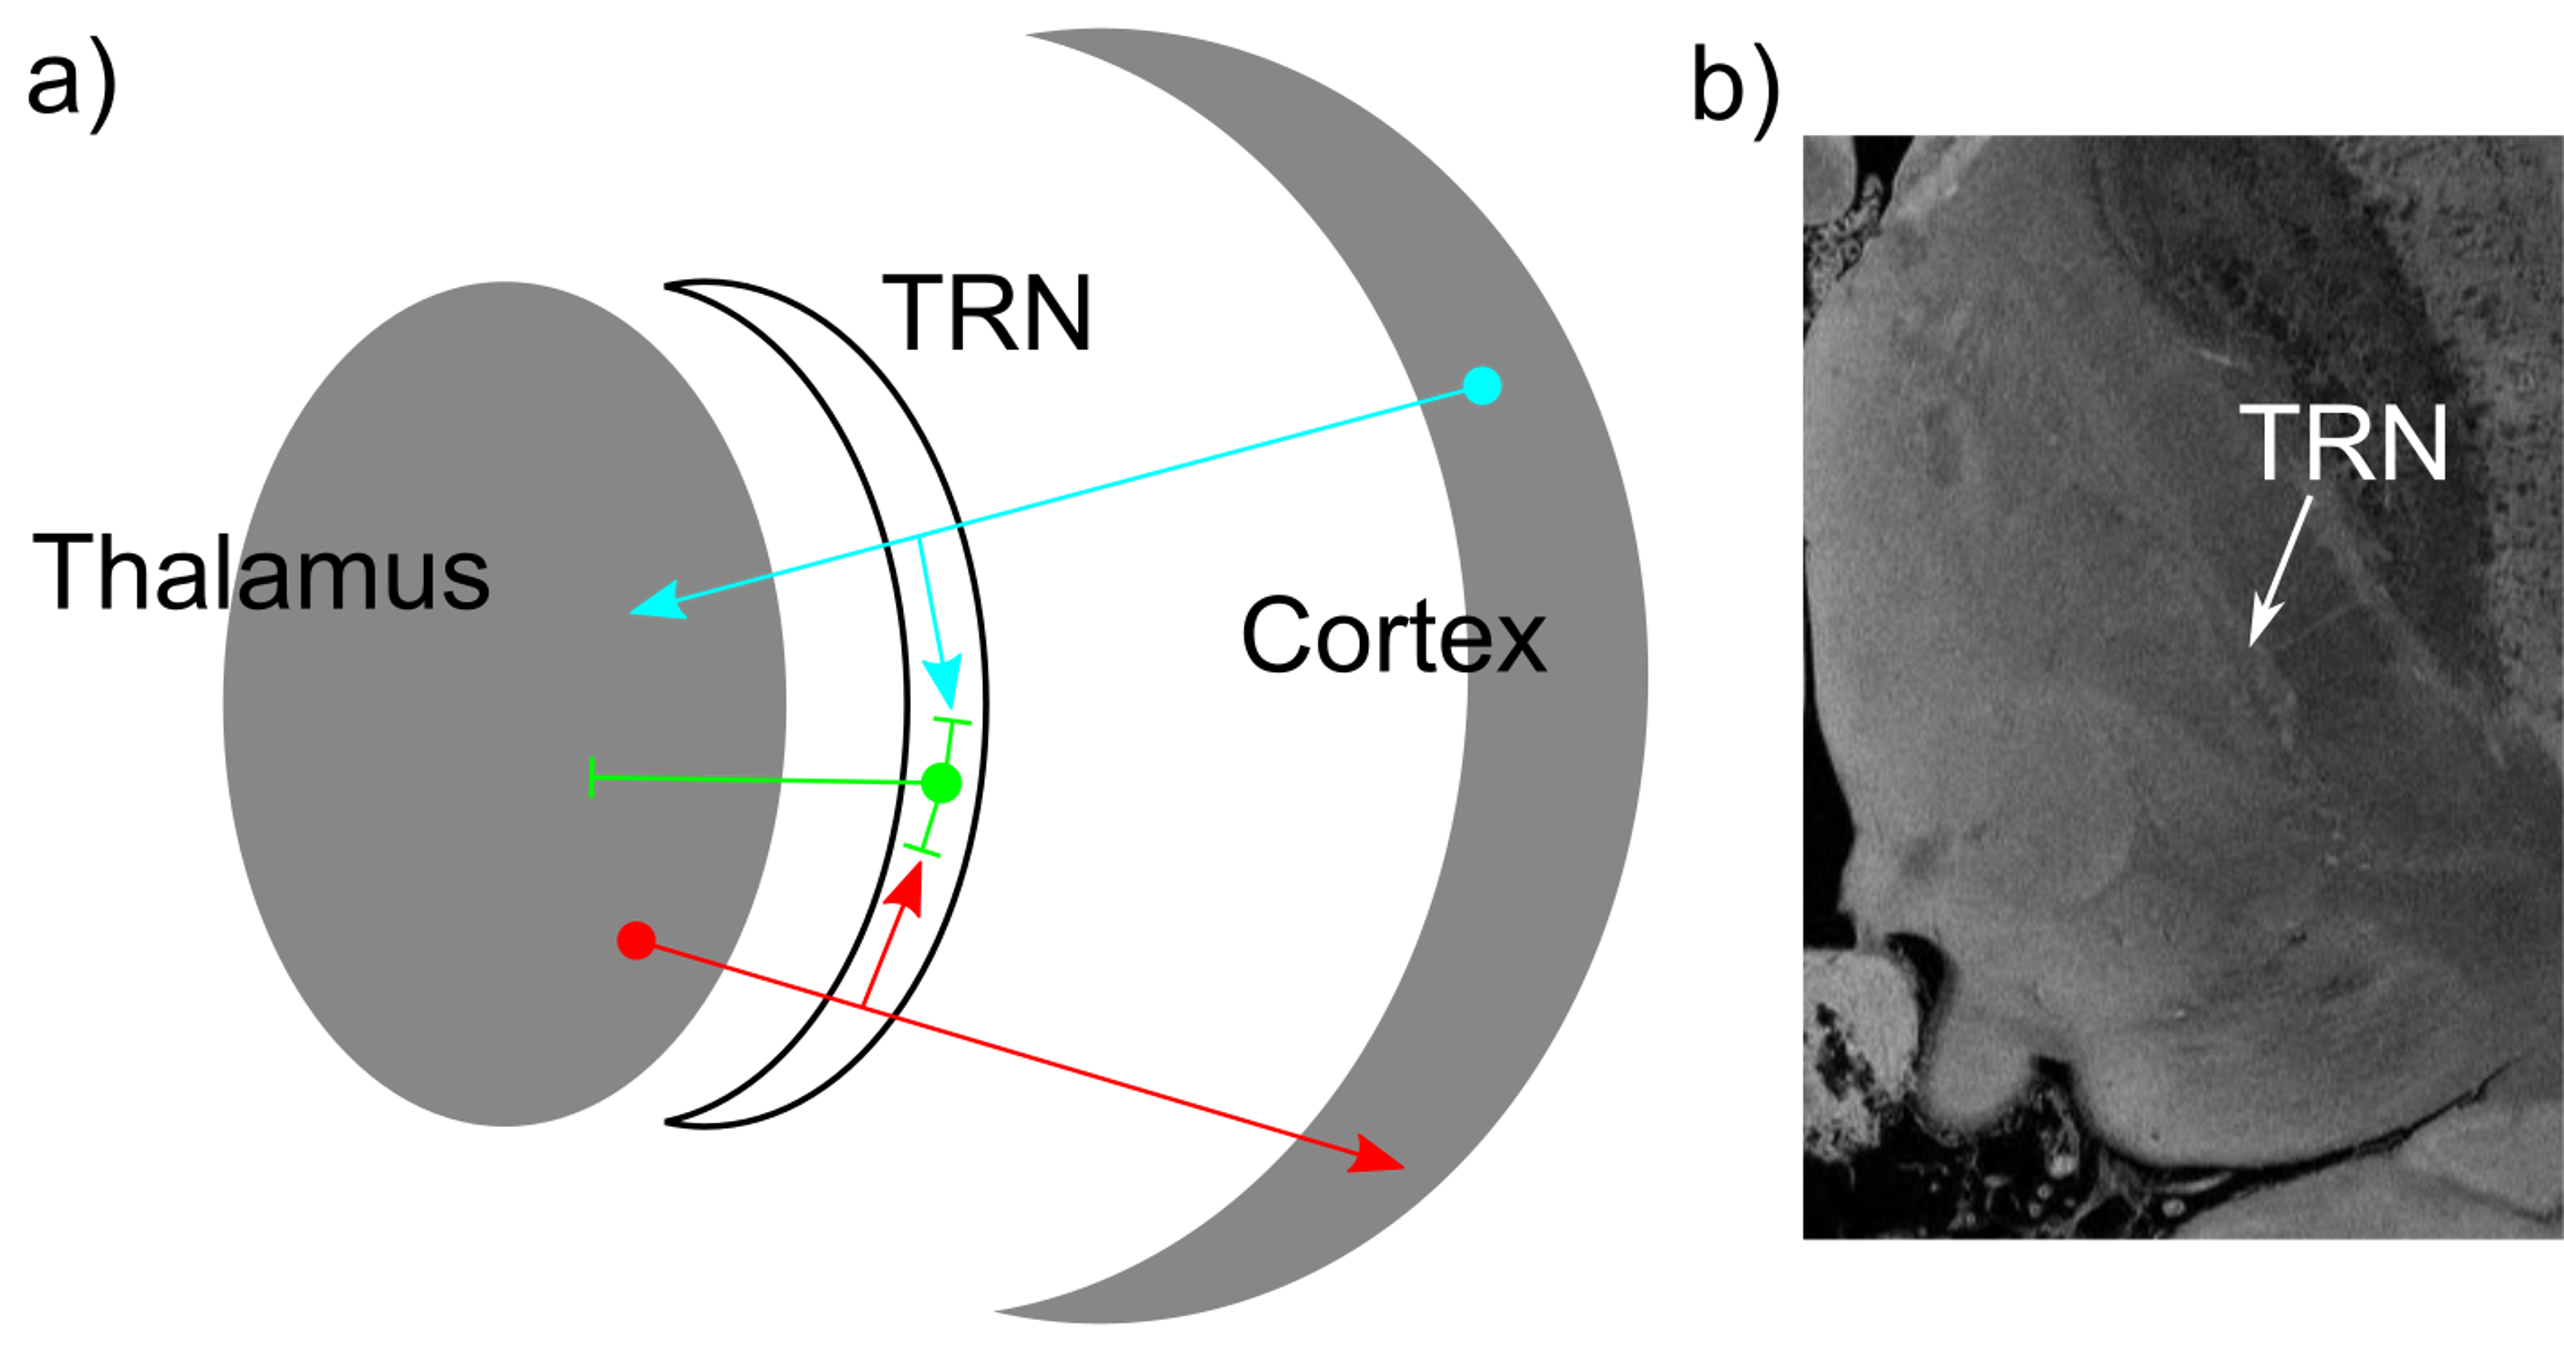
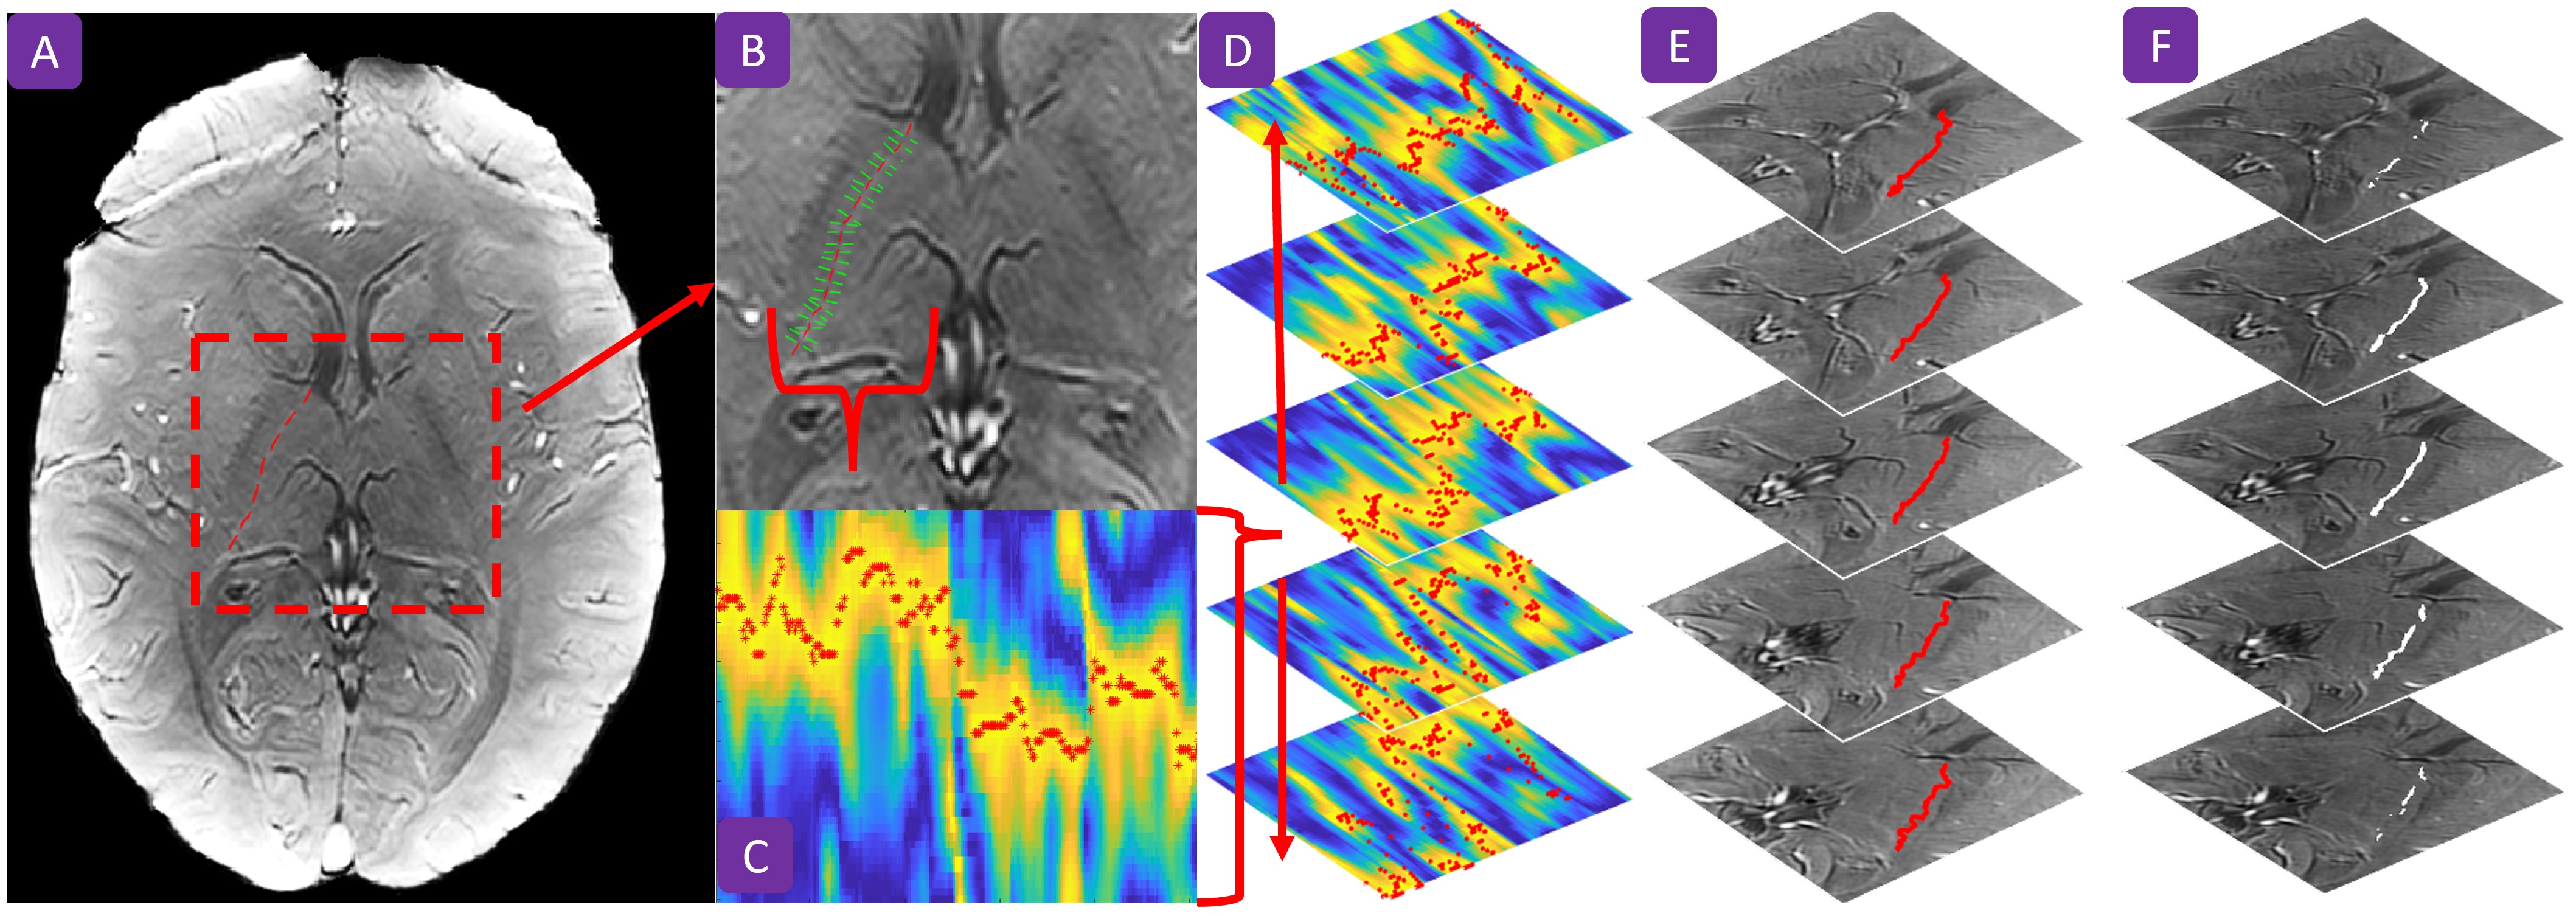
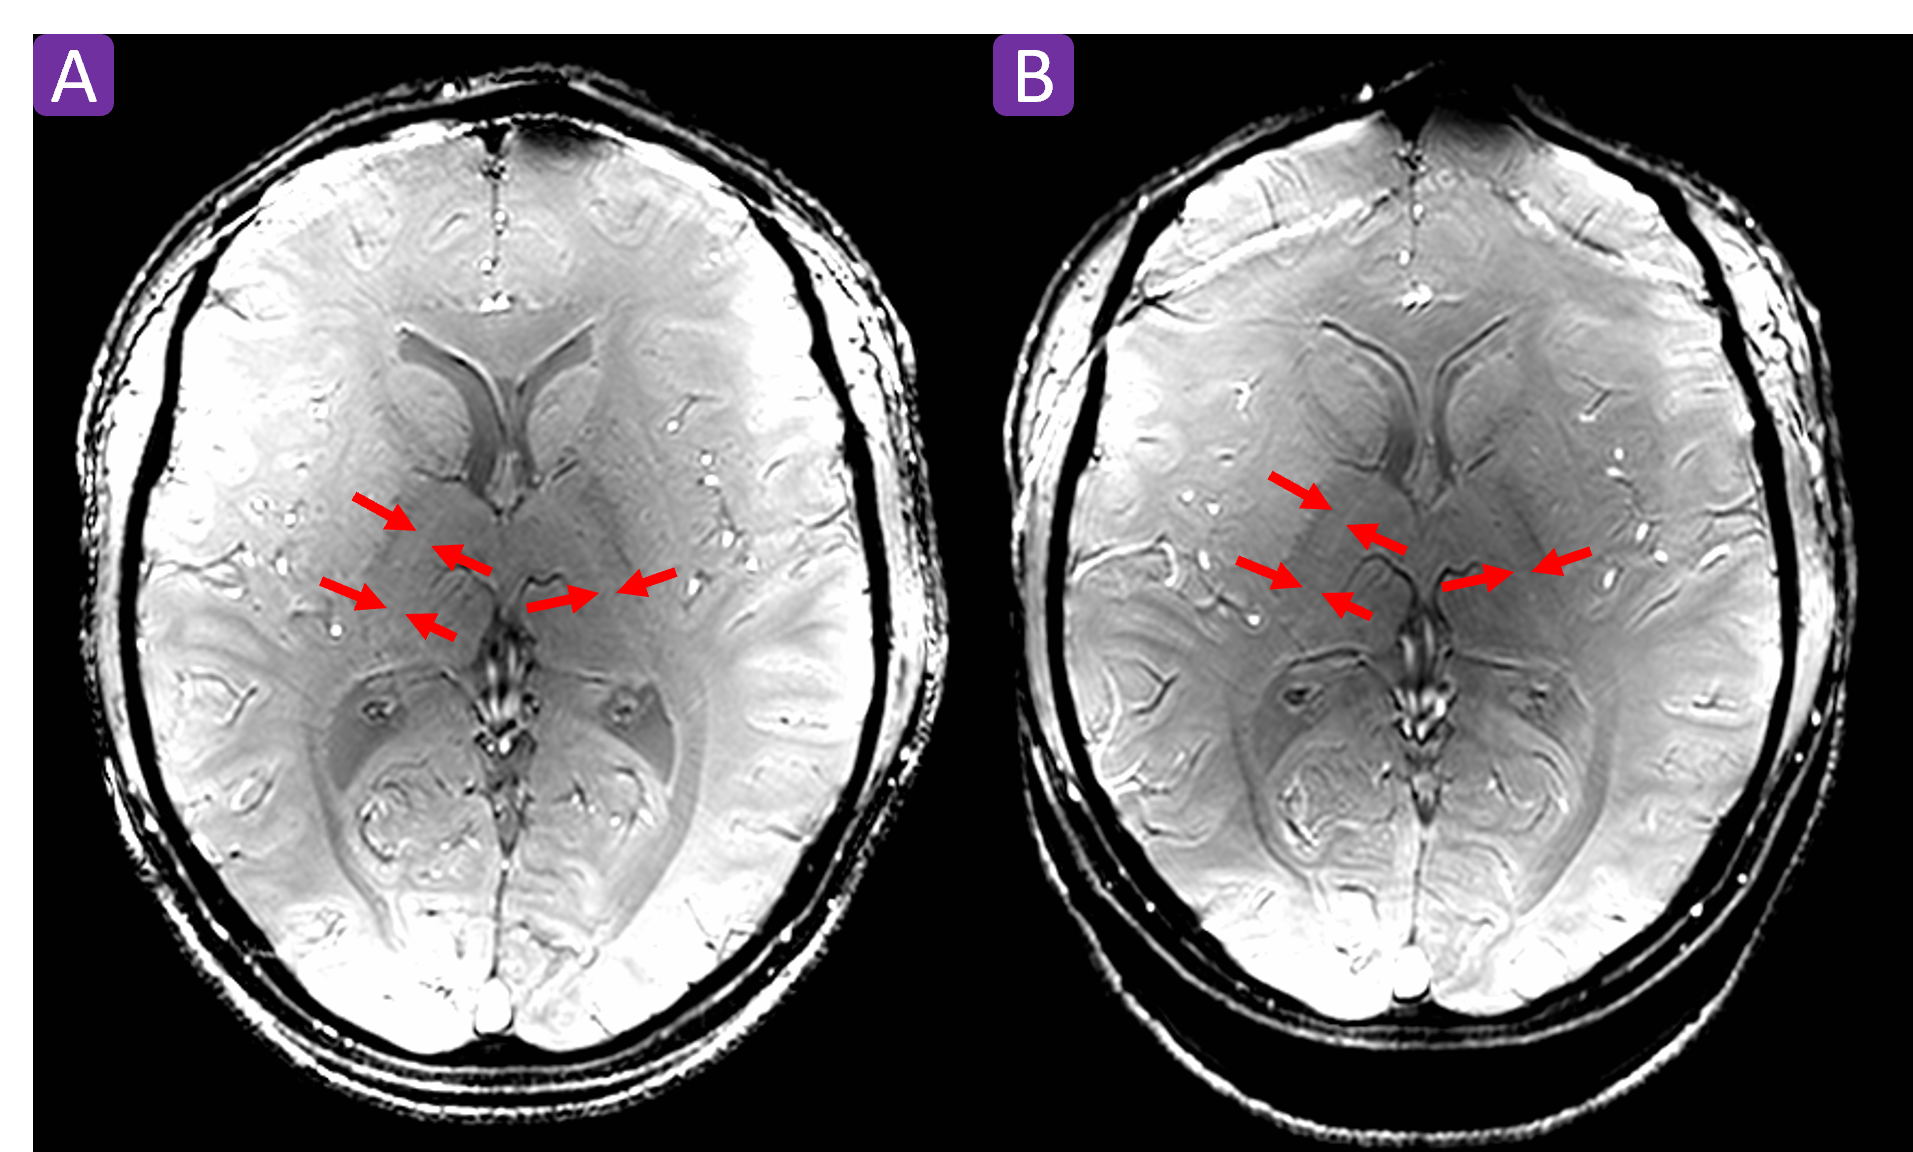
Figure 3: (a) Single slice of MS FLASH image with TR = 600ms and α=60° (b) Single slice of 3D FLASH image with TR = 50ms and α=20°. Both images have in-plane resolutions of 0.4mm.
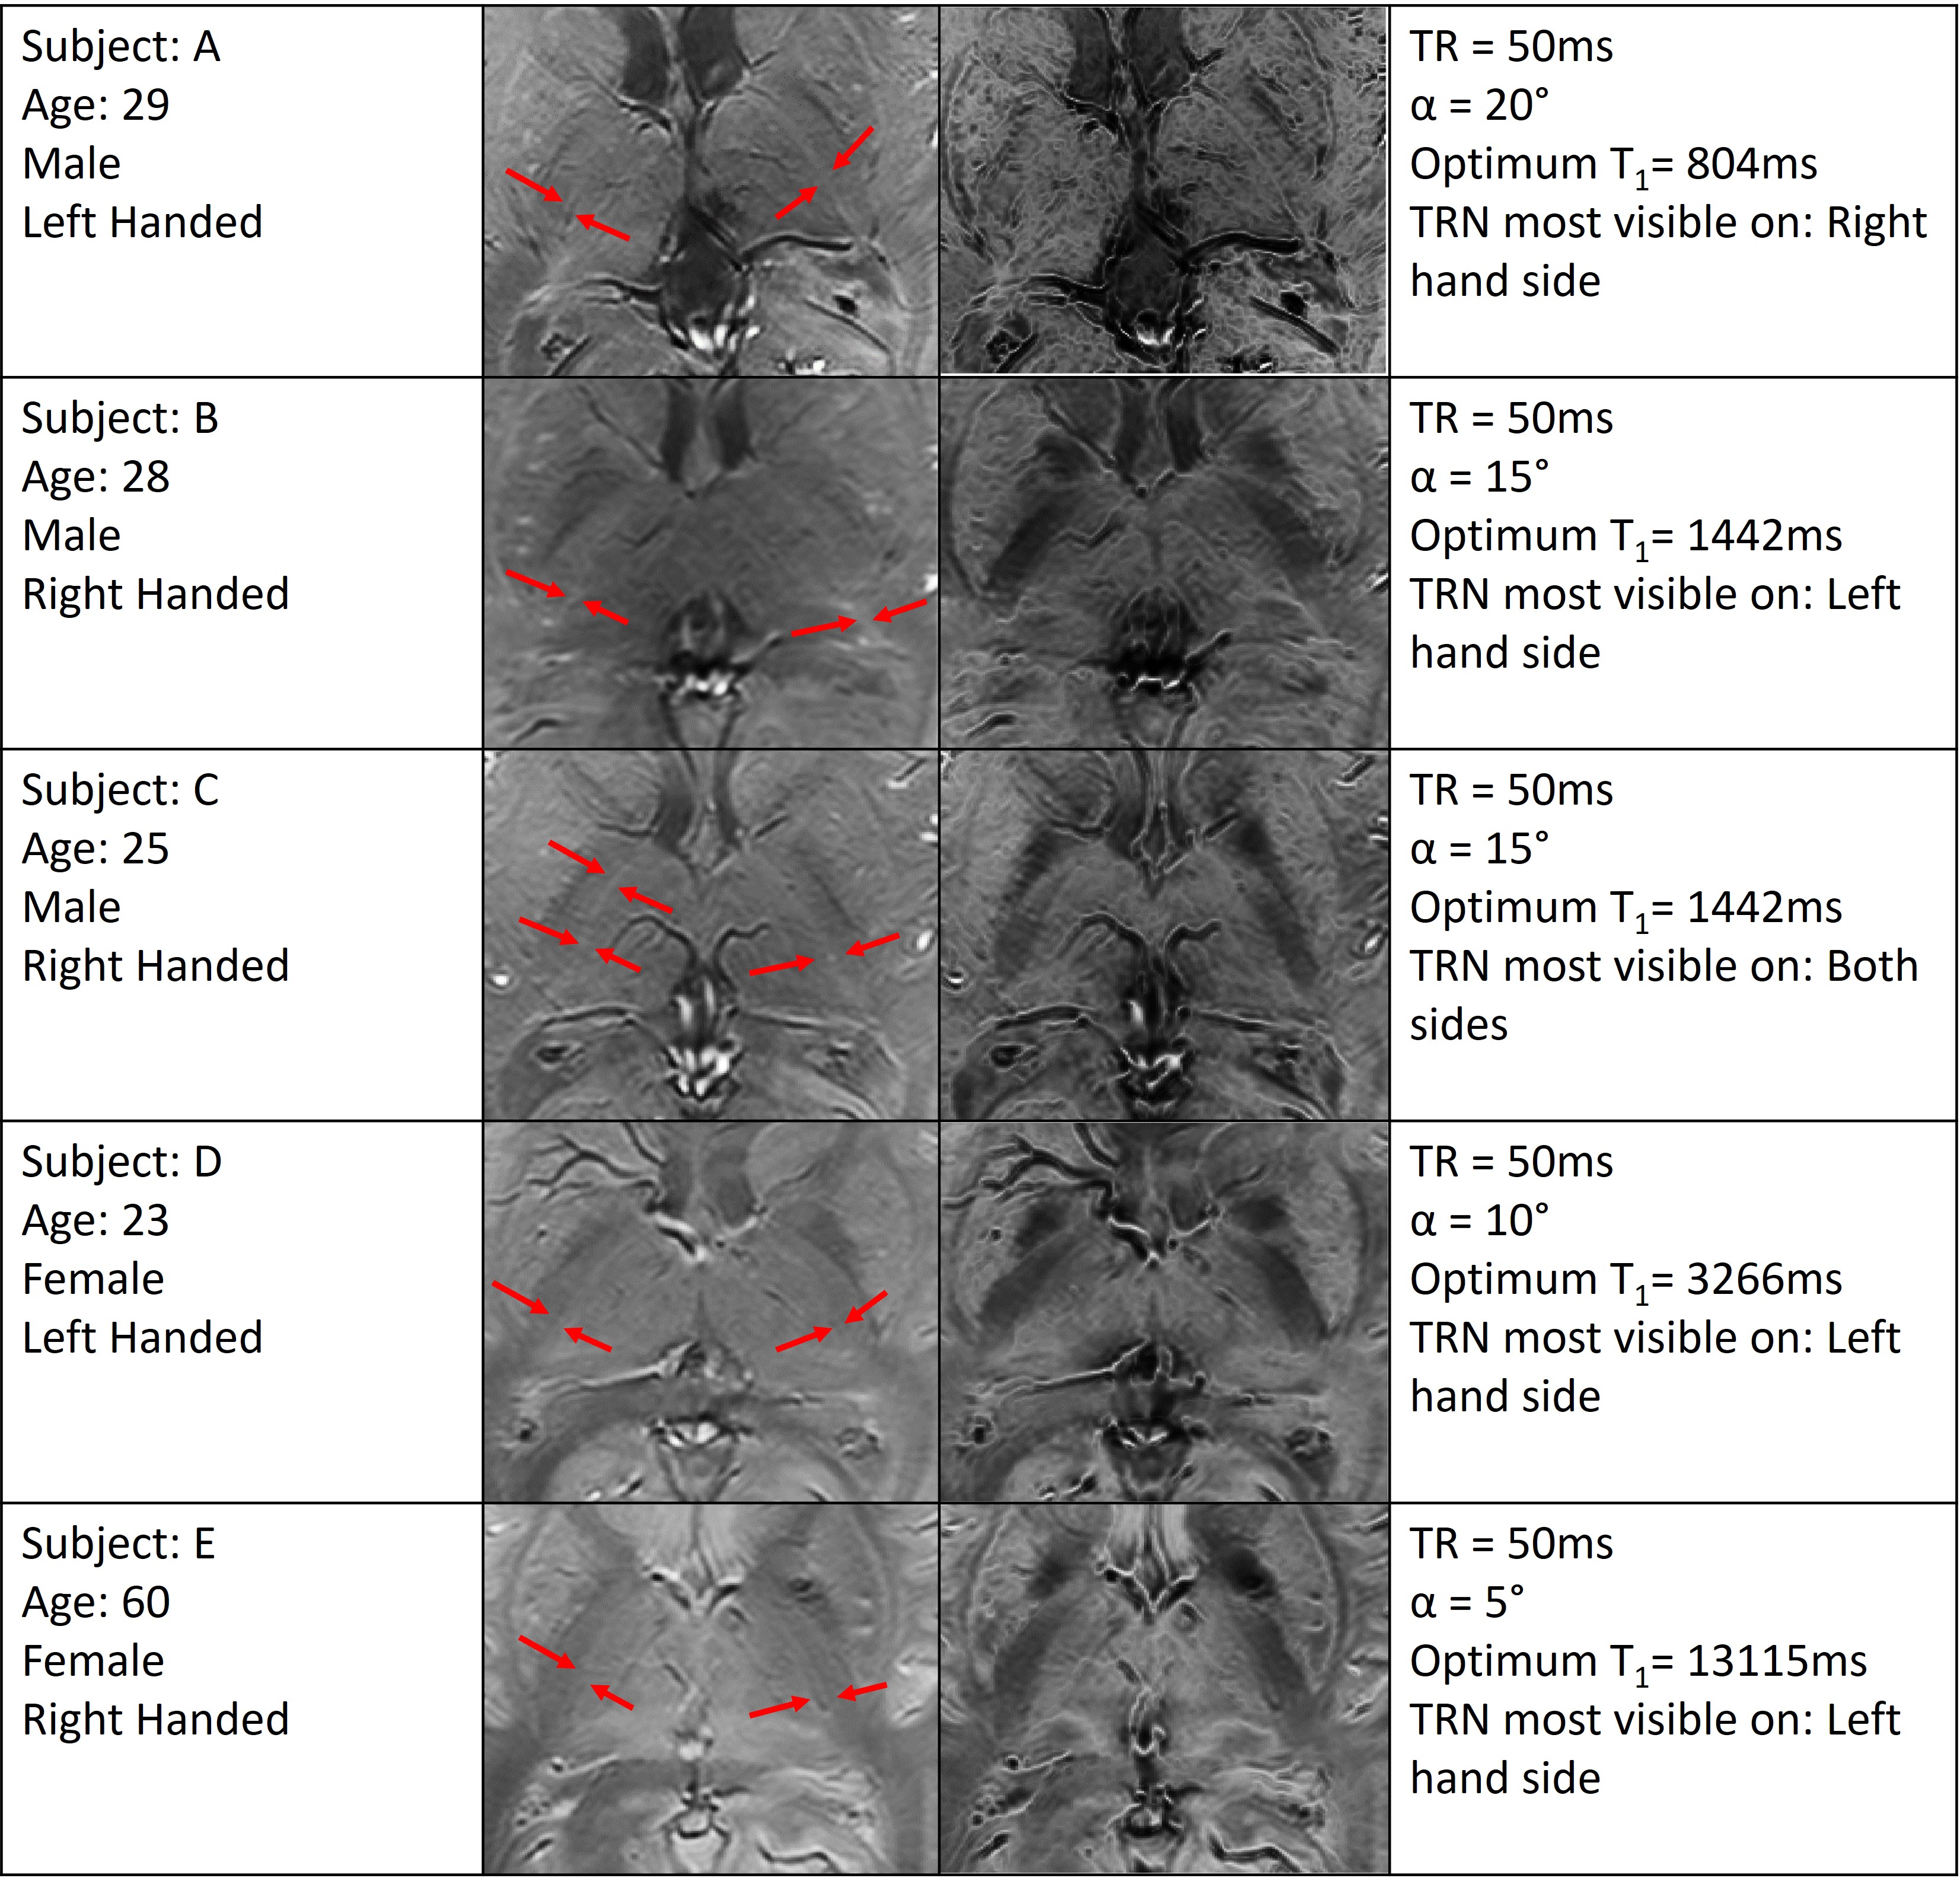
Figure 4: Table of 3D FLASH magnitude and SWI images in column 3 and 4 respectively from 5 participants with participant information in column 1 and scan parameters in column 4. The images have an in-plane resolution of 0.4mm.