4220
Altered dynamic functional connectivity and flexibility in type 2 diabetes patients without cognitive decline.1Department of Magnetic Resonance, Lanzhou University Second Hospital, Lanzhou, China
Synopsis
Keywords: Other Neurodegeneration, Diabetes
Motivation: The dynamic interaction of time changes in the brain to explore the role of T2DM in brain damage and cognitive decline.
Goal(s): To investigate how the dynamic network reconfiguration in T2DM patients and the effect of abnormal blood glucose on the internal network of the brain.
Approach: Dynamic functional connectivity analyses and multi-layer network analysis were performed to evaluate the nodal flexibility, network stability and temporal variability of network efficiency.
Results: The capability to communicate within or between functional networks connectivity and flexibility are impaired in T2DM and linked to blood glucose levels.
Impact: This study is the first to investigate brain injury in T2DM patients by integrating dynamic connectivity and topological features. Dynamic functional connectivity could be a useful imaging biomarker to monitor cognitive changes in T2DM in the future.
Introduction
Type 2 diabetes mellitus (T2DM) functional brain network and topologies are altered during resting state. Prior studies treated the brain as a static structure and ignored its dynamic interactions with moment-to-moment variations1,2. Moreover, the effect of abnormal blood glucose on the internal network of the brain is still unknown. Here, dynamic functional connectivity (dFC) analyses and multi-layer network analysis were performed to compared the flexibility, stability, and topological properties of brain to determine how the dynamic reconfiguration of the network differs between T2DM patients with normal cognitive and healthy controls (HCs).Method
Data acquisition:40 patients with T2DM and 40 age- and gender- matched HCs were studied on a 3T MRI system (Siemens Verio, Erlangen, Germany), using the EPI sequence (TR/TE =2000/30ms) and the 3D high-resolution MPRAGE sequence (TR/TE =1900 / 2.79 ms). Data preprocessing was performed using the fMRI Prep pipeline (version 1.4.0)3. Prior to the MRI scan, all patients had cognitive evaluations and laboratory testing.dFC and network stability: The segregated network components in the resting state of the brain were extracted using group independent component analysis (gICA)4.42 ICs were identified as nodes of the brain network and divided into eight networks, Pearson correlation coefficients between each node were calculated. dFC was estimated using a sliding-window method, with the optimum window-size computed through empirical mode decomposition method. Computed the correlation matrix between different networks, and k-means clustering was further carried out to compute dFC states5.
Nodal flexibility: A Modularity index Q is calculated for each node (IC) to track network reconfiguration over time 6. Node flexibility is defined by the number of network switches/network layers. The discrepancies in temporal proprieties and flexibility were evaluated and associated with the clinical indicators following clustering analysis.
Temporal variability of network efficiency: GRETNA toolbox was used to assess the global efficiency (Eg), local efficiency (Eloc) and each nodal efficiency7. Calculated the coefficient of variation (CV) of AUC to characterize the temporal variability of transmitted information8.
Results
dFC and network stability: State 1 is marked by positively local connection across fundamental perceptional domains (VSN, SMN) as well as higher cognitive control domains (DMN). State 2 denotes highly sparse functional connection both within and across all networks (accounted for 82%). For state 2, we found that group difference in DMN and VSN (Fig. 1). For stability analysis, no group difference was found in state 1. For state 2, we discovered 32 stronger network connections survived with FDR correction. Compared with HCs, the highly variable edge focused on the connections related to VSN, and also focused on the intra connection of DMN.Temporal state properties: The T2DM group had a substantially shorter mean dwell time (MDT) in state 1 (P(FDR) = 0.0101), while there was a longer MDT in state 2 in the HCs group (P(FDR) = 0.0216). T2DM switched between brain states less frequently than HCs (P = 0.1712). The fractional windows of state 1 and state 2 have significant group differences (P(FDR)= 0.0144) (Fig. 2).
Nodal flexibility and temporal variability of network efficiency: Radar chart of ICN flexibility values were shown in Fig. 3A. For each brain node, the increased network flexibility is located in VSN and DMN, while nodes with reduced flexibility are mainly located in DMN (Fig. 3B). There is a difference in AUC between the two groups in state 2 (Fig. 4A). For the temporal stability of nodal efficiency, decreased values with FDR correction were noted in IC43, IC47, IC67 and IC70 (Fig. 4B). The correlation analysis discovered that the stability of IC76 (right Angular) with IC90 (Frontal_Mid_R) have a positive correlation with HbA1c (P(FDR)= 0.006, Fig. 5A). And left hippocampal flexibility have a positive correlation with fasting blood glucose (P(FDR)= 0.037, Fig. 5B).
Discussion
DMN, SMN, and VSN are related to advanced cognitive functions, sensory perception, motor processes and visual space9,10. The left hippocampus is responsible for spatial navigation11.The decreased Eloc may damage the connections with linked regions, while decreased temporal variability of Eg may impair the ability to combine specialized information from distributed brain regions12,13. These results suggest that T2DM may impair brain regions associated with memory.Conclusion
We showed that: 1) The unique brain connectivity patterns of T2DM can be captured based on dFC and reflect its potential pathophysiological mechanisms. 2) The kinetic loss of topological characteristics in hippocampus was also linked to blood glucose levels. dFC could be a useful imaging biomarker to monitor cognitive changes in T2DM in the future.Acknowledgements
JQ.J. thanks J.Z. for guidance and advice during the writing process of the article. The authors are grateful to K.A. of Philips Healthcare China for their help with the MRI technique used in this article.References
1.Liu L, Li W, Zhang Y, et al. Weaker Functional Connectivity Strength in Patients with Type 2 Diabetes Mellitus. Front Neurosci. 2017;11:390.
2. Chen YC, Jiao Y, Cui Y, et al. Aberrant brain functional connectivity related to insulin resistance in type 2 diabetes: a resting-state fMRI study. Diabetes Care. 2014;37(6):1689-1696.
3. Esteban O, Markiewicz CJ, Blair RW, et al. fMRIPrep: a robust preprocessing pipeline for functional MRI. Nat Methods. 2019;16(1):111-116.
4. Butt MF, Albusoda A, Farmer AD, et al. The anatomical basis for transcutaneous auricular vagus nerve stimulation. J Anat. 2020;236(4):588-611.
5. Chen H, Nomi JS, Uddin LQ, et al. Intrinsic functional connectivity variance and state-specific under-connectivity in autism. Hum Brain Mapp. 2017;38(11):5740-5755.
6. Pedersen M, Zalesky A, Omidvarnia A, et al. Multilayer network switching rate predicts brain performance. Proc Natl Acad Sci U S A. 2018;115(52):13376-13381.
7. Yang S, Hua P, Shang X, et al. Deficiency of brain structural sub-network underlying post-ischaemic stroke apathy. Eur J Neurol. 2015;22(2):341-347.
8. Luo L, Li Q, You W, et al. Altered brain functional network dynamics in obsessive-compulsive disorder. Hum Brain Mapp. 2021;42(7):2061-2076.
9. Xia W, Wang S, Rao H, et al. Disrupted resting-state attentional networks in T2DM patients. Sci Rep. 2015;5:11148.
10. Liu F, Wang Y, Li M, et al. Dynamic functional network connectivity in idiopathic generalized epilepsy with generalized tonic-clonic seizure. Hum Brain Mapp. 2017;38(2):957-973.
11. Anand KS, Dhikav V. Hippocampus in health and disease: An overview. Ann Indian Acad Neurol. 2012;15(4):239-246.
12. Li Z, Chen R, Guan M, et al. Disrupted brain network topology in chronic insomnia disorder: A resting-state fMRI study. Neuroimage Clin. 2018;18:178-185.
13. Li Y, Liang Y, Tan X, et al. Altered Functional Hubs and Connectivity in Type 2 Diabetes Mellitus Without Mild Cognitive Impairment. Front Neurol. 2020;11:1016.
Figures
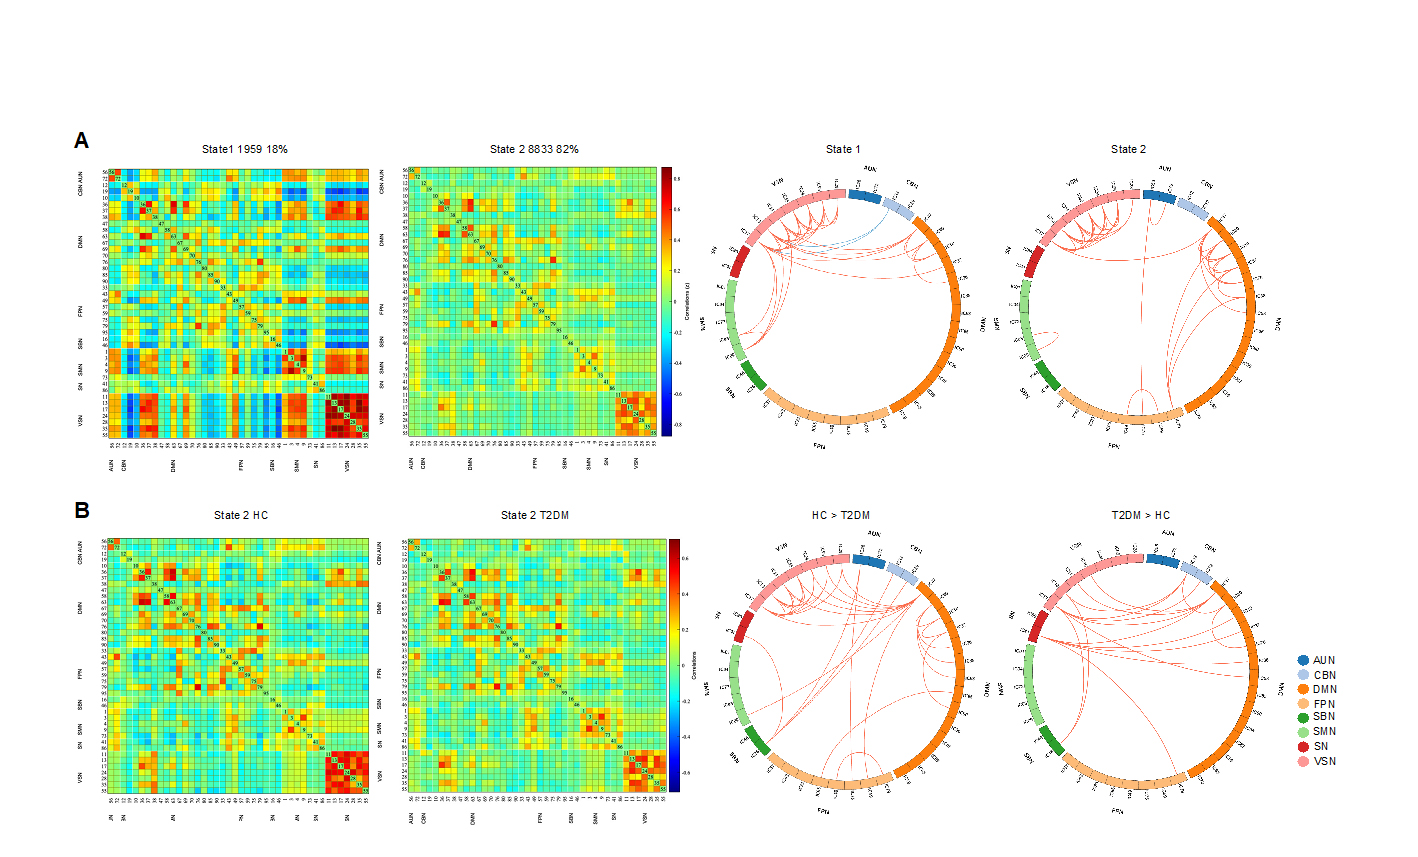
Figure 1
Clustering analysis, group difference results. (A) State 1, less frequent but with stronger inter-connection; state 2, more frequent with relatively sparse connection. Red lines of represent positive functional connectivity, while blue lines represent negative connections. (B) Differences in dynamic functional network connectivity (dFC) between groups with T2DM and HCs. Here only State 2 are shown because significant differences between groups in dFC were observed only in this state.
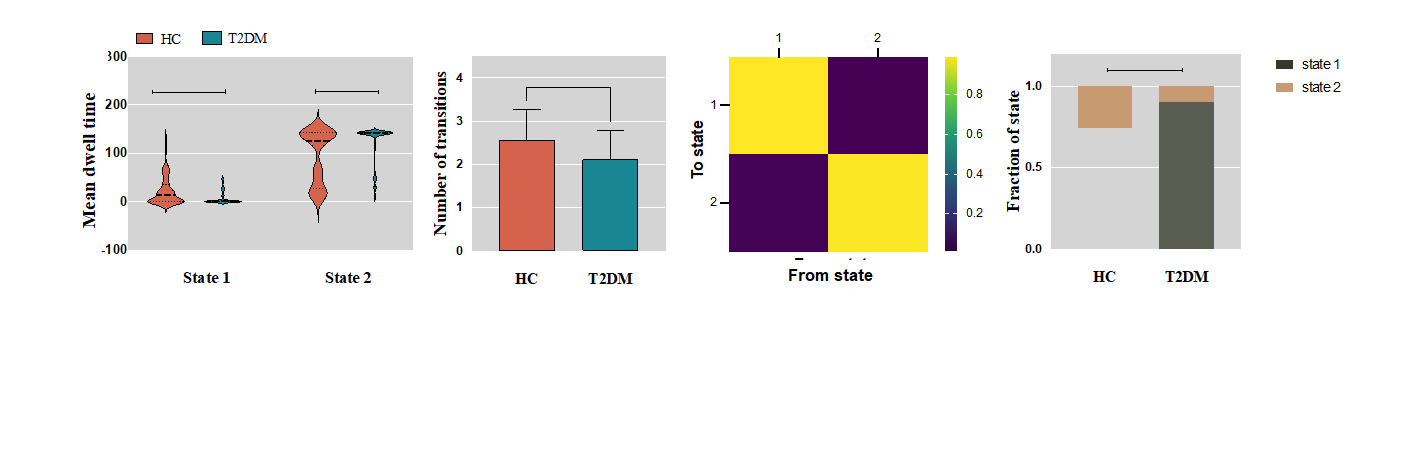
Figure 2
Differences in temporal properties: Analysis results of temporal properties. Mean dwell time (state 1, P = 0.0101, for state 2, P = 0.0216, FDR correction); Transition matrix between groups; Number of transitions (P = 0.1712) and Fractional windows (P = 0.0144, FDR correction). Asterisks indicate a significant group difference (*P < 0.05). The error bars represented SD.
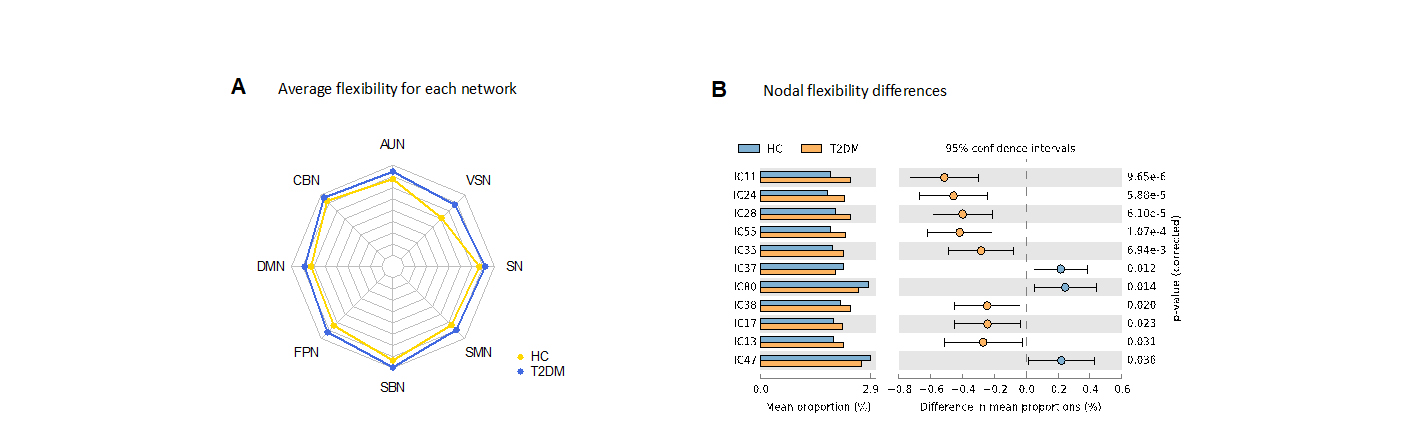
Figure 3
(A) Comparison of average flexibility of each sub-network. (B) Nodal flexibility differences
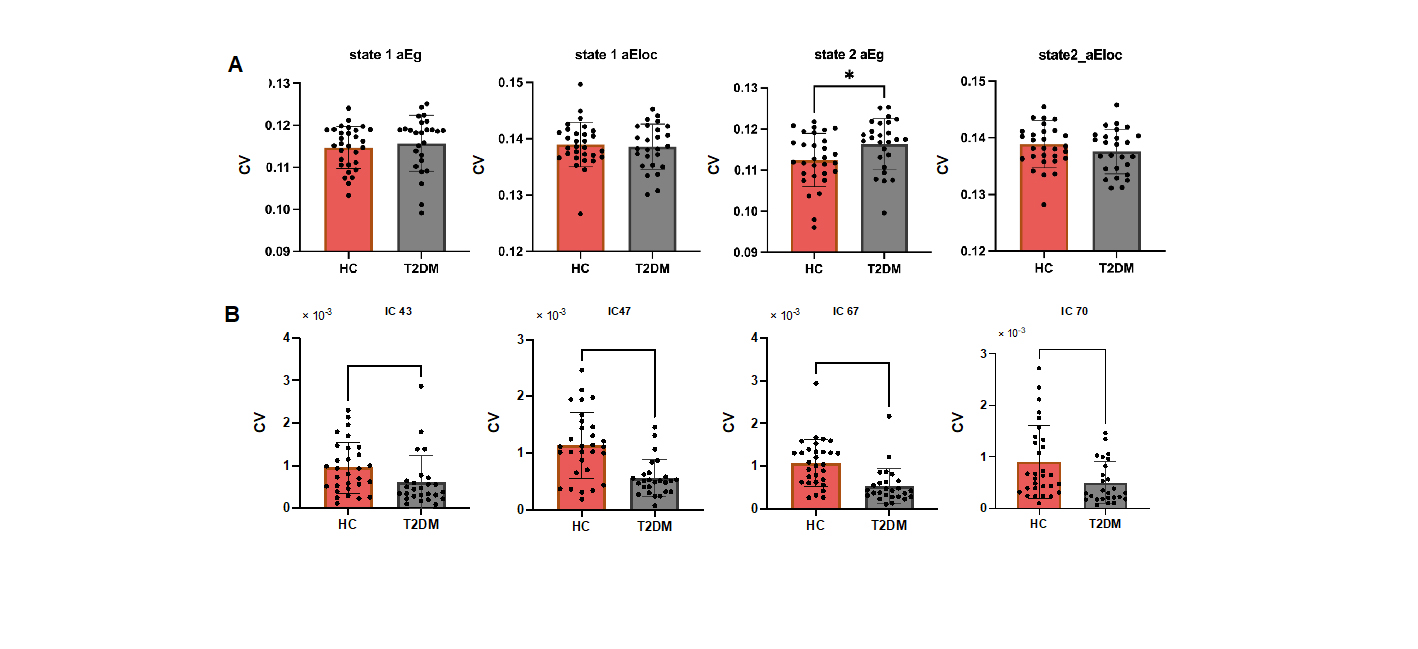
Figure 4
(A) Scatter plots showing associations between time properties and variance strength of median network (adjusted for age, sex, and education) and HbA1c in patients with T2DM. It depicts that the dynamics of functional connections between IC76 and IC30 variance have positive correlation with HbA1c (r = 0.448 and P = 0.006). (B) shows the correlation between nadoal flexibility of left hippocampus and Fasting blood glucose (r = 0.349 and P = 0.037).

Figure 5
(A) Temporal variability result diagram of network properties. The variance calculated by AUC of global efficiency (aEg) and AUC of local efficiency (aEloc) in different states are represented via histogram plots. And the variance of noadl efficiency in state 2 which are significant are shown in histogram plots. (B) All asterisks indicate a significant group difference (* P < 0.05, ** P < 0.01, *** P < 0.001, **** P < 0.0001, Mann- Whitney U-test, FDR correction). The error bars represented SD.