4219
The exploration of establishing the IVIM-based Virtual Elastography conversion formula in Brain1Department of Radiology, The First Affiliated Hospital of Xi'an Jiaotong University, Xi'an, China, 2Shaanxi Engineering Research Center of Computational Imaging and Medical Intelligence, Xi'an, China, 3Philips Healthcare, Xi'an, China
Synopsis
Keywords: White Matter, Elastography, IVIM,virtual-MRE,brain,Elastography
Motivation: The IVIM-based Virtual Elastography conversion formula based on liver data has been established and verified, but there are no studies using brain MRE data and IVIM data to explore the correlation between the two and establish the relevant conversion formula.
Goal(s): This study aims to validate the relationship between shear stiffness and sADC under different combinations of b-values and derive a conversion formula for vMRE in the brain.
Approach: IVIM and MRE data were collected and quantified in healthy adults.
Results: The correlation between sADC and shear stiffness has been confirmed, and the conversion formula of each brain region has been preliminarily established.
Impact: In this study, the feasibility of brain vMRE was verified for the first time based on brain MRE and IVIM data, and the conversion formulas of different brain regions were preliminatively established.
Introduction
Differential forms, content, and microenvironment variances of water molecules not only serve as the basis for generating contrast in IVIM images but also influence the extent of tissue mechanical properties, such as shear modulus[1, 2]. IVIM-based Virtual Elastography(vMRE) calculates shifted ADC (sADC) by combining the ratio of high b-values to low b-values and employs a linear conversion formula to derive virtual elasticity values, representing shear stiffness[3, 4]. This approach has been validated in liver research[5]. So far, no vMRE conversion formula for brain tissue based on brain MRE and IVIM data has been proposed. Therefore, this study aims to investigated the relationship between shear stiffness and sADC under different combinations of b-values and derive a conversion formula for vMRE in the brain[6].Method
A total of 13 healthy adult volunteers, comprising 7 males and 6 females, with an average age of 22.15±1.54 years were enrolled. All participants underwent MR using a 3.0T scanner (Ingenia CX, Philips, the Netherlands) with 32-channel head coil. MRI data, including structural T1, T2, IVIM, and 3D-MRE, were collected. The relevant parameter of 3D-MRE and IVIM were shown in Figure 1A. The MRE excitation equipment was brought by Resoundant (Mayo Clinic, Rochester, MN, USA). The dedicated sequence and post-processing software were provided by Mayo Clinic and Philips. The obtained shear stiffness map of MRE was rigidly aligned with T1WI. Subsequently, the MNI 1mm T1 image was registered to the individual T1WI to obtain a deformation matrix. Finally, by using the deformation matrix, the atlas was mapped onto individual shear stiffness maps for analysis (Figure 1B). MATLAB based in-house code was used to separate ADC with different b values of IVIM data. Subsequently, FSL was utilized for eddy current correction and skull stripping. Finally, sADC values were generated based on different non-zero b-values using in-house MATLAB code. To ensure sADC and shear stiffness were in the same order of magnitude, sADC values were multiplied by 1,000,000 for analysis. The subsequent data processing and analysis procedures for sADC were similar to those applied to MRE data (Figure 1C) .Segmentation of gray matter and white matter was performed by using SPM12.The yield probability maps were binarized to obtain Global White Matter(GWM) ,Cortical Gray Matter(CGM) mask and Global Brain Tissue (GBT) mask. Subcortical Gary matter ROIs such as Amygdala (AM), Accumbens (AC), Caudate (CA), Pallidum (PA), Putamen (PU), Thalamus (TH), and Hippocampus (HC) were extracted from the HarvardOxford-sub -1mm atlas[7].Result
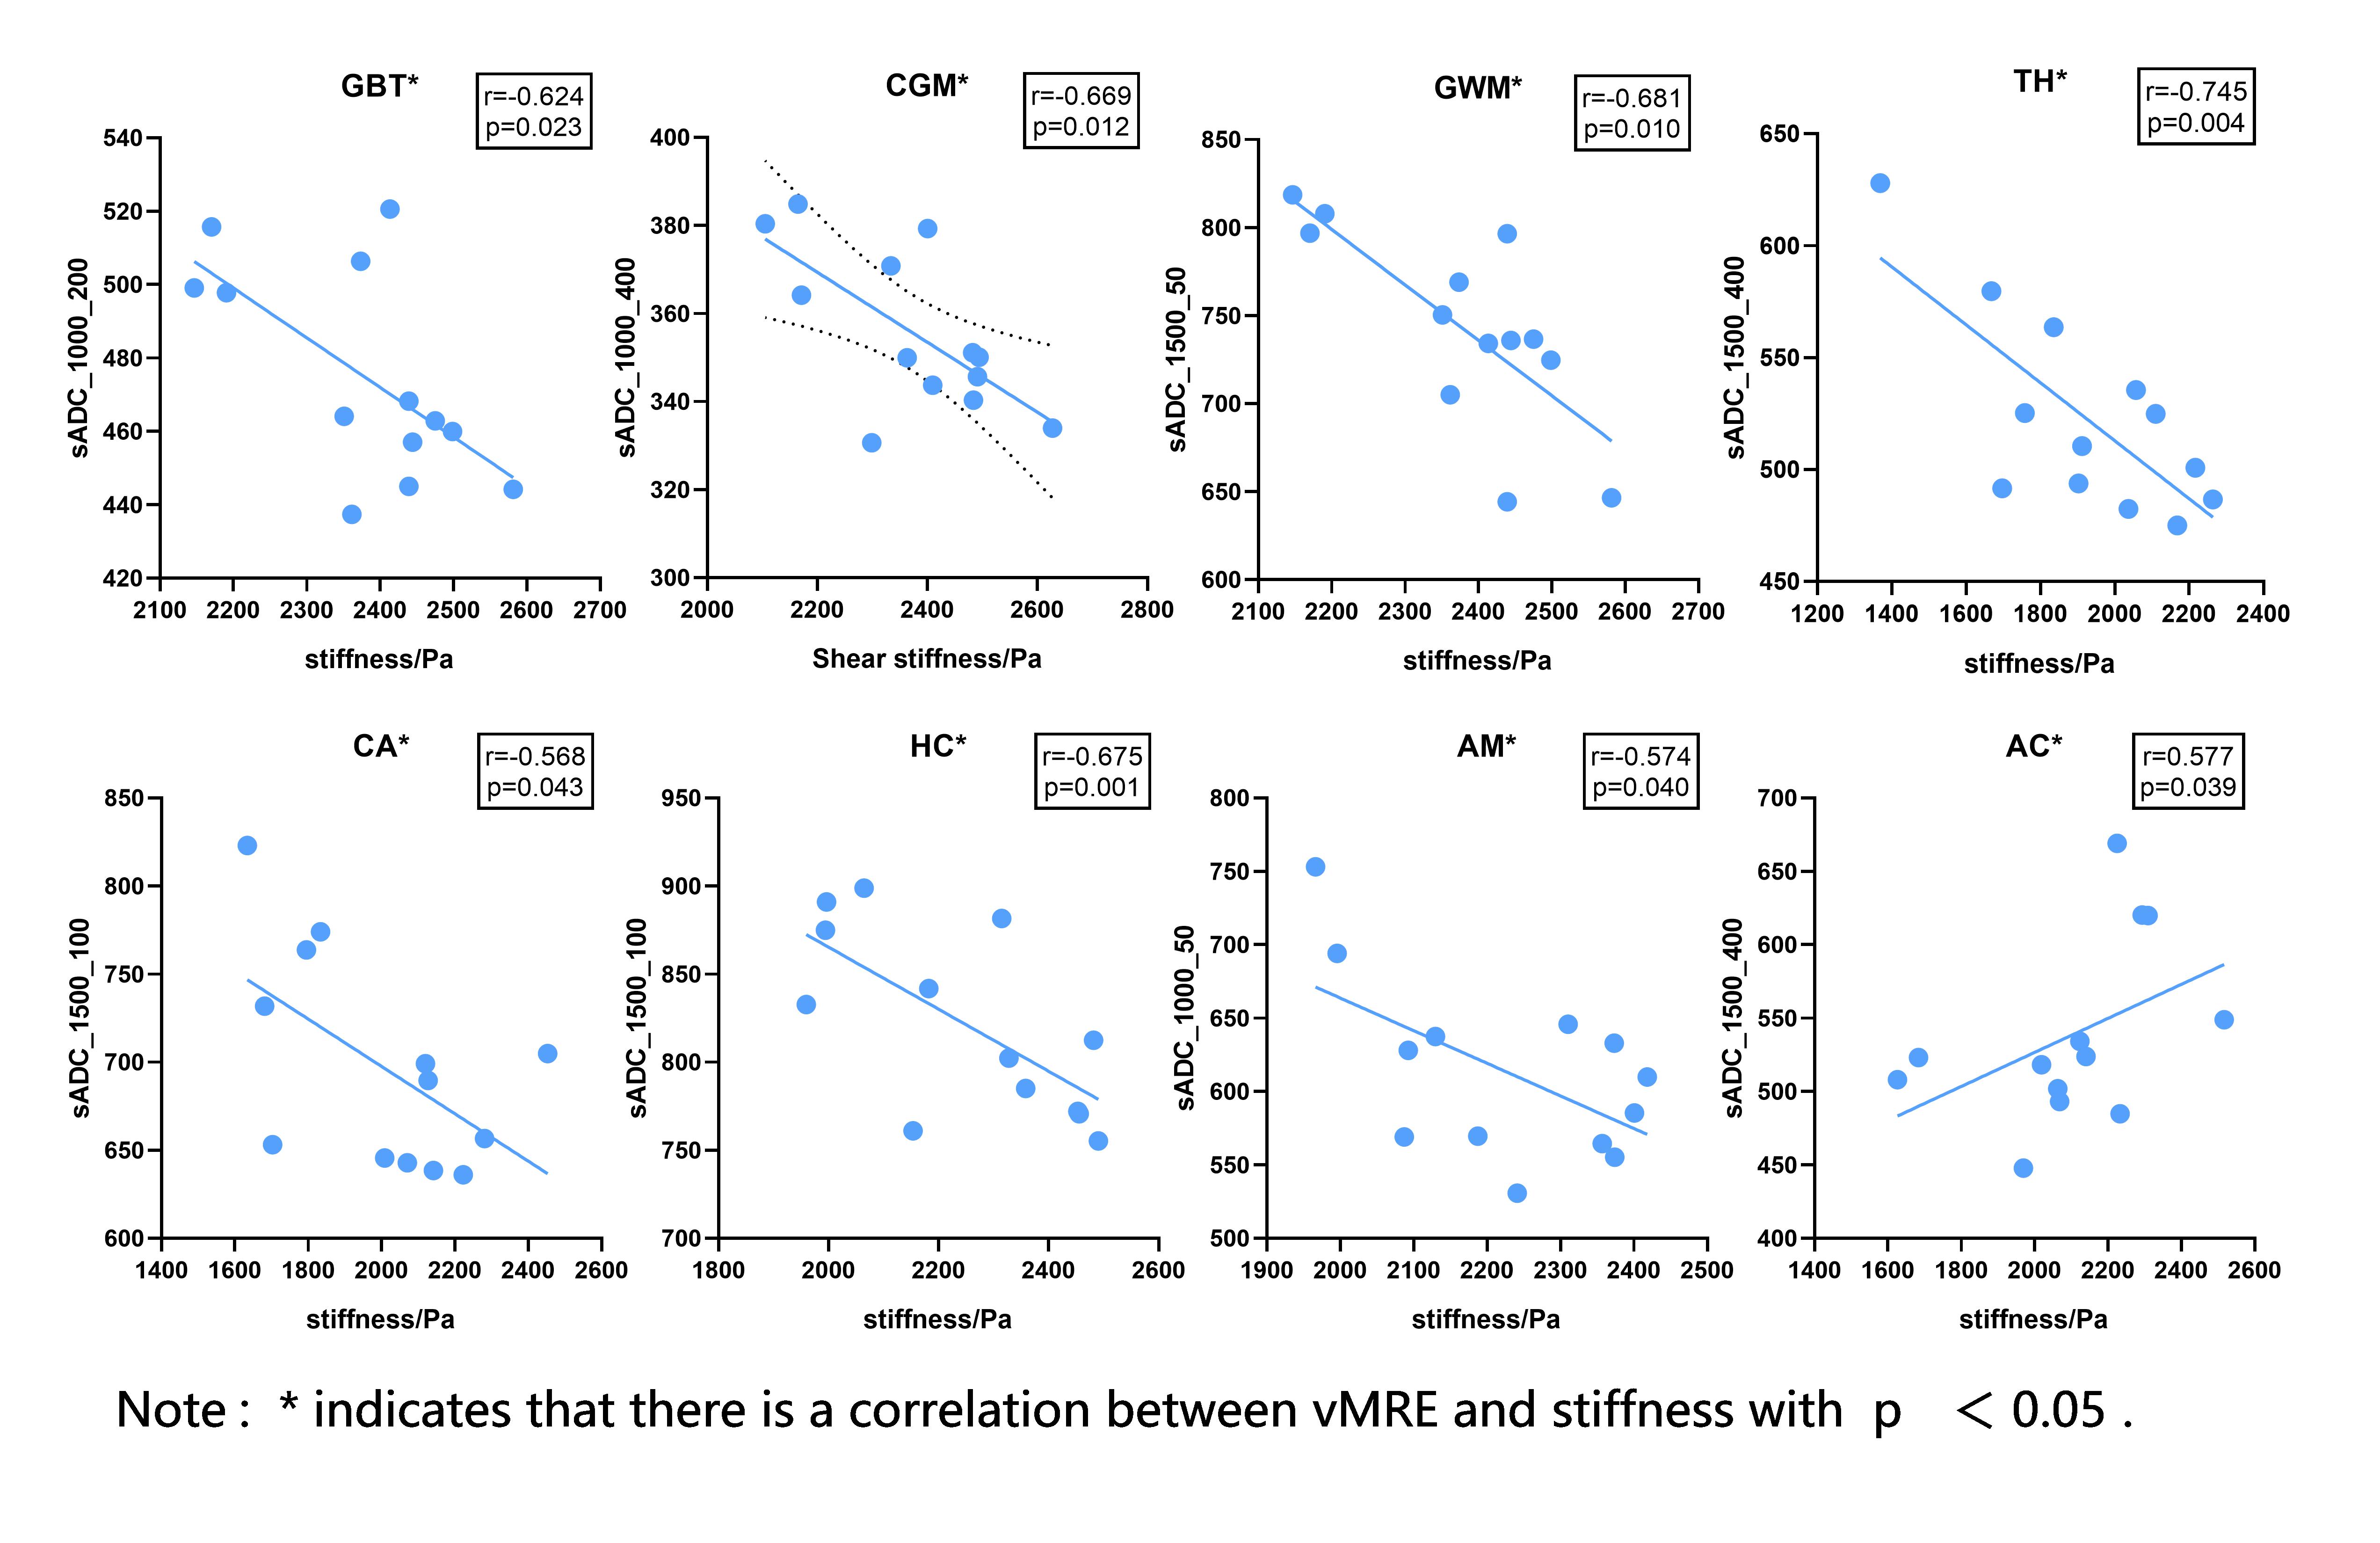
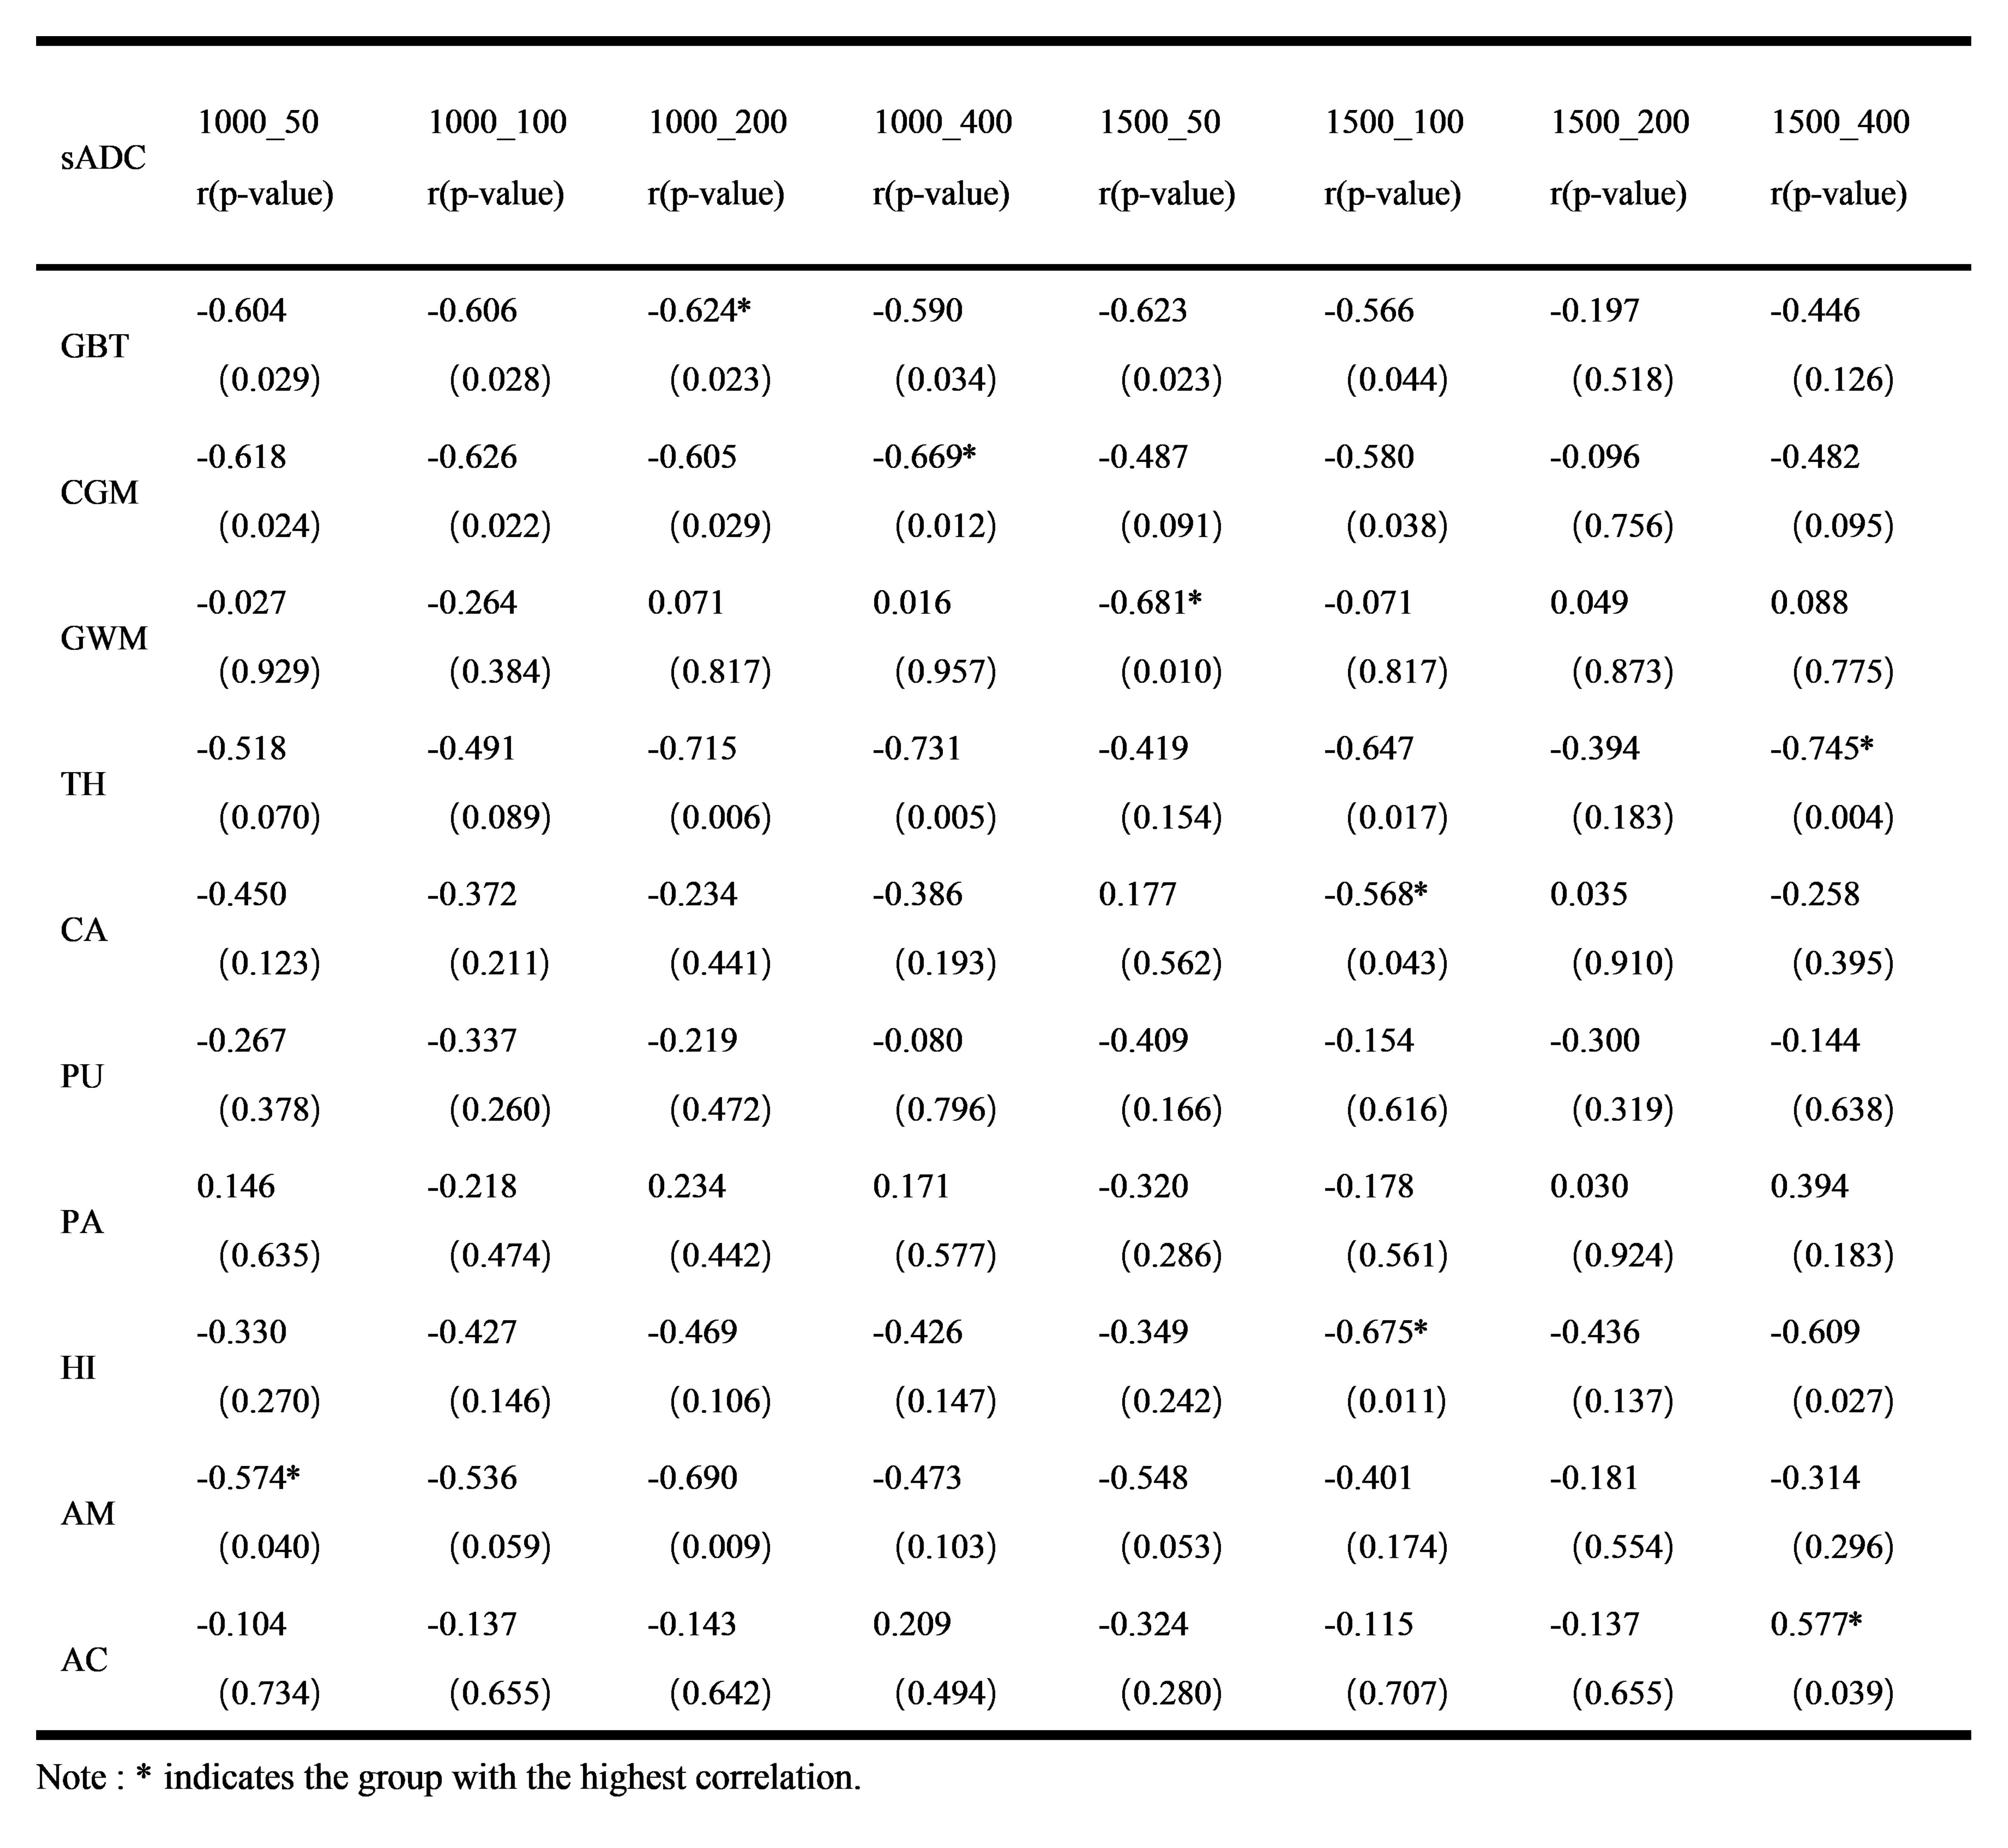
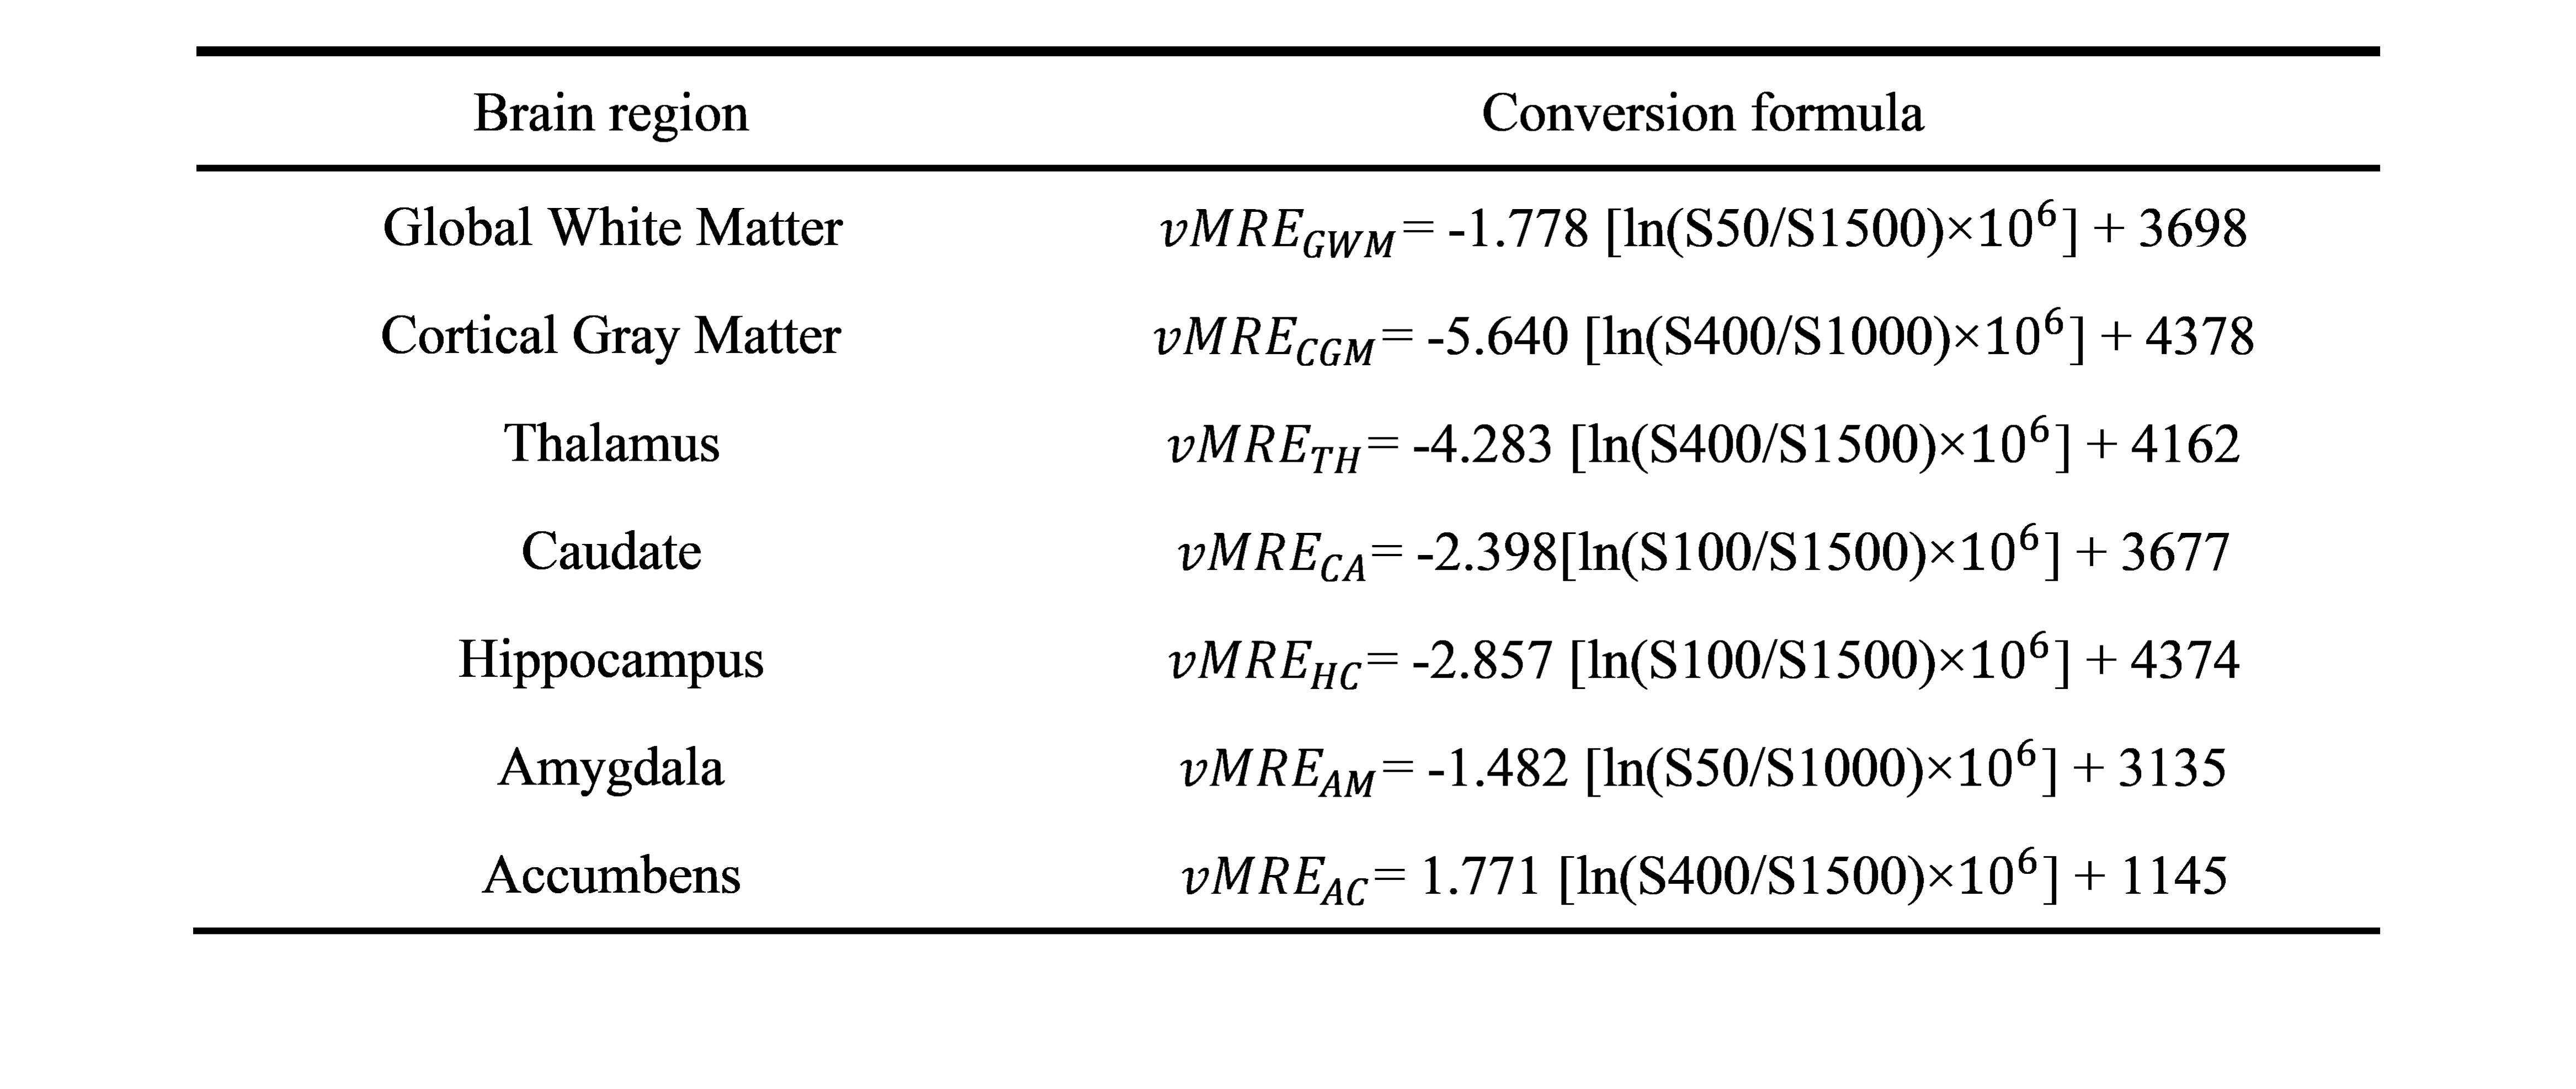
In the section of verification of the correlation between sADC and MRE-measured shear stiffness (Table 1), significant correlation between sADC and shear stiffness were observed in brain regions other than the PA and PU. Figure 2 displayed the plots of sADC and shear stiffness with the highest correlations in different brain regions. The highest correlation in AM (r=-0.574) was observed with sADC1000_50 ; GBT (r=-0.624) showed the highest correlation with sADC1000_200; CGM (r=-0.669,) exhibited the highest correlation with sADC1000_400; GWM (r=-0.681) demonstrated the highest correlation with sADC1500_50; CA (r=-0.568) and HC (r=-0.675) both had the highest correlation with sADC1500_100; TH (r=-0.745) and AC (r=0.577) showed the highest correlation with sADC1500_400. Accordingly, IVIM-based vMRE conversion formula for various brain regions were derived based on linear regression analysis (Table 2).Disscussion
Considering different mechanical properties,the IVIM-based vMRE conversion formula derived from liver data may be not reasonable when it is applied to the brain. The correlation verification between brain vMRE and MRE has not be investigated, along with the proposal of conversion formulas. Unlike the liver tissue, which has a simple cell composition, brain tissues such as white matter, gray matter, and subcortical nuclei, exhibit distinct characteristics in terms of cell composition, cell size, collagen content, and cellular microenvironment[8]. Therefore, it is challenging to represent whole brain regions virtual elasticity imaging with a single formula. Our study, by exploring the correlation between whole-brain shear stiffness and sADC under different combinations of b-values, provides preliminary evidence of the correlation between brain vMRE and MRE, indicating the potential to derive conversion formulas for brain virtual elasticity imaging. Preliminary conversion formulas for different brain structures have been derived. However, several brain regions did not show significant correlations, indicating the need for larger sample sizes and alterations in b-value combinations to explore potential correlations between these factors.Conclusion
There is a correlation between IVIM-derived sADC and MRE-measured shear stiffness in brain. Preliminary conversion formulas for IVIM-based Virtual Elastography conversion formula in various brain regions, different from that in liver, are derived in this work.Acknowledgements
This work was supported by the National Natural Science Foundation of China (81971581, 82272618) . Please address correspondence to Jian Yang, e-mail: yj1118@mail.xjtu.edu.cn, Miaomiao Wang, e-mail:wangmm407@163.com, Xianjun Li, e-mail: xianj.li@mail.xjtu.edu.cn.References
1. Le Bihan D: What can we see with IVIM MRI? Neuroimage 2019, 187:56-67.
2. Hiscox LV, Schwarb H, McGarry MDJ, Johnson CL: Aging brain mechanics: Progress and promise of magnetic resonance elastography. Neuroimage 2021, 232:117889.
3. Le Bihan D, Ichikawa S, Motosugi U: Diffusion and Intravoxel Incoherent Motion MR Imaging-based Virtual Elastography: A Hypothesis-generating Study in the Liver. Radiology 2017, 285(2):609-619.
4. Kopřivová T, Keřkovský M, Jůza T, Vybíhal V, Rohan T, Kozubek M, Dostál M: Possibilities of Using Multi-b-value Diffusion Magnetic Resonance Imaging for Classification of Brain Lesions. Acad Radiol 2023.
5. Kromrey ML, Le Bihan D, Ichikawa S, Motosugi U: Diffusion-weighted MRI-based Virtual Elastography for the Assessment of Liver Fibrosis. Radiology 2020, 295(1):127-135.
6. Murphy MC, Huston J, 3rd, Ehman RL: MR elastography of the brain and its application in neurological diseases. Neuroimage 2019, 187:176-183.
7. Desikan RS, Ségonne F, Fischl B, Quinn BT, Dickerson BC, Blacker D, Buckner RL, Dale AM, Maguire RP, Hyman BT et al: An automated labeling system for subdividing the human cerebral cortex on MRI scans into gyral based regions of interest. Neuroimage 2006, 31(3):968-980.
8. Khoonkari M, Liang D, Kamperman M, Kruyt FAE, van Rijn P: Physics of Brain Cancer: Multiscale Alterations of Glioblastoma Cells under Extracellular Matrix Stiffening. Pharmaceutics 2022, 14(5).
Figures
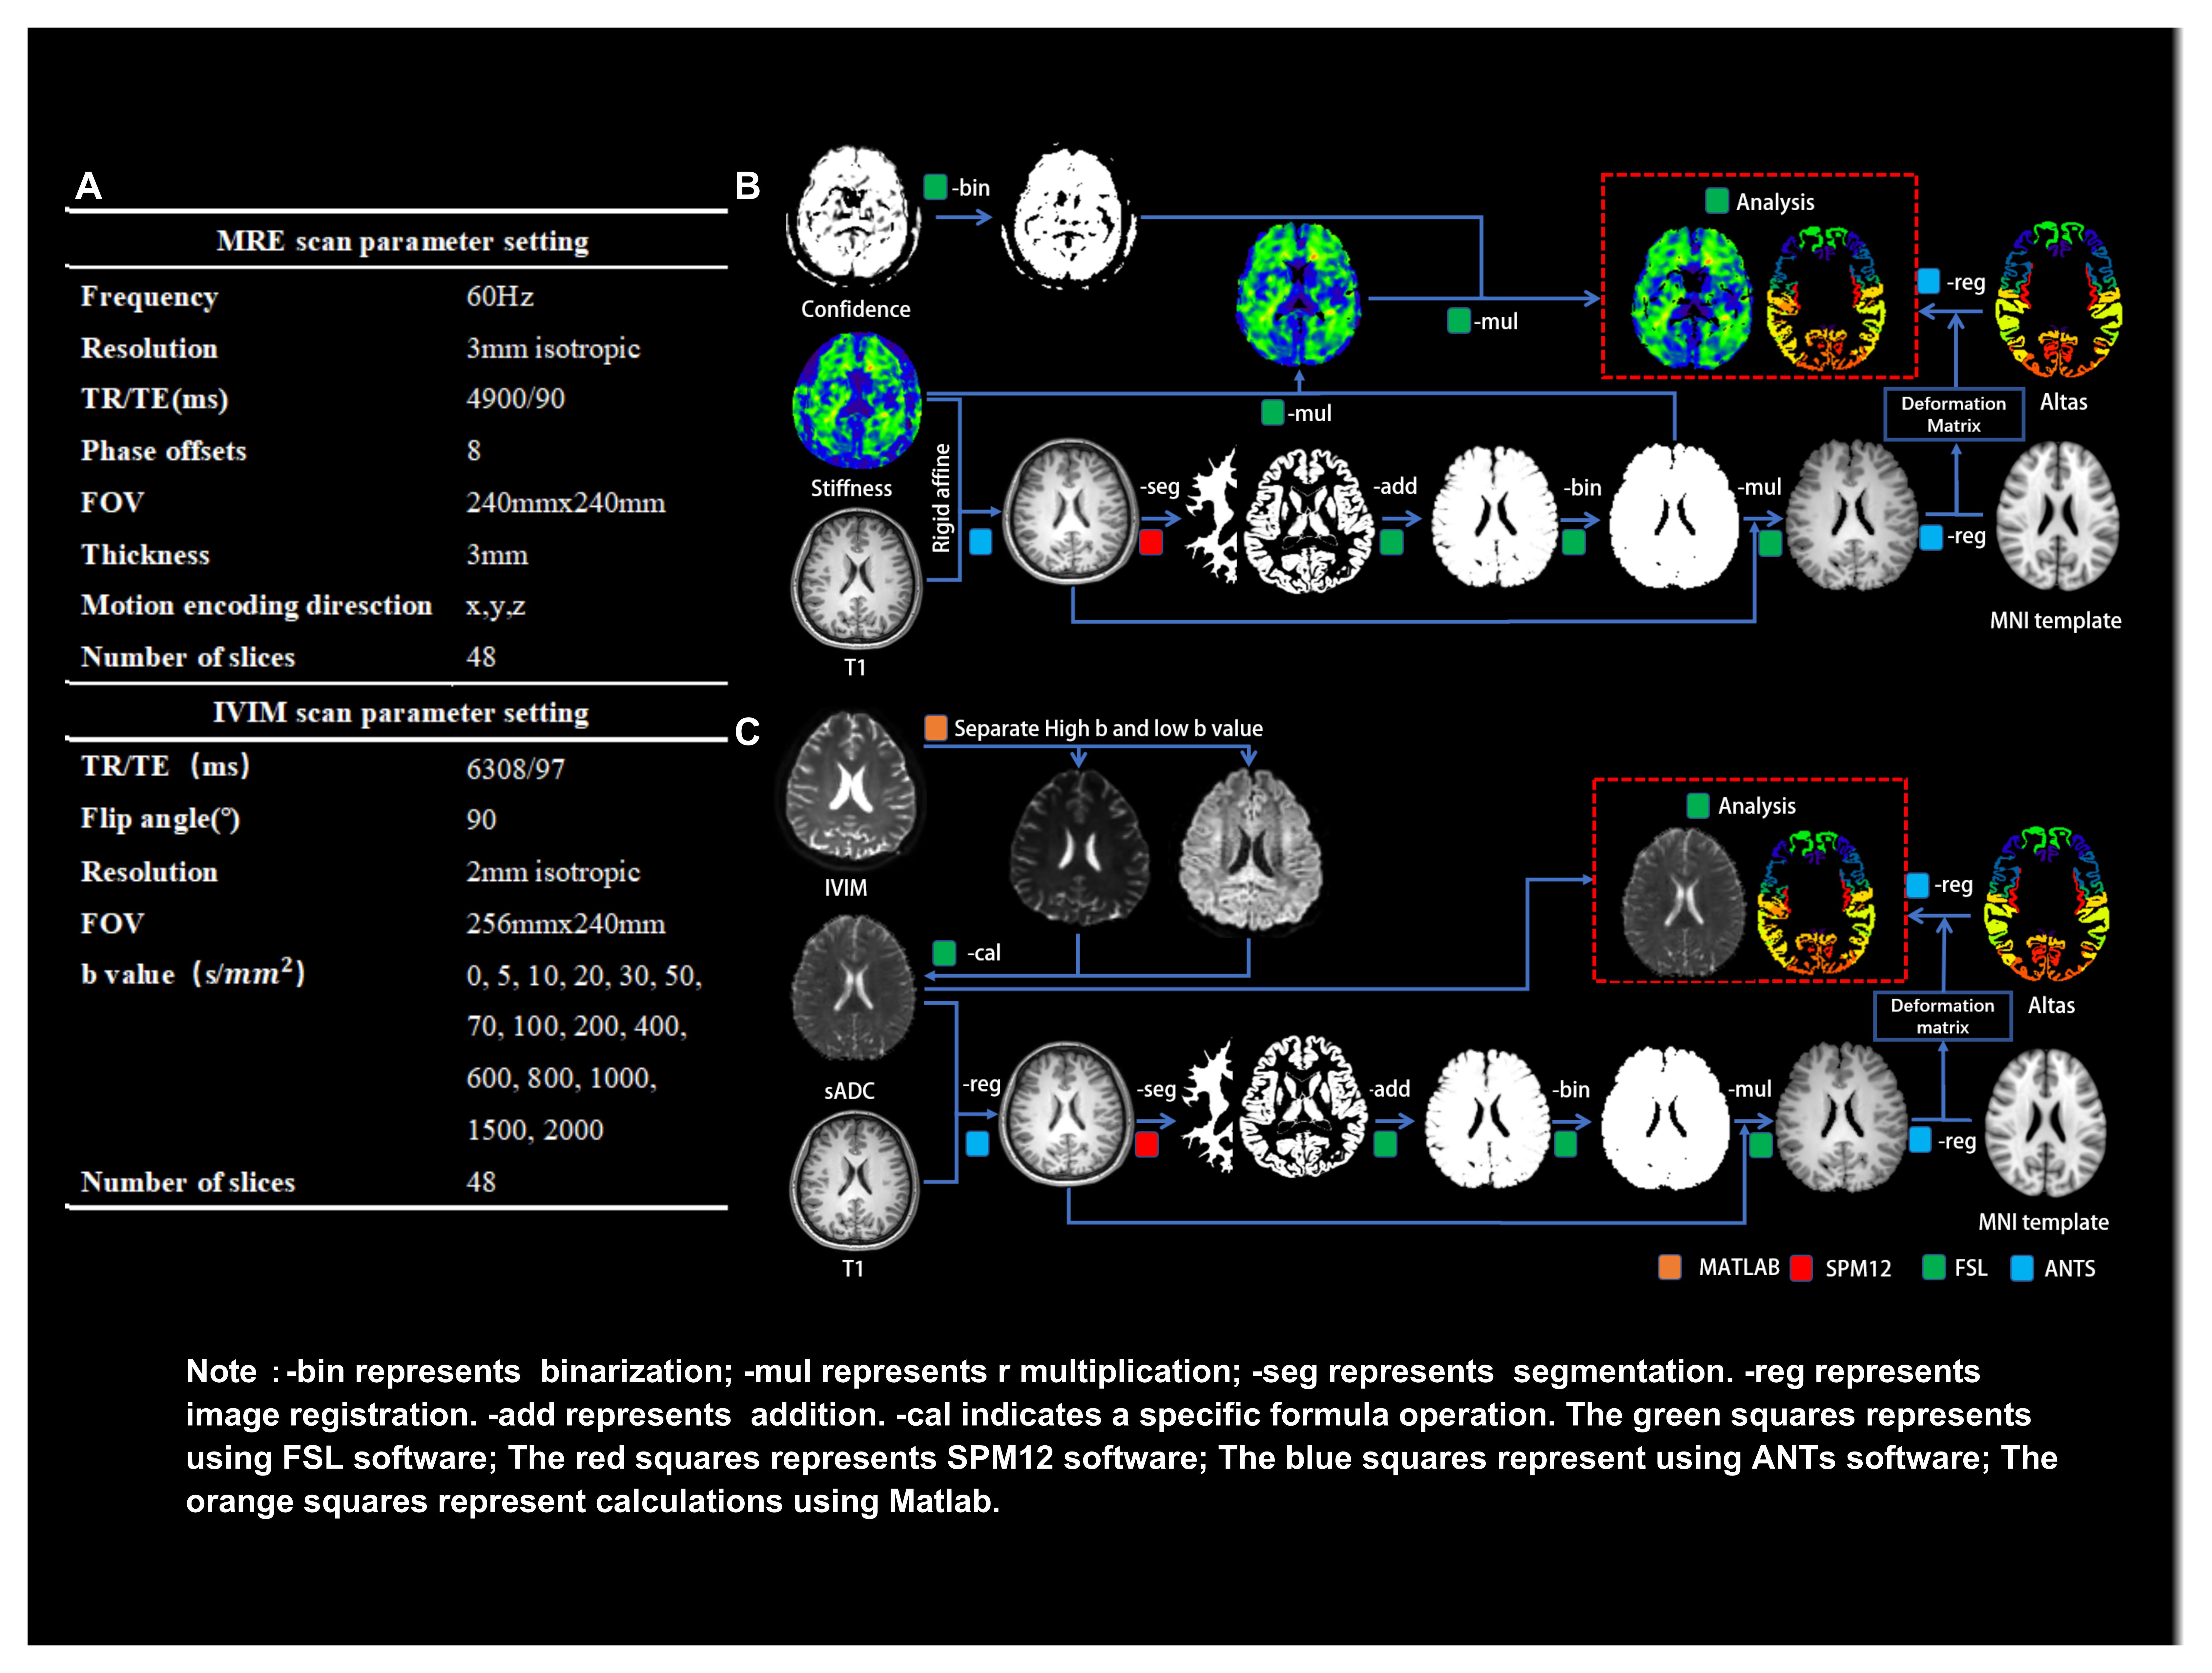
Figure 1: Schematic diagram of MRE and IVIM image post-processing pipeline
A represents the parameters setting of MRE and IVIM.
B represents the processing flow of MRE data (Moduli : shear stiffness ).
C represents the IVIM data processing flow.