4211
Characterizing Age- and Region-Dependent Macromolecule Signals in the Brain: A 7T 1H MRS Study1Purdue University, West Lafayette, IN, United States, 2Ecole Polytechnique Fédérale de Lausanne, Lausanne, Switzerland, 3Center for Biomedical Imaging, Lausanne, Switzerland, 4University of Fribourg, Fribourg, Switzerland
Synopsis
Keywords: Aging, Brain, Macromolecule
Motivation: Macromolecular (MM) signals overlap with metabolite signals and hinder accurate quantification of lower concentration metabolites, but MM content differences across age and brain region have remained elusive.
Goal(s): This study assesses MM differences linked to specific brain regions and age by analyzing metabolite signals in the M1 and thalamus.
Approach: We created age- and region-specific MM basis sets and evaluated quantification differences that arose from using matched and unmatched basis sets on the quantification of normal short-echo time spectra.
Results: We found significant differences in metabolite quantification between young and older adults, emphasizing the importance of age-specific MM basis sets for accurate results.
Impact: The research highlights the impact of age-related MM differences on metabolite quantification and emphasizes the need for tailored MM basis sets in spectroscopic studies.
Introduction
Short TE 1H magnetic resonance spectra contain underlying broader signals emanating from macromolecules (MM) of higher molecular weight.1 The MM signal has been characterized as having short T1 and T2 relaxation times.1 This can confound the quantification of metabolites, leading to bias in estimated concentrations. Therefore, the accurate quantification of metabolites is dependent on the estimation of MM content in the spectrum and is valuable for understanding metabolic processes of aging and disease. Previous studies have reported inconsistent conclusions regarding MM differences in different brain regions with different tissue content.2–5 For instance, some have shown slight differences in MM content in grey matter-rich regions compared to white matter-rich regions,4,5 while others reported no differences.2,3 Additionally, MM differences between age groups have also been inconclusive.6–8 Thus there remains a knowledge gap in whether there are brain region-related and age-linked differences in MM composition. The purpose of this study is to measure MM spectra in the primary motor cortex (M1) and thalamus of young and elderly subjects, to assess the metabolite levels in both brain regions by creating age- and region-dependent MM basis sets, and to evaluate whether quantification of normal short-TE spectra is impacted by using age/region-matched or unmatched basis sets.Methods
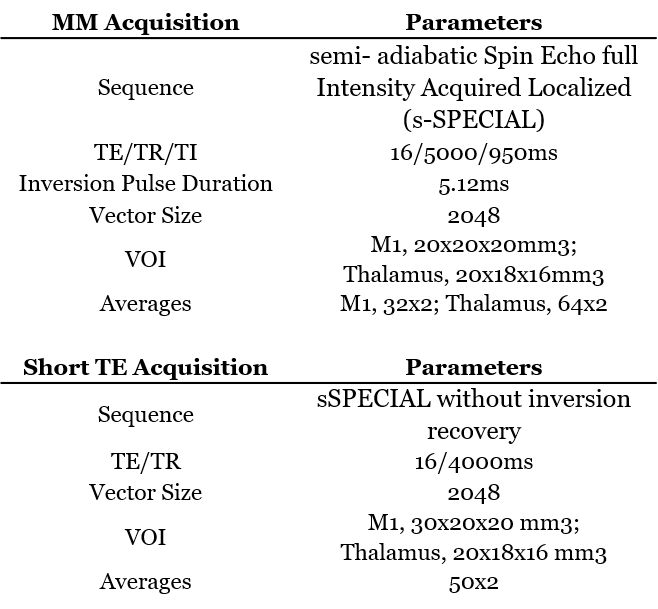
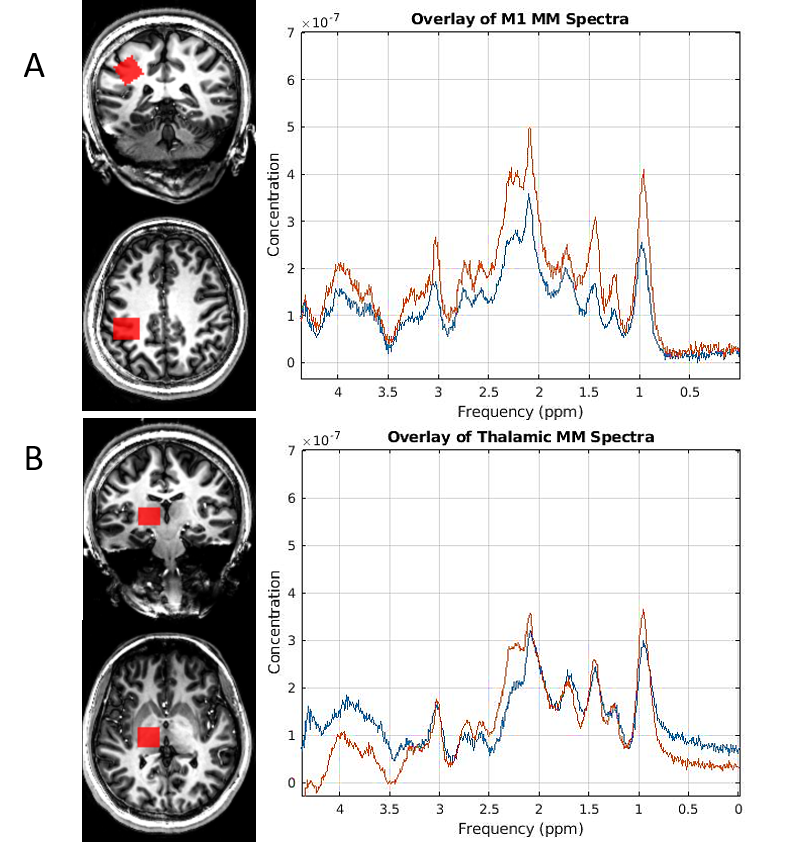
Ten healthy young adults (3M, 7F; age-range 19 to 30 years) and ten healthy older adults (5M, 5F; age-range 66 to 77 years) underwent a magnetic resonance imaging (MRI) examination on a 7T/68cm Siemens Magnetom scanner (Siemens Healthcare, Erlangen, Germany) using a 32-channel Nova coil. MM spectra were acquired using the semi- adiabatic Spin Echo full Intensity Acquired Localized (s-SPECIAL) sequence in the thalamus and M1, with the parameters in Table 1. Spectra were processed using the FID-A Toolbox9 in Matlab, grouped by age and brain region, and were aligned and averaged to create four basis sets (Figure 1).To evaluate the influence of MM basis spectra on short-TE spectra, we acquired measurements from M1 using sSPECIAL without inversion recovery in a separate cohort consisting of 16 young adults (22-34 years old) and 16 elderly adults (64-79 years old). Short-TE spectra from the thalamus were acquired in 6 young adults using the parameters in Table 1.
All spectra were quantified with LCModel10 using both the elderly and young basis sets for each corresponding brain region. Differences in metabolite quantification resulting from basis sets were determined through calculated coefficient of variance (CV%) and paired t-Tests of the concentrations, Cramer Rao Lower Bounds (CRLB), and standard deviations (SD).
Results
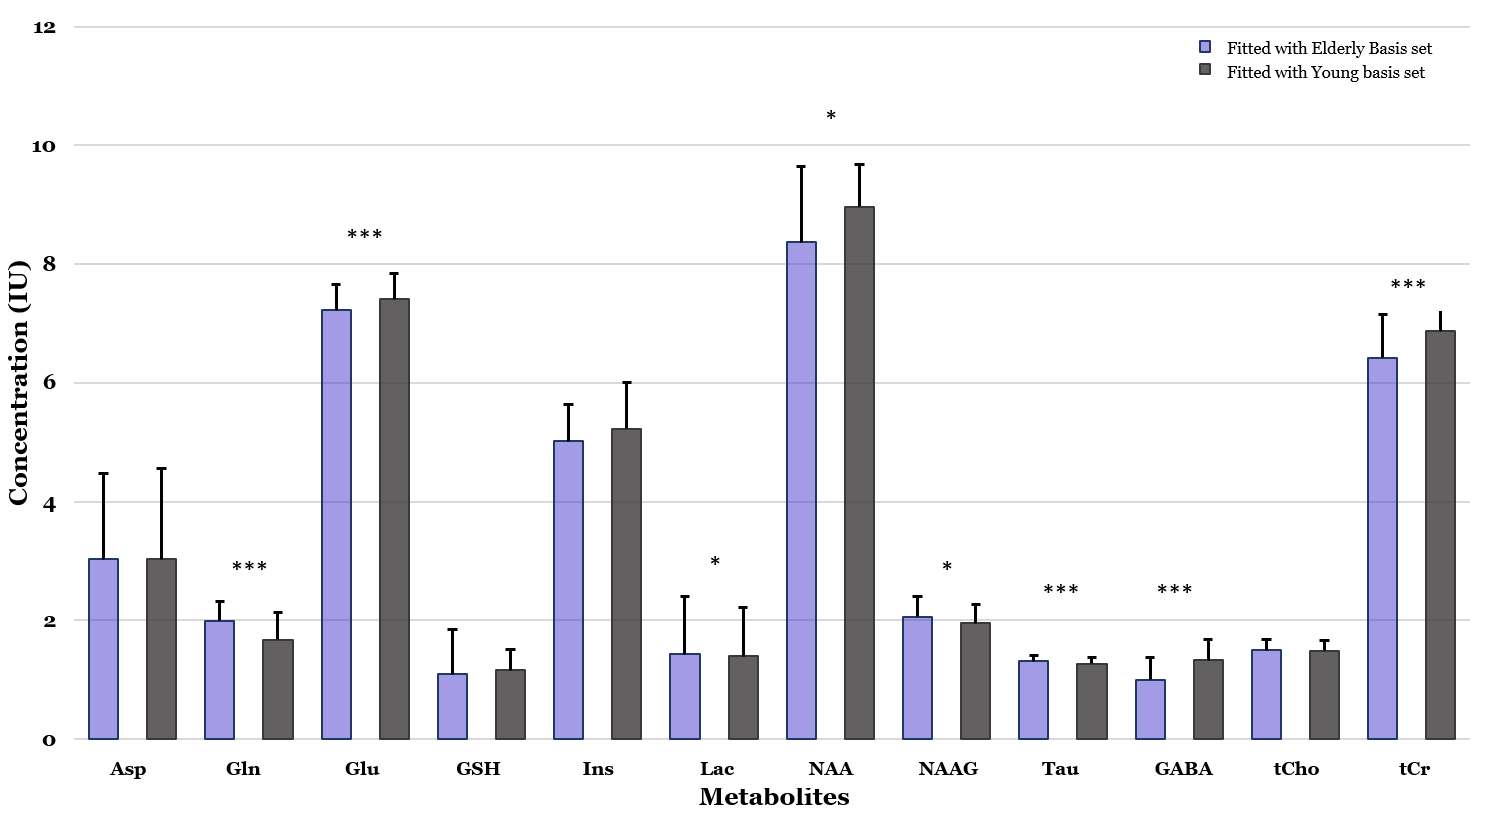
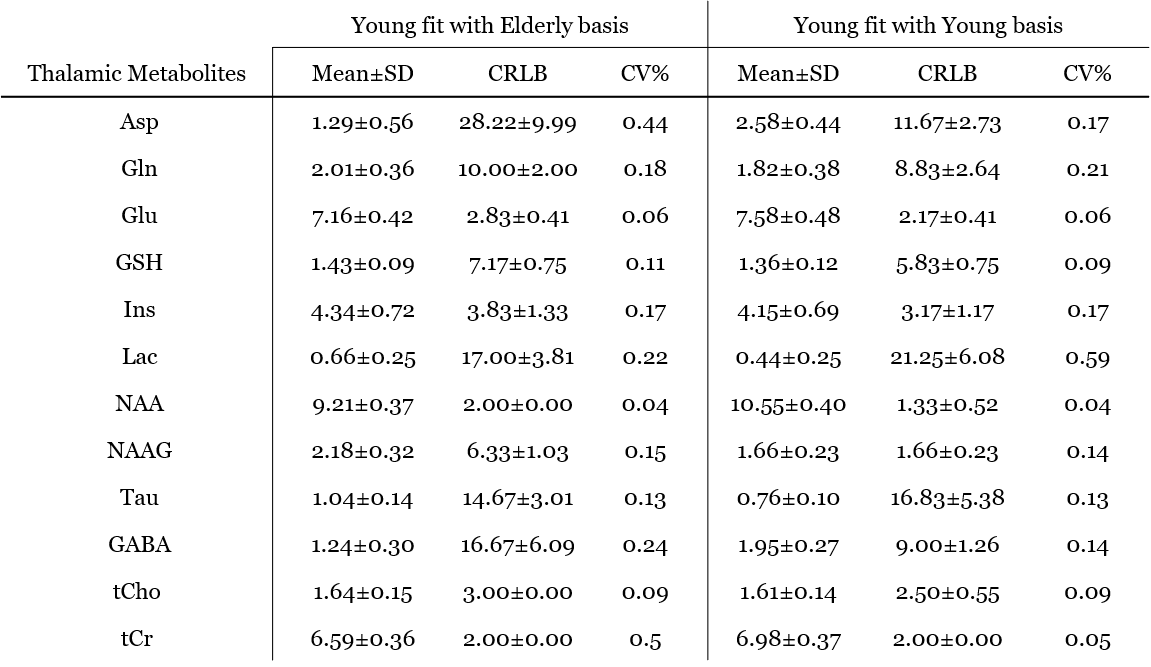
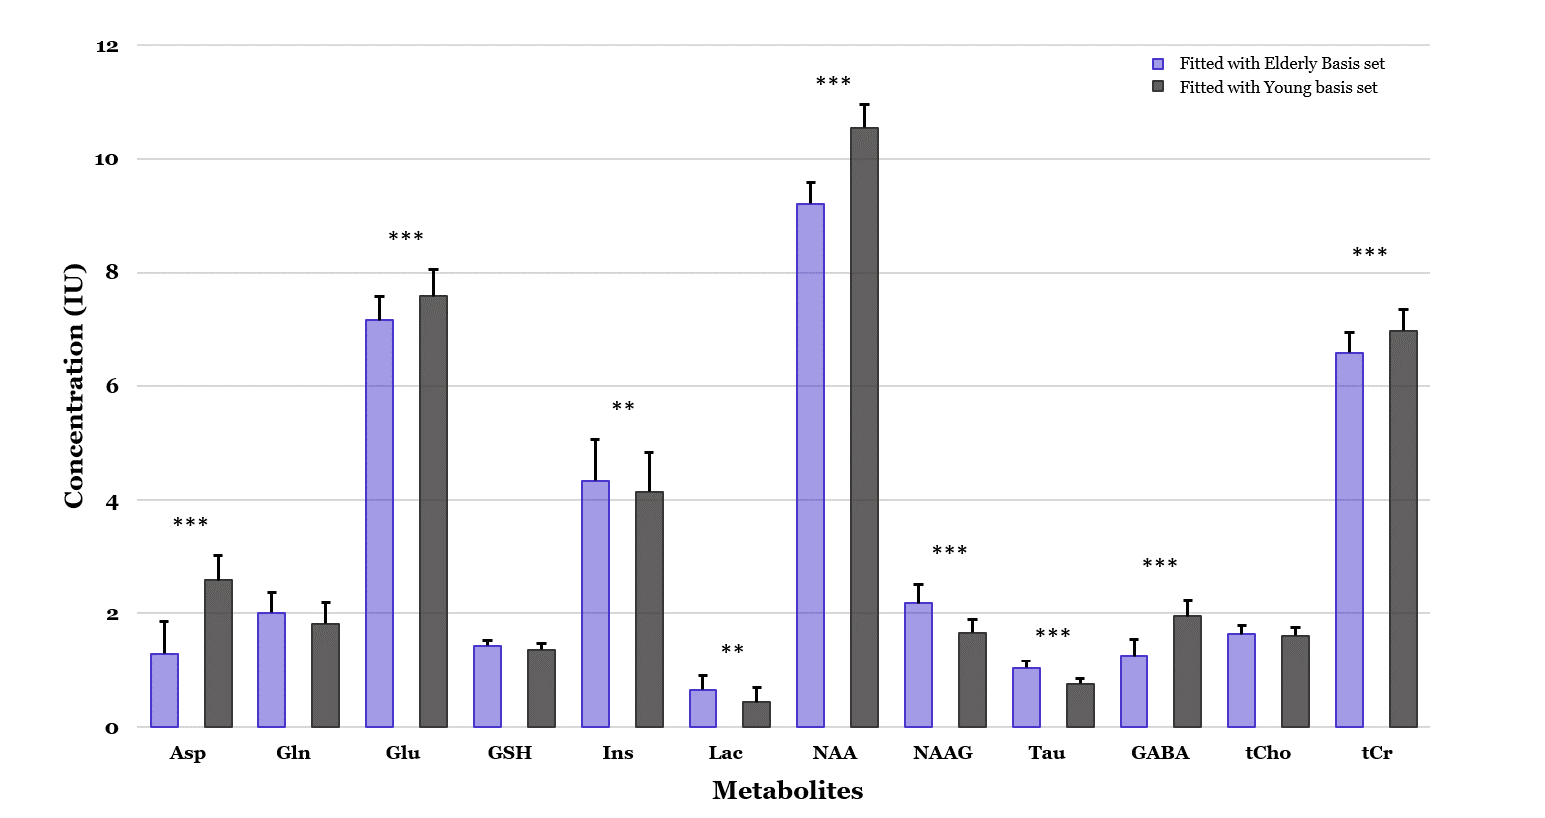
Figure 1 shows the difference in MM content between age, including higher content of MM resonances in the M1 of young subjects. The 12 metabolites were reliably quantified in each brain region with CRLB below 30% with either region-specific basis set. There were significant differences (p<0.05) in the M1 of the elderly group fitted with the elderly versus young M1 basis sets in 8 metabolites (Gln, Glu, Lac, NAA, Tau, GABA, and tCr) (Figure 2), but the CRLB were only significantly different for GSH (p=0.001) and GABA (p=0.003). In the M1 of the young group fitted with the elderly versus young M1 basis sets, there were significant differences in Gln, Glu, Lac, and NAAG concentrations. However, the CRLB were statistically different for 7 metabolites (Gln, Glu, GSH, Ins, NAA, GABA, and tCr). In the thalamus of the young group fitted with the elderly versus young thalamus basis sets, there were significant differences in 9 metabolites, Asp, Glu, Ins, Lac, NAA, NAAG, Tau, GABA, and tCr, with differences in the CRLB of Asp, Glu, GSH, Ins, NAA, NAAG, and GABA. Additionally, the SD and CV% were generally lower in both groups and brain regions when fitted with the respective age-corresponding basis sets.Discussion and Conclusion
In this study, we measured and compared the metabolite signals from two VOIs using two different age- and region- dependent MM basis sets. To compare the differences in the metabolic profiles obtained when using two different MM basis sets, the standard deviations, CRLBs and CV% were analyzed. All three of these measures were found to be lower in each age group and brain region fitted with its corresponding basis set, i.e. the elderly M1 spectra fitted with the elderly M1 basis set produced more accurate quantification compared to the same spectra fitted with the young M1 basis set. This is indicative of age-related MM differences. We conclude that MM spectra are influenced by age and region and they should be correctly incorporated in short-TE MRS quantification to avoid bias in metabolite concentration estimation.Acknowledgements
This work was supported by the Swiss National Science Foundation (grants n° 32003B_197687). We acknowledge access to the facilities and expertise of the CIBM Center for Biomedical Imaging, a Swiss research center of excellence funded and supported by Lausanne University Hospital (CHUV), University of Lausanne (UNIL), Ecole Polytechnique Fédérale de Lausanne (EPFL), University of Geneva (UNIGE) and Geneva University Hospitals (HUG).References
1. Behar KL, Rothman DL, Spencer DD, Petroff OAC. Analysis of macromolecule resonances in 1H NMR spectra of human brain. Magn Reson Med. 1994;32(3):294-302. doi:10.1002/MRM.1910320304 2. Giapitzakis IA, Avdievich N, Henning A. Characterization of macromolecular baseline of human brain using metabolite cycled semi-LASER at 9.4T. Magn Reson Med. 2018;80(2):462-473. doi:10.1002/MRM.27070
3. Snoussi K, Gillen JS, Horska A, et al. COMPARISON OF BRAIN GRAY AND WHITE MATTER MACROMOLECULE RESONANCES AT 3 AND 7 TESLA. Magn Reson Med. 2015;74(3):607. doi:10.1002/MRM.25468
4. Schaller B, Xin L, Gruetter R. Is the macromolecule signal tissue-specific in healthy human brain? A 1H MRS study at 7 tesla in the occipital lobe. Magn Reson Med. 2014;72(4):934-940. doi:10.1002/MRM.24995
5. Mader I, Seeger U, Karitzky J, Erb M, Schick F, Klose U. Proton magnetic resonance spectroscopy with metabolite nulling reveals regional differences of macromolecules in normal human brain. J Magn Reson Imaging. 2002;16(5):538-546. doi:10.1002/JMRI.10190
6. Hofmann L, Slotboom J, Boesch C, Kreis R. Characterization of the macromolecule baseline in localized 1H-MR spectra of human brain. Magn Reson Med. 2001;46(5):855-863. doi:10.1002/MRM.1269 7. Marjańska M, Deelchand DK, Hodges JS, et al. Altered macromolecular pattern and content in the aging human brain. NMR Biomed. 2018;31(2). doi:10.1002/NBM.3865
8. Hui SCN, Gong T, Zöllner HJ, et al. The macromolecular MR spectrum does not change with healthy aging. Magn Reson Med. 2022;87(4):1711-1719. doi:10.1002/MRM.29093
9. Simpson R, Devenyi GA, Jezzard P, Hennessy TJ, Near J. Advanced processing and simulation of MRS data using the FID appliance (FID-A)—An open source, MATLAB-based toolkit. Magn Reson Med. 2017;77(1):23-33. doi:10.1002/MRM.26091/ASSET/SUPINFO/MRM26091-SUP-0001-SUPPINFO.DOCX 10. Provencher SW. Automatic quantitation of localized in vivo 1H spectra with LCModel. NMR Biomed. 2001;14(4):260-264. doi:10.1002/NBM.698
Figures