4208
Validation of deep-learning accelerated quantitative susceptibility imaging for application in deep brain nuclei1Department of Radiology, Second Affiliated Hospital, Zhejiang University School of Medicine, Hangzhou, China, 2Department of Radiology, Taizhou Central Hospital, Taizhou, China, 3UIH America, Houston, TX, United States
Synopsis
Keywords: Aging, Quantitative Susceptibility mapping, Parkinson's disease, Aging, Deep-learning
Motivation: Quantitative susceptibility imaging (QSM) has demonstrated its potential in clinical applications. In patients with Parkinson’s disease, stroke, etc., a shorter acquisition time is desired.
Goal(s): Here we aim to validate the accuracy of a deep learning (DL) based method for accelerating QSM in human volunteers.
Approach: We enrolled 59 participants from communities and acquired both routine QSM and DL-QSM images. We measured iron deposition in deep brain nucleus and studied the influence of different acceleration factors (3,4, and 5).
Results: Results showed that susceptibility values from DL-QSM are highly consistent with routine parallel imaging accelerated images, and they also correlated well with age.
Impact: As we validated the reliability and accuracy of deep-learning accelerated quantitative susceptibility imaging, future clinical studies can use this method on patients who cannot tolerate long scan time.
Introduction
Quantitative susceptibility imaging (QSM) has been widely used in clinical neuroimaging studies1,2. In deep brain nuclei, QSM values are associated with iron deposition, which is common in neurodegenerative diseases. In Parkinson’s disease, QSM values in the substantia nigra can be used for classifying patients and controls3,4. In Alzheimer’s disease, QSM can reflect iron deposition related to amyloid plaques5. In routine clinical settings, the participants generally have a lower tolerance for long scan times due to disease conditions. Reducing the scan time may improve the success rate and imaging quality, providing clinical benefits for higher throughput. Recently, deep-learning (DL) methods have been employed for MR acceleration and reconstruction. Here we aim to test whether DL construction could produce reliable and accurate QSM results over different age groups.Methods
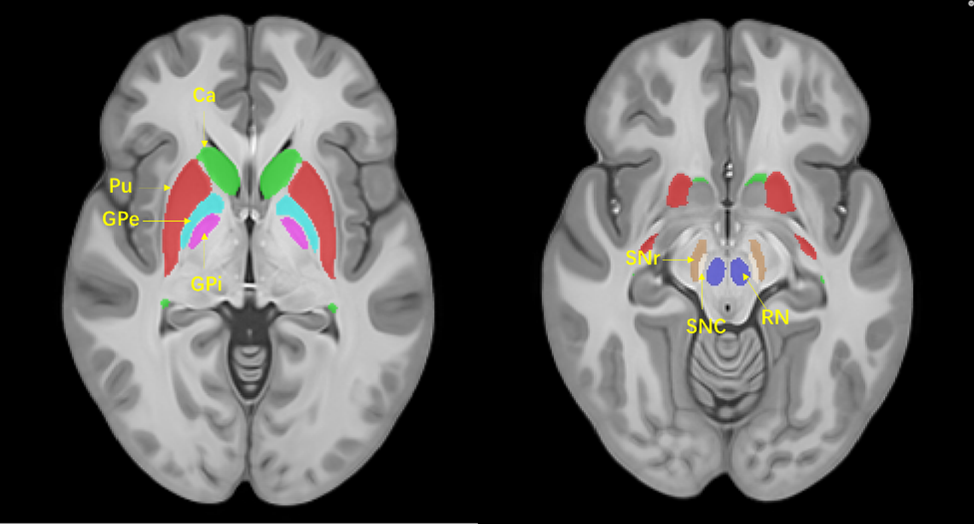
The research protocol has been approved by the ethics committee of the Second Affiliated Hospital, Zhejiang University School of Medicine. All participants signed informed consent before enrollment. MRI examinations were performed on a 3T scanner (uMR790, United Imaging Healthcare, Shanghai, China) with a 32-channel head coil. QSM images were acquired using a traditional 3D multi-gradient-echo sequence equipped with both parallel imaging (PI) and DL method supporting 4~6 fold acceleration as previously described6. The parameters were: TR = 30.2ms, first TE = 3.3ms, last TE = 25.0ms, number of echoes = 8, echo spacing = 3.1ms, flip angle = 15°, voxel size = 0.8mm * 0.8mm * 2mm, covering the whole brain. All parameters were the same for both QSM scans except for acceleration factors. With an acceleration factor (AF) of 2, the scan time of the PI image was 6:46, while the scan time of the DL-QSM scan was 4:35, 3:15, and 2:11 with AF of 3, 4, and 5, respectively. QSM reconstruction was performed by the built-in QSM reconstruction pipeline7 of the scanner. To quantitatively assess the similarity between the PI and DL images, we calculated the structural similarity index (SSIM) and peak signal-to-noise ratio (PSNR) using Matlab (R2019a). To avoid motion-induced displacement of the head, all DL images were first co-registered to the PI images. A deep brain structural template was then co-registered to individual brains through the magnitude image using ANTs registration, then QSM values were extracted from seven deep brain structures (Figure 1; Putamen, Pu; Caudate, Ca; external globus pallidus, GPe; internal globus pallidus, GPi; Subs Red nucleus, RN; substantia nigra pars compacta, SNc; nigra pars reticulata, SNr) using SEPIA (https://github.com/kschan0214/sepia). We first examined the correlation between QSM values derived from different sets of images using Pearson’s correlation. Then we compared the difference between DL and PI images using paired t-tests. Finally, we tested the association between age and susceptibility values in each deep brain nucleus.Results
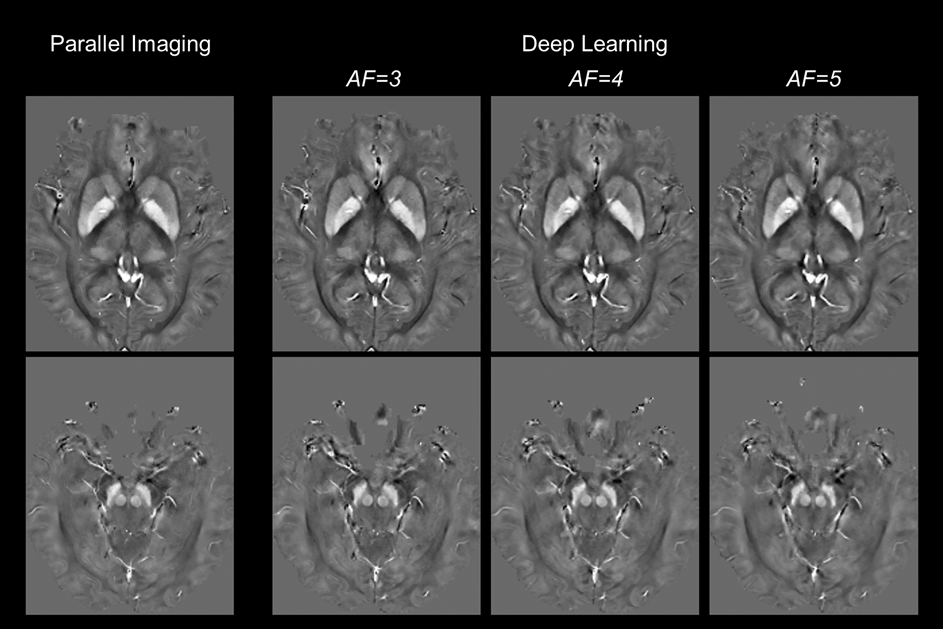
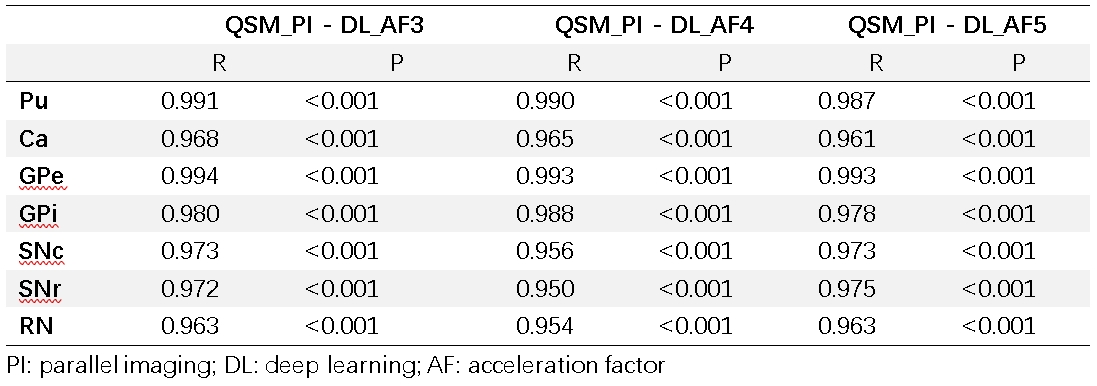
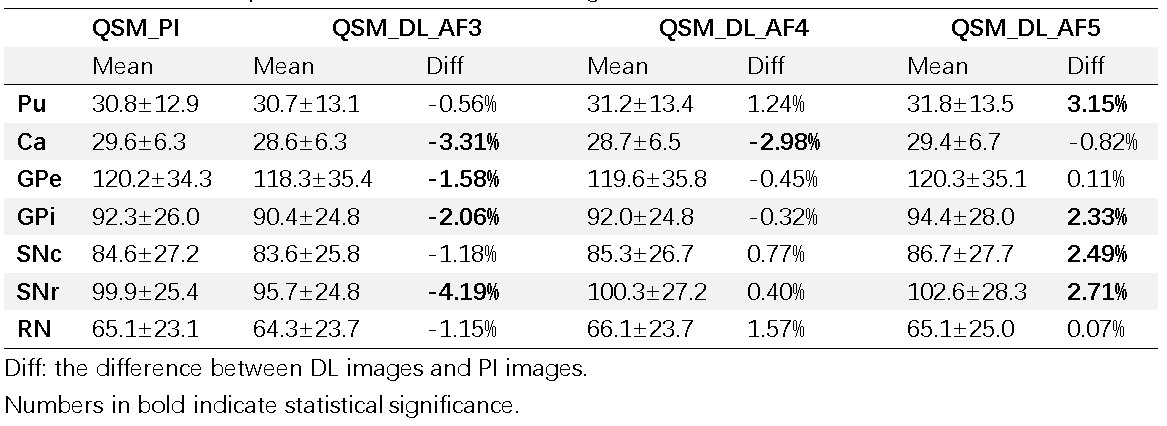
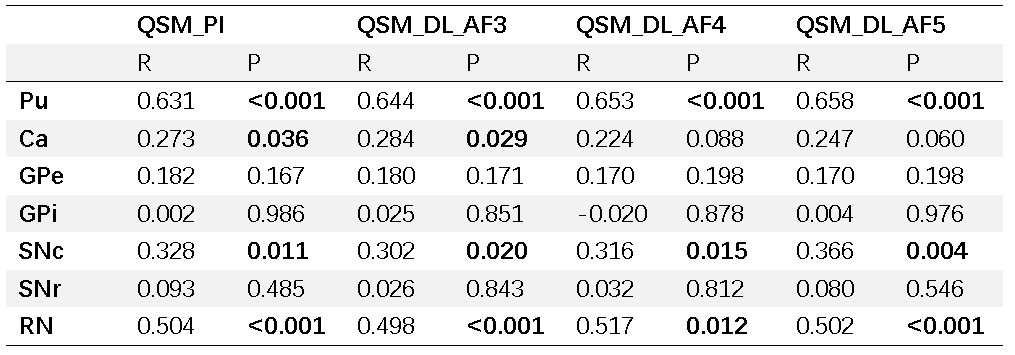
A total of 59 participants were enrolled in this study (mean age: 44.1 y/o; range: 18-75 y/o; male/female: 23/36). In comparison with PI images, the mean SSIM of DL images were 0.86, 0.86, and 0.85 for acceleration factors of 3, 4, and 5 (Figure 2). The mean PSNR were 44.49, 44.46, and 44.08. The correlations between PI and DL images were high (Table 1, r>0.95 and p<0.001 for all). Group comparison analysis showed that the differences between PI and DL images were minimal, with the largest difference of 4.19% in SNr (Table 2). Although a few comparisons showed statistical significance, there was no systematic bias between different sets of images. For PI images, susceptibility values in the Pu, Ca, SNc, and RN were positively associated with age (Table 3). All correlations, except for the Ca in DL_PA4 and DL_PA5, remained significant for DL images.Discussion
Our study showed that DL-QSM images were highly consistent with routine QSM images. With an acceleration factor as high as 5, the scan time could be reduced to 1/3 of the routine acquisition. We had not observed significant changes in image patterns and anatomical details, although the images may become slightly smoothed due to excessive reduction in outer kspace signals. Under certain AFs and in a few nuclei, we observed statistically significant changes in susceptibility values, but they were usually of very small values and could be more susceptible to any disturbance effects, e.g. the increased smoothness in the DL images may introduce interference from adjacent white matter signals. When studying the impact of aging on iron deposition, DL accelerated QSM results also led to identical conclusions.Conclusion
DL-QSM could reliably measure susceptibility values of deep brain nuclei. An AF up to 5 could be used without significantly impacting the stability or accuracy of QSM results.Acknowledgements
This study is supported by the National Natural Science Foundation of China (No. 82371907)References
1. Haacke EM, Liu S, Buch S, et al. Quantitative susceptibility mapping: current status and future directions. Magnetic resonance imaging. 2015 Jan 1;33(1):1-25.
2. Hong H, Wang S, Yu X, et al. White matter tract injury by MRI in CADASIL patients is associated with iron accumulation. Journal of Magnetic Resonance Imaging. 2023 Jan;57(1):238-45.
3.Guan X, Huang P, Zeng Q, et al. Quantitative susceptibility mapping as a biomarker for evaluating white matter alterations in Parkinson’s disease. Brain imaging and behavior. 2019 Feb 15;13:220-31.
4.Wei H, Zhang C, Wang T, et al. Precise targeting of the globus pallidus internus with quantitative susceptibility mapping for deep brain stimulation surgery. Journal of neurosurgery. 2019 Oct 11;133(5):1605-11.
5.Cogswell PM, Wiste HJ, Senjem ML, et al. Associations of quantitative susceptibility mapping with Alzheimer's disease clinical and imaging markers. Neuroimage. 2021 Jan 1;224:117433.
6.Chen E, Ye Y, et al. Accelerating 3D MULTIPLEX MRI Reconstruction with Deep Learning. Joint Annual Meeting ISMRM-ESMRMB & ISMRT Annual Meeting. 2021. p. 2177.
7.Ye Y, Li X, Zhang Q, et al. Dynamic streaking artifact regularization for QSM. Joint Annual Meeting ISMRM-ESMRMB & ISMRT Annual Meeting. Montreal; 2019. p. 4543.
Figures