4207
Quantitative Susceptibility Mapping and Non-contrast Spin-labeling for CSF Outflow: A Dual Biomarker Approach for Neurodegenerative disease1Radiology, UC San Diego, La Jolla, CA, United States, 2VA San Diego Healthcare System, San Diego, CA, United States, 3Canon Medical, Ōtawara-shi, Japan
Synopsis
Keywords: Aging, Aging, QSM, ASL
Motivation: Recognizing the crucial role of iron accumulation and CSF clearance in neurodegenerative diseases, this study aimed to address gaps in measuring these factors simultaneously, which may enhance our understanding of neurodegenerative diseases.
Goal(s): To employ a multiparametric approach integrating Quantitative Susceptibility Mapping (QSM) with non-contrast CSF outflow measurements in a single study.
Approach: Utilize QSM and Time-SLIP techniques on a small cohort to measure and correlate iron levels in the hippocampus and CSF outflow dynamics.
Results: We observed a correlation between iron deposition and age, though no significant age-related changes in CSF outflow were detected, underscoring the need for larger-scale studies.
Impact: This study offers researchers a new perspective on the relationship between iron accumulation CSF dynamics and aging, potentially opening pathways for deeper investigation into the mechanisms of neurodegenerative diseases.
Introduction
Neurodegenerative diseases, such as Alzheimer’s disease (AD), have been associated with impaired cerebrospinal fluid (CSF) clearance from the meninges and abnormal iron accumulation in the hippocampus [1, 2]. Our recent studies have turned to the non-contrast spin-labeling technique, Time-SLIP, to explore patterns of CSF outflow. Findings suggest that CSF clearance is not just a matter of aging but also influenced by lifestyle choices, including physical activity levels [3, 4]. Meanwhile, the Quantitative Susceptibility Mapping (QSM) technique demonstrated an ability to quantify iron accumulations with precision, offering insights into the spatial distribution and concentration of iron in brain [5]. This preliminary study is designed to take a combined multiparametric approach by employing both QSM and the Time-SLIP technique to simultaneously assess iron deposition in the hippocampus and CSF clearance, offering a comprehensive evaluation within the same participant group.Methods
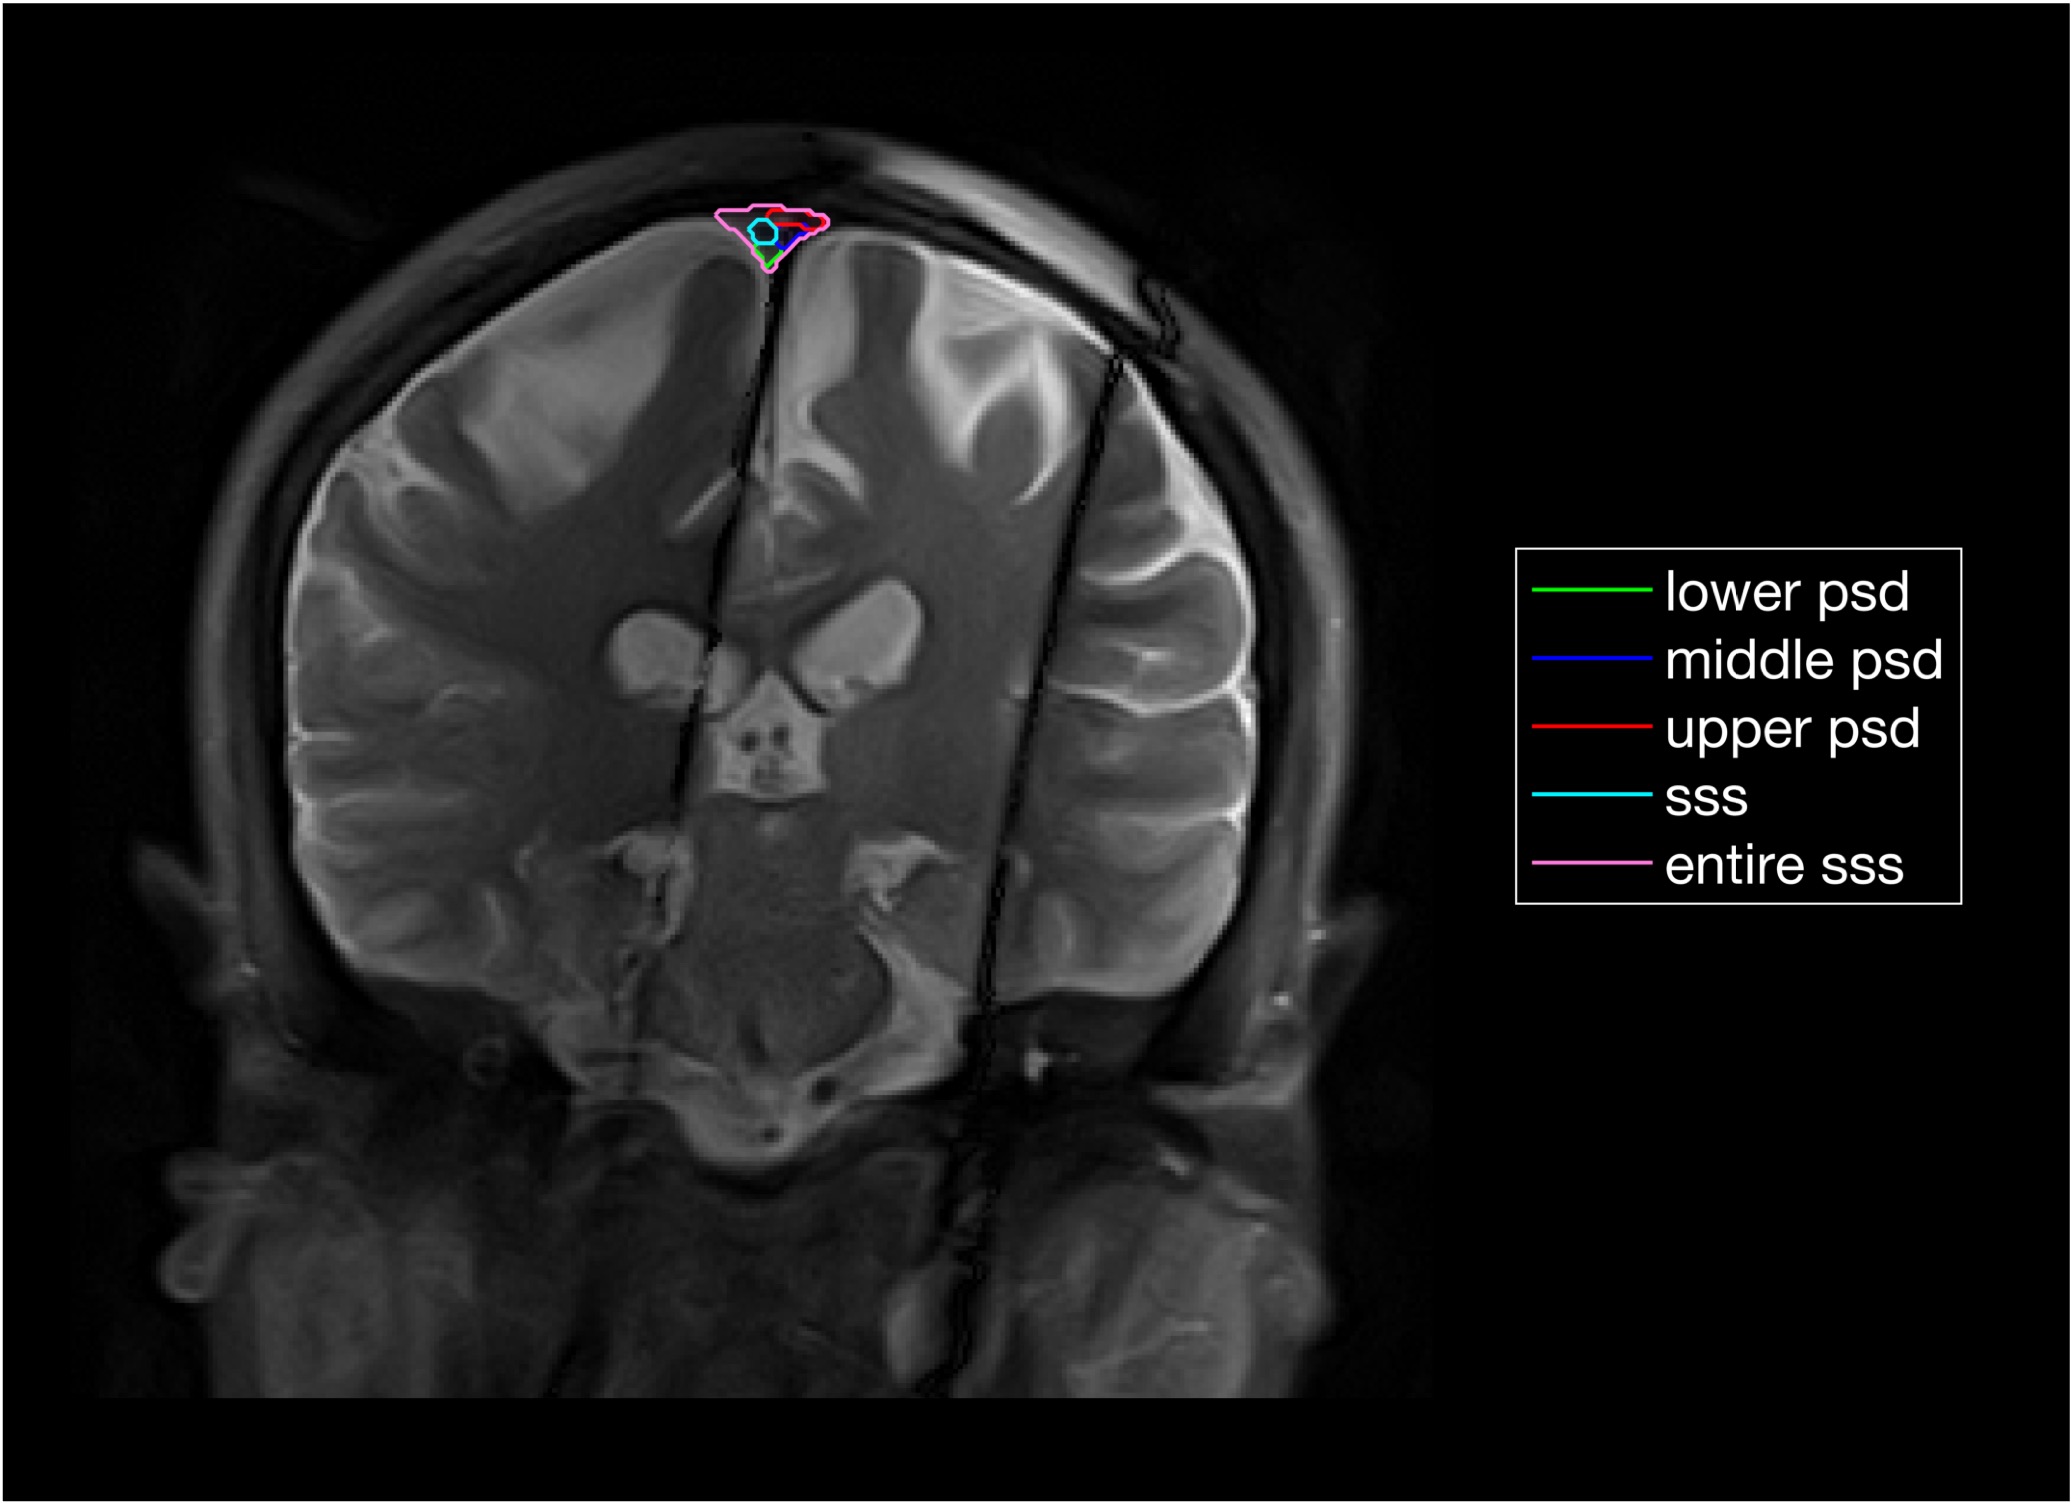
The study was performed on 5 healthy adults scanned on a 3T clinical scanner (Vantage Galan 3T, Canon Medical, Japan) with a 32-ch head SPEEDER coil. The imaging protocol included: (i) 3D single-short fast spin echo (SSFSE) with Time-SLIP inversion times (TI) 300, 750, 1000, 1150, 1250, 1350, 1500, 2000, and 3000 ms; TE/TR=30/5400ms, FOV 35×35cm, matrix size 735×735, and sixteen 2 mm thick slices in coronal orientation and a (ii) 3D gradient echo (FE3D), five TEs=5, 10, 15, 20, and 25ms, TR=29.4ms, FOV 20×20cm, matrix size 240×240, 132 slices, 1mm thick in axial orientation. Quantitative outflow metrics were calculated by fitting SIR=(Tag-on – Tag-off)/Tag-off into the gamma-variate function. PH – peak height in %, TTP – time to peak in seconds, MTT – mean transit time in seconds, rCFV – relative CSF volume in % times second, and rCFF – relative CSF flow in %, were measured for 5 manually segmented regions-of-interests (ROIs): upper parasagittal dura (PSD), middle PSD, lower PSD, and two additional ROIs for superior sagittal sinus (SSS), and the entire region combining all ROIs. QSM values were measured in a single slice from two manually segmented regions of interest corresponding to the left and right hippocampus.Results
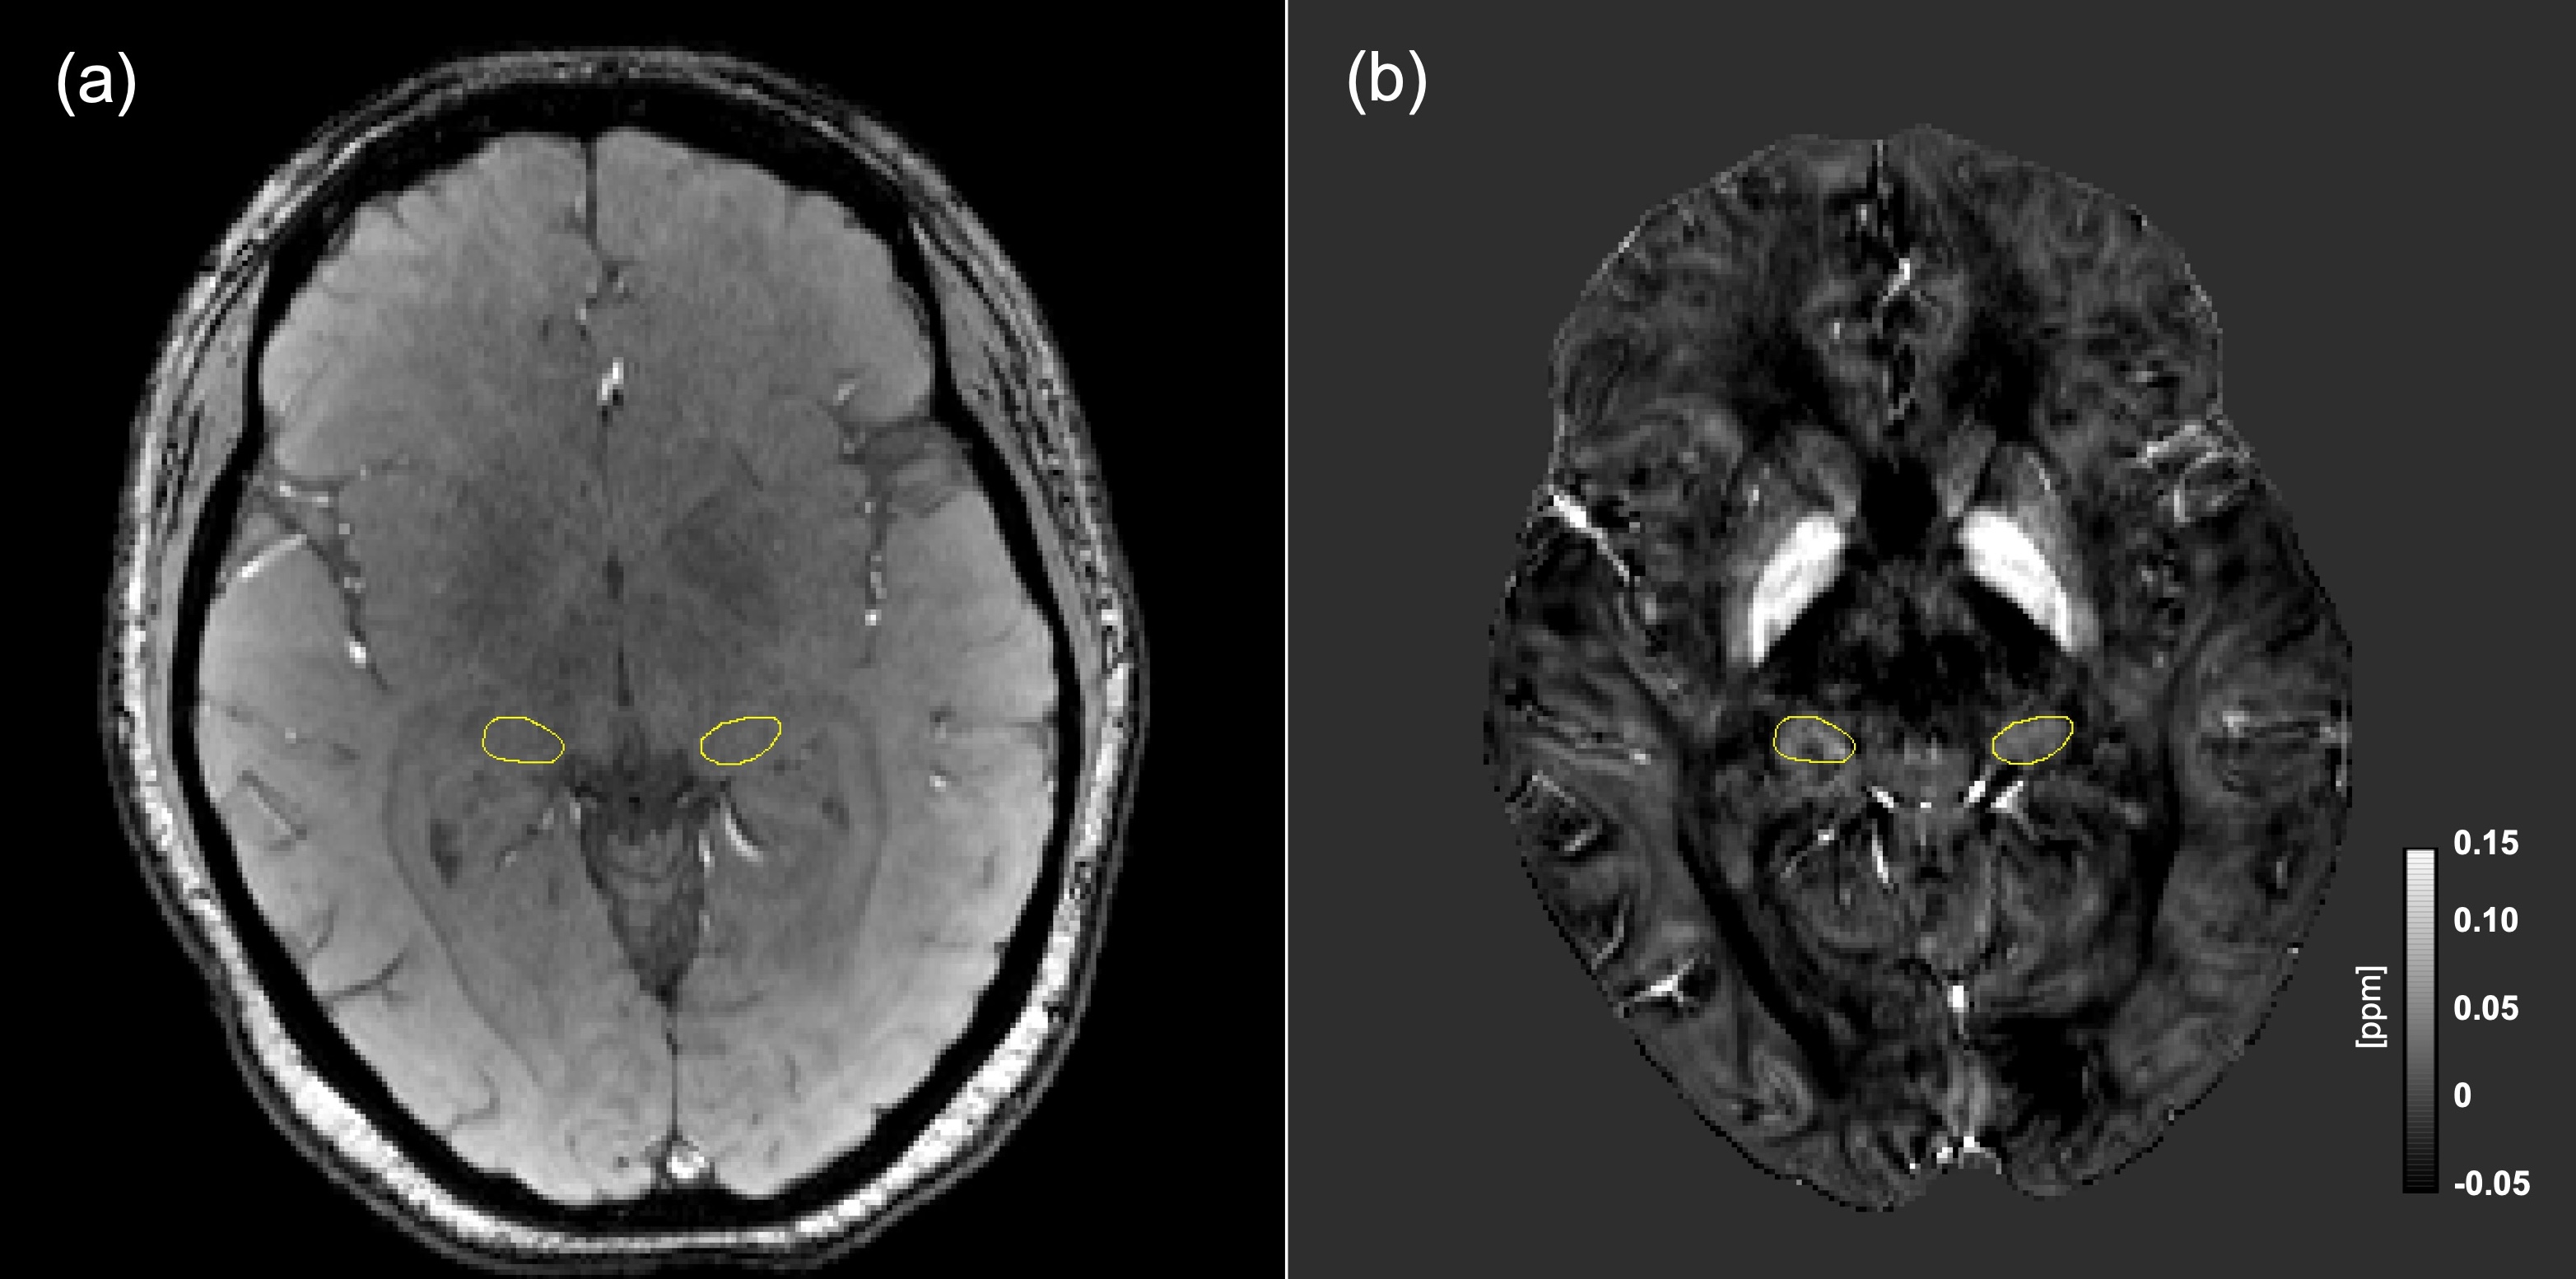
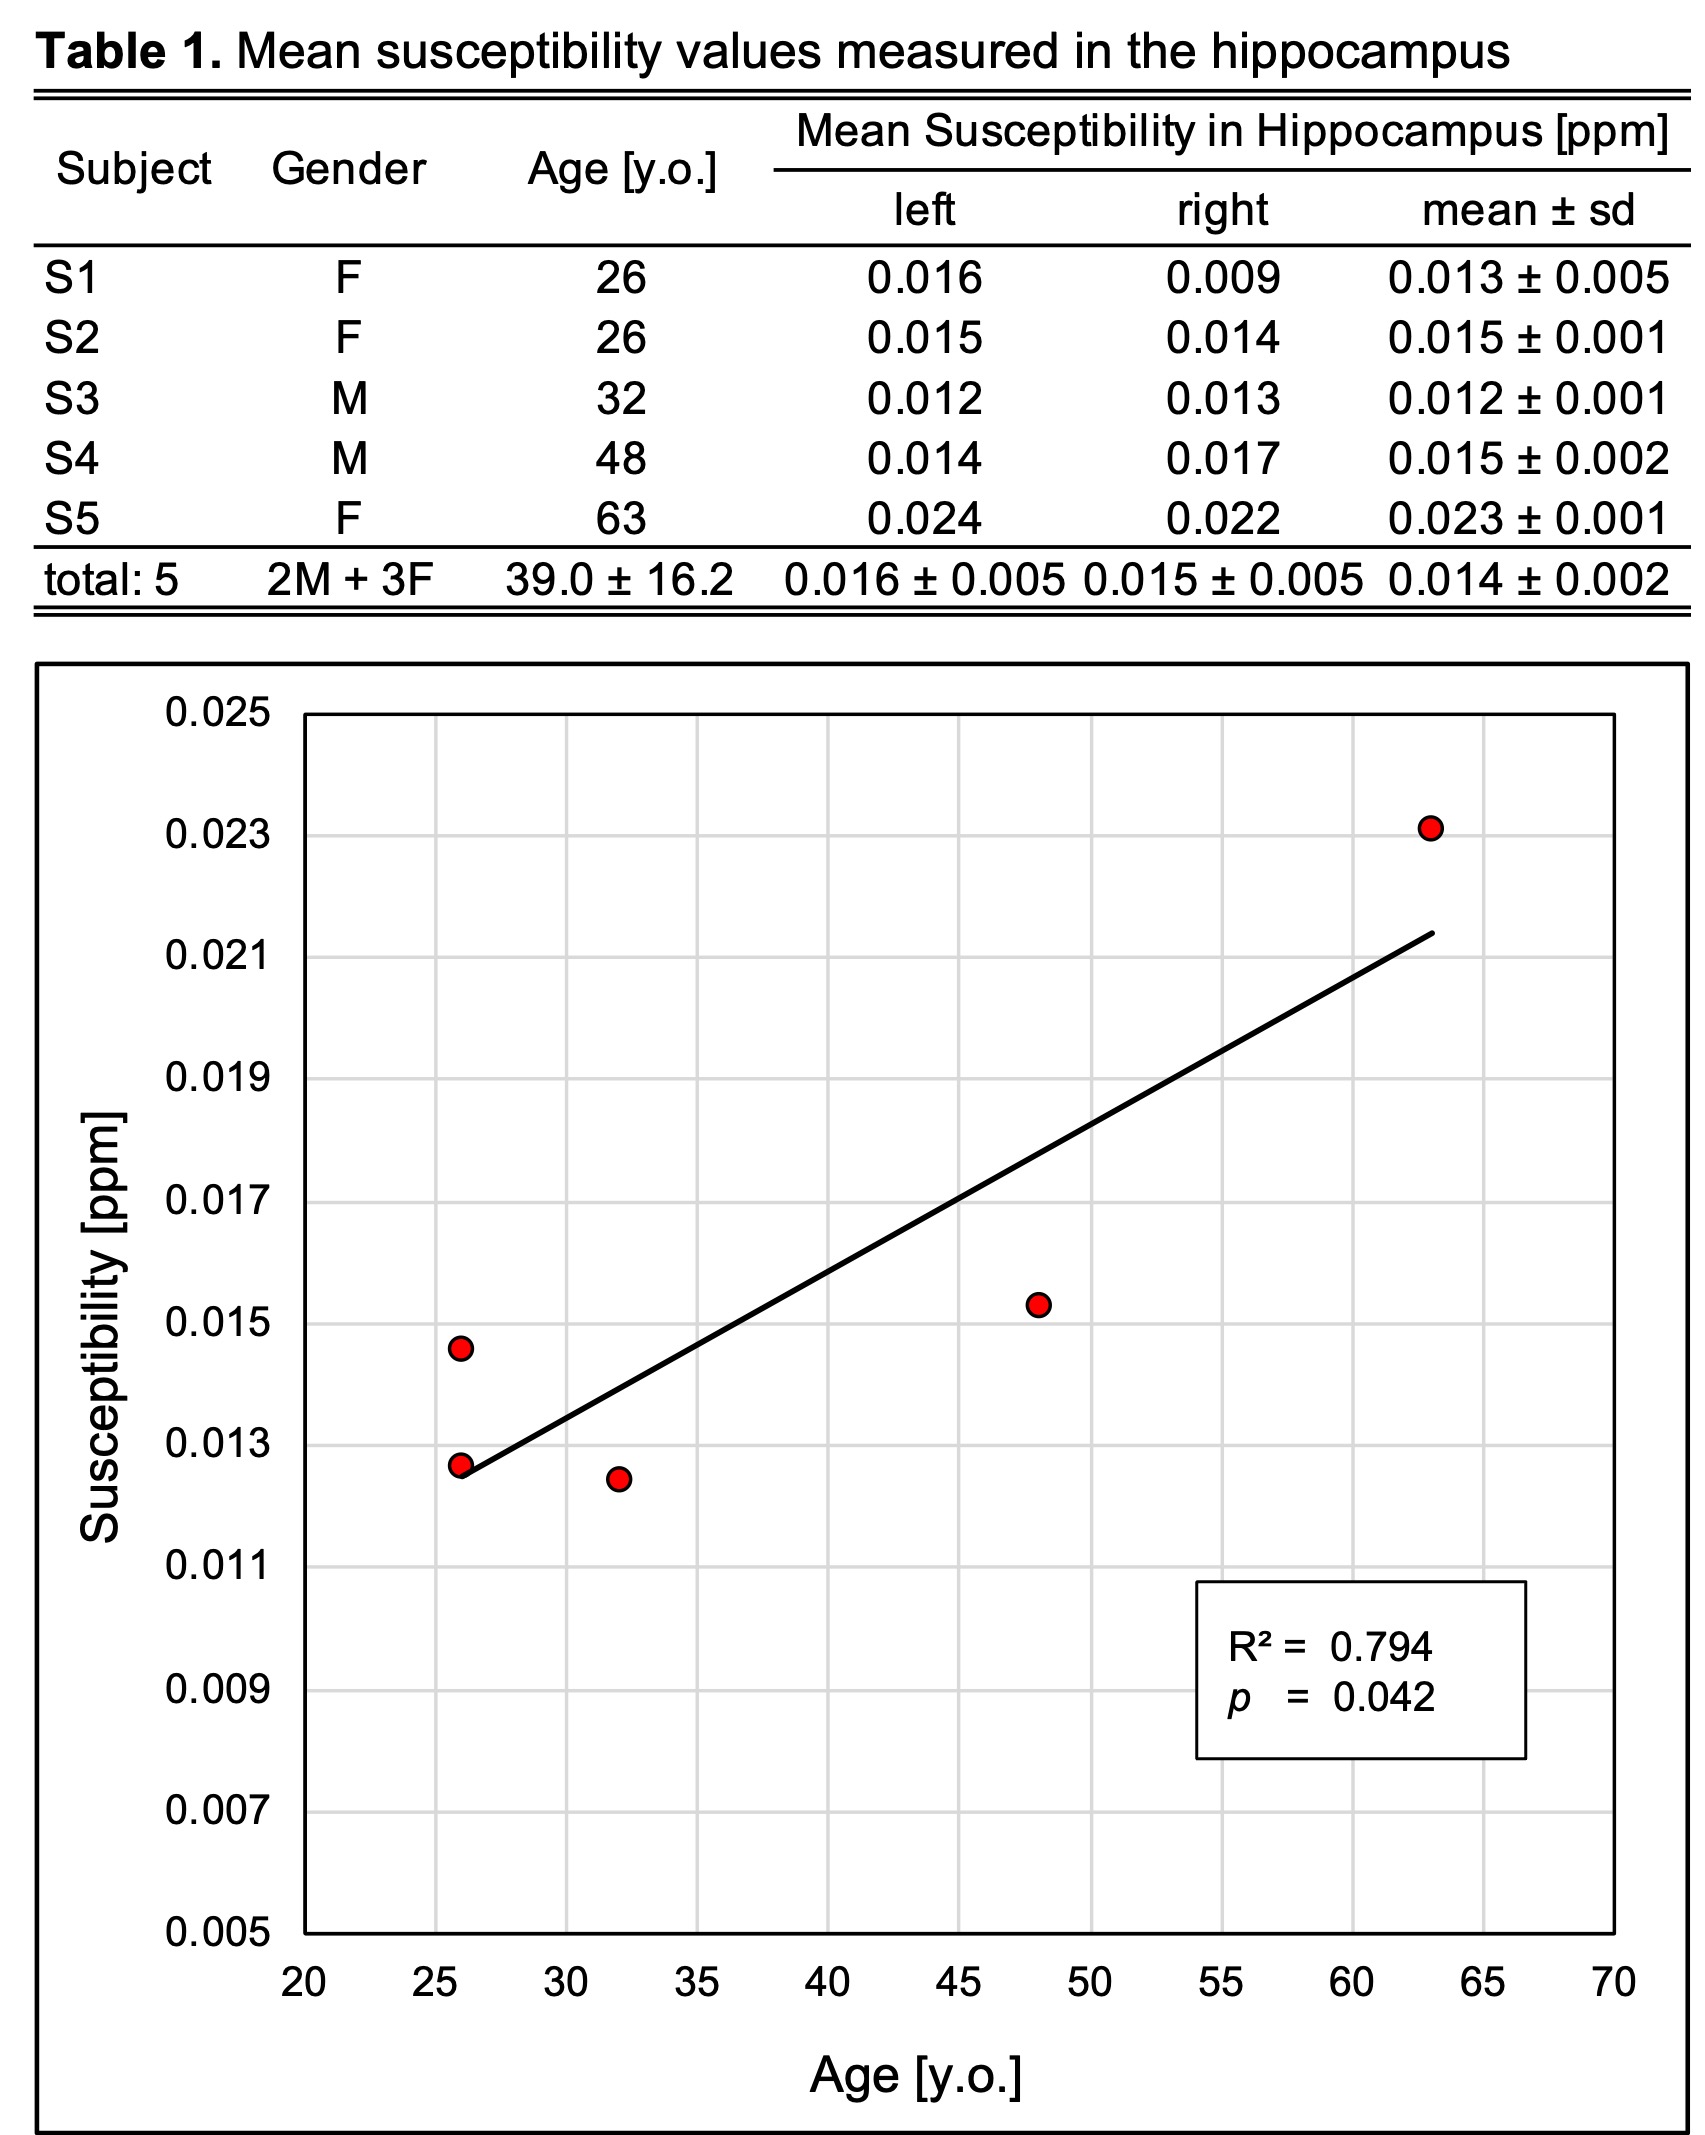
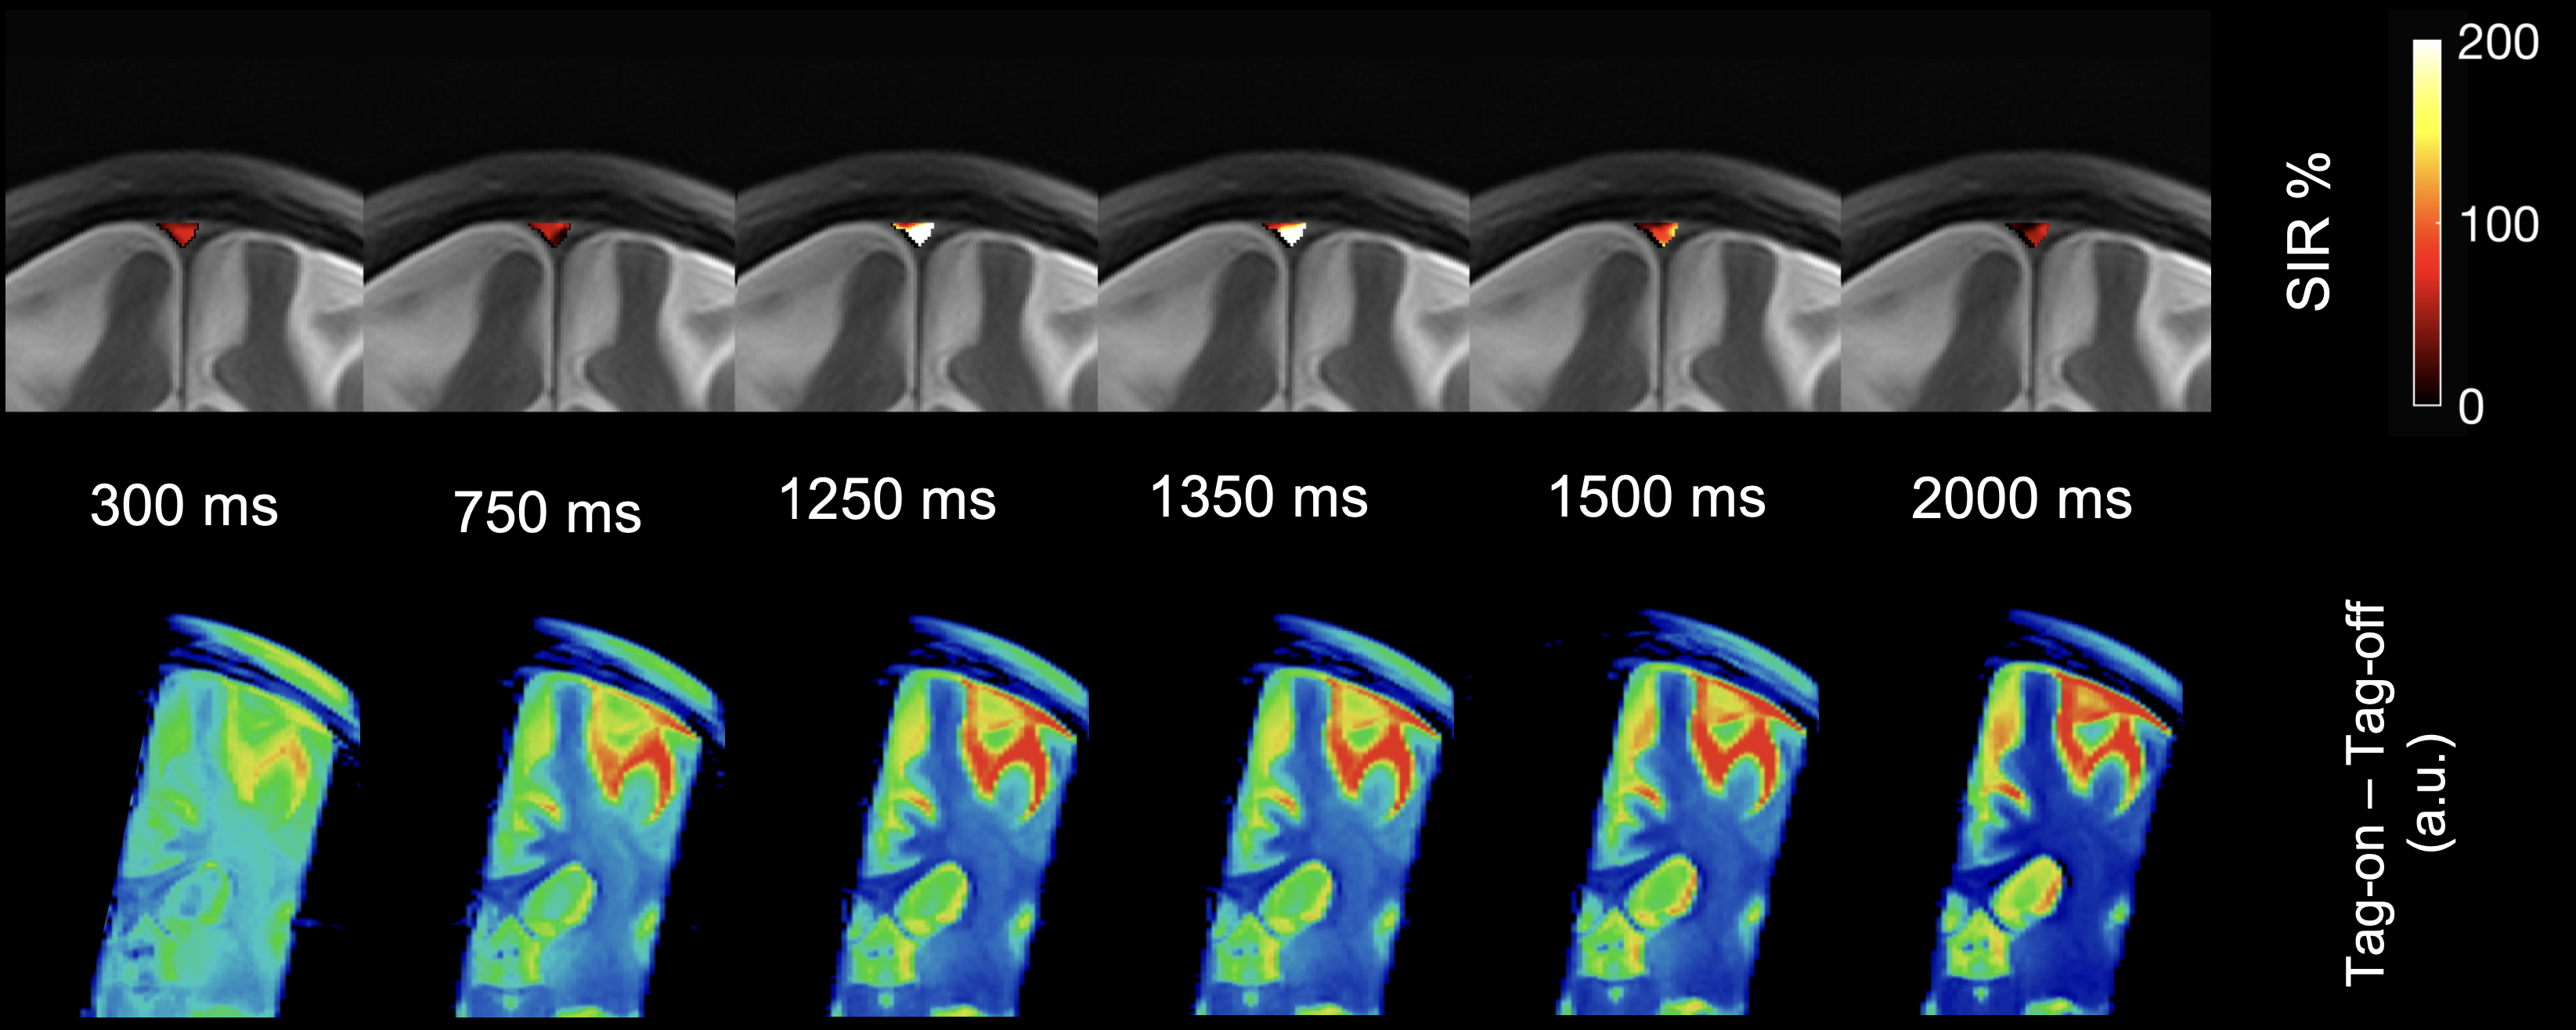
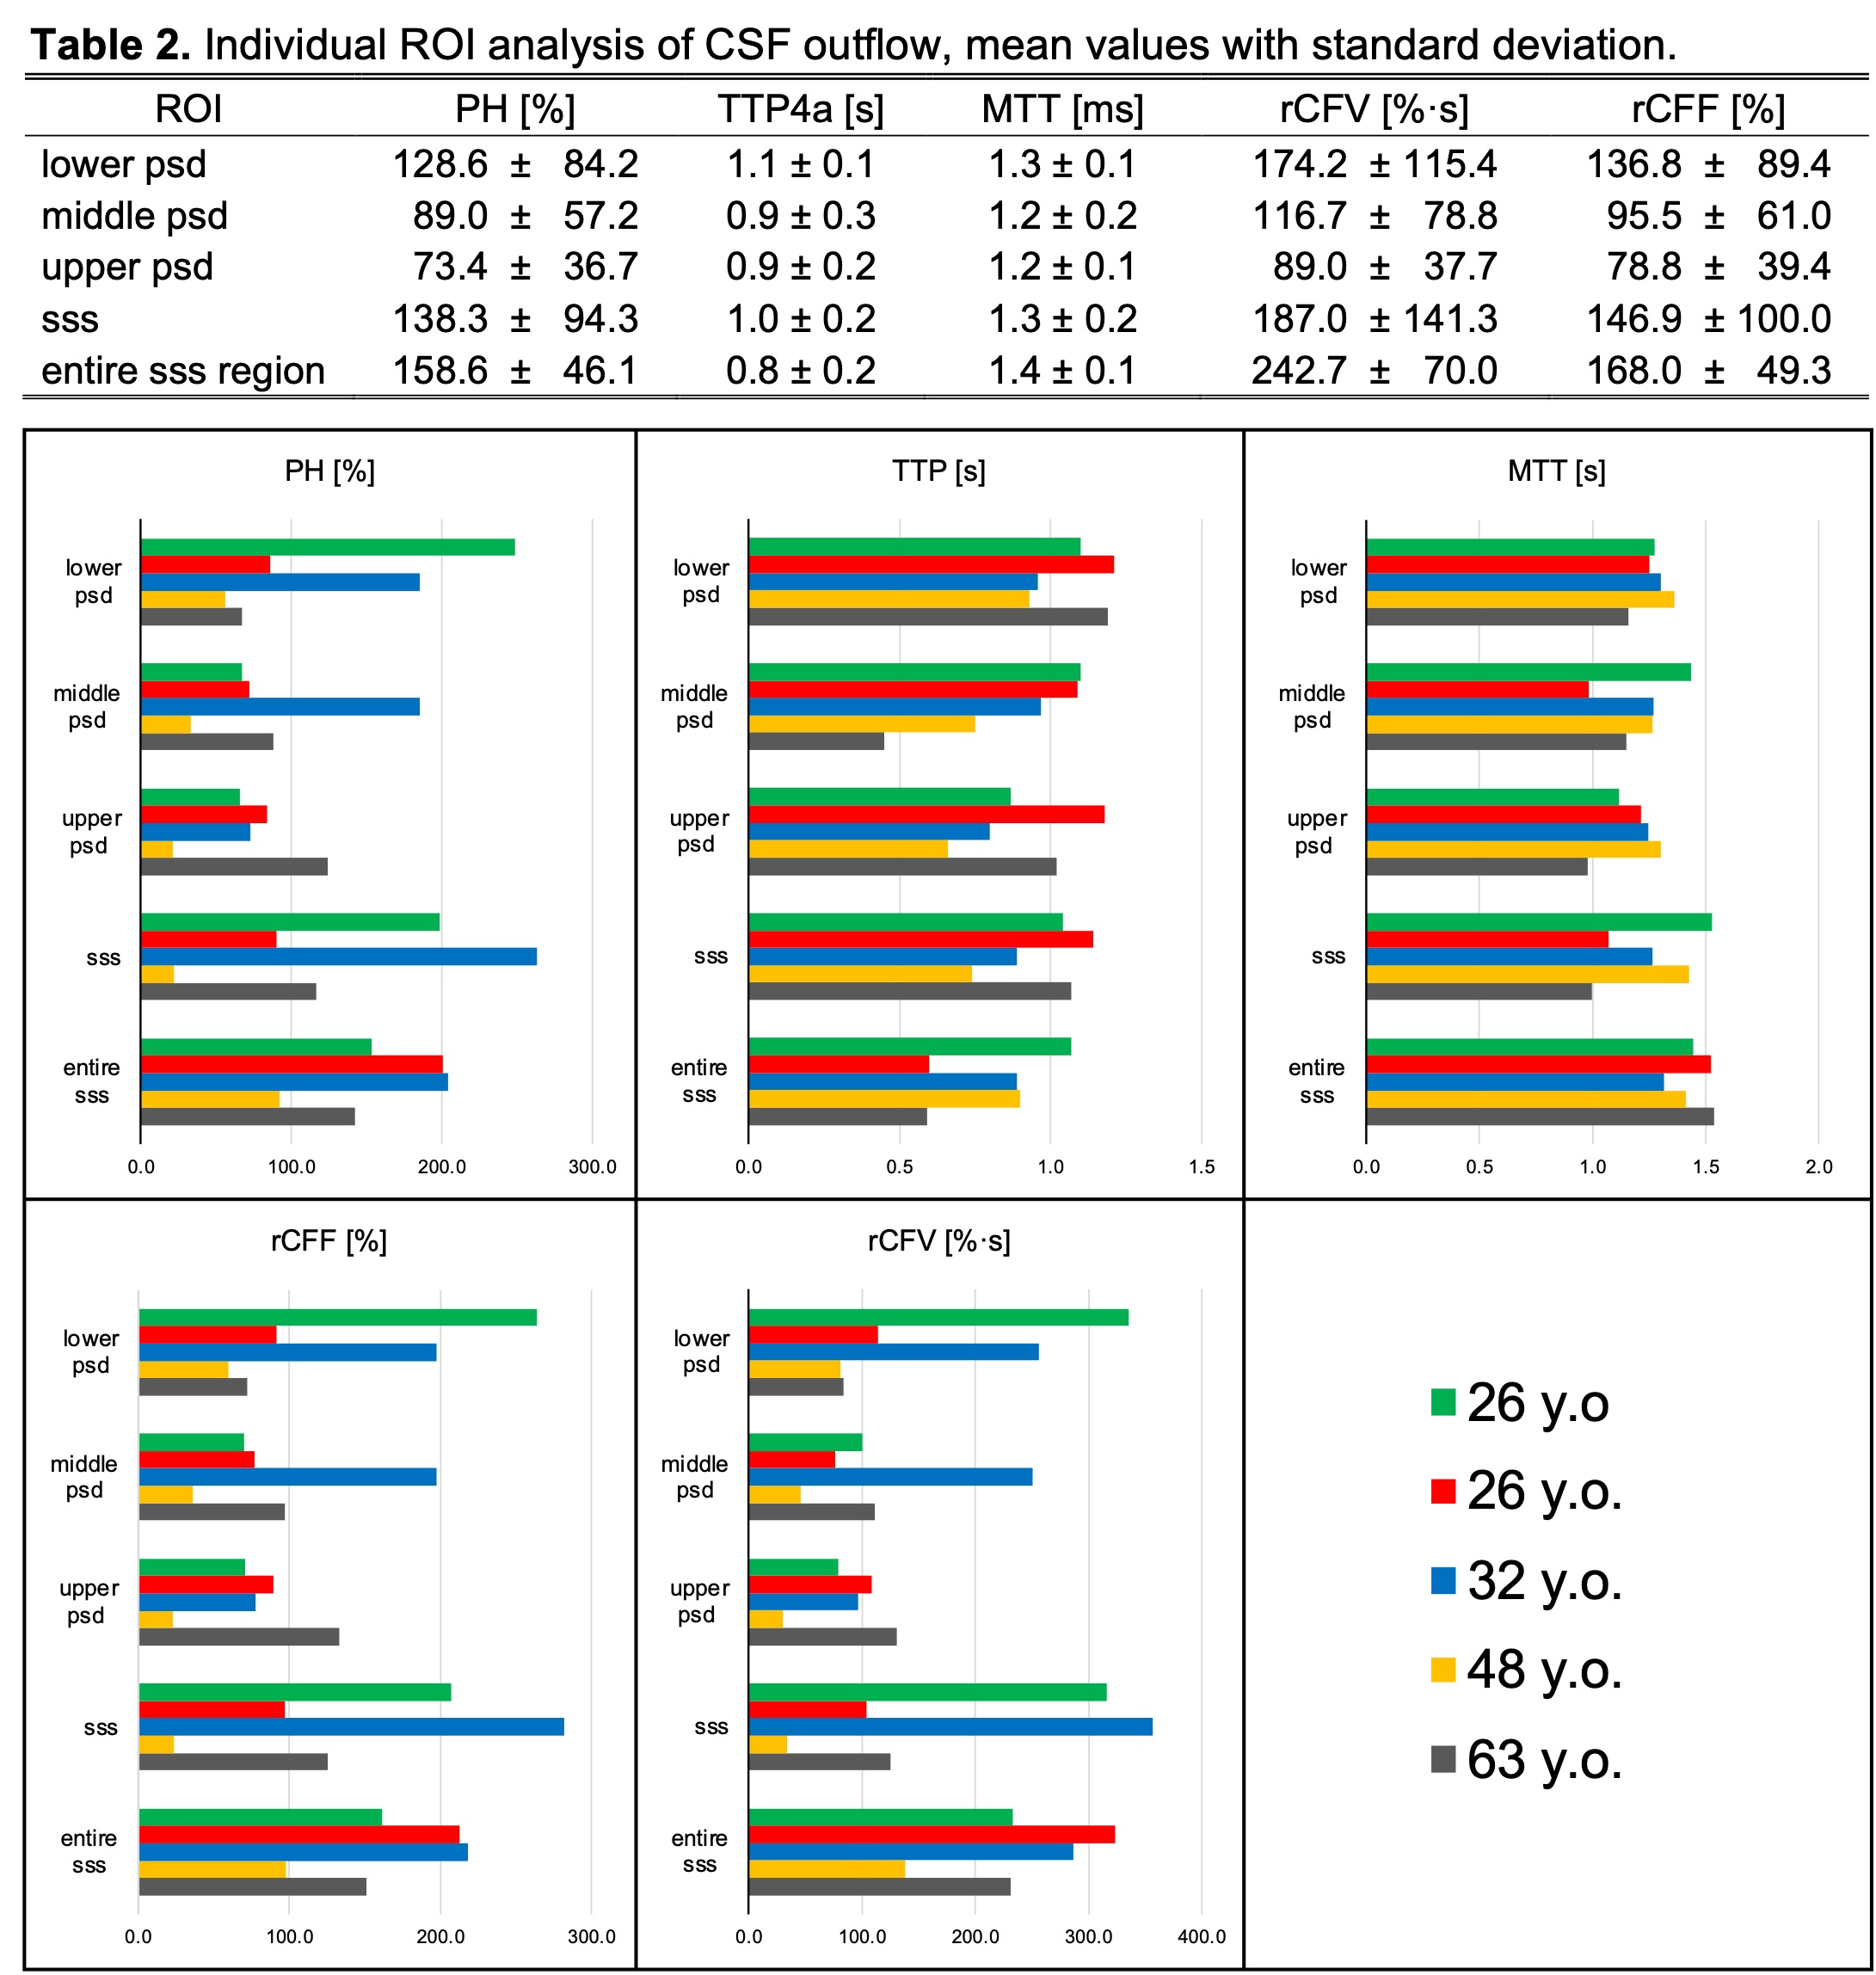
Figure 1a shows the initial echo (TE=5ms) of a multi-echo gradient echo sequence used to compute the susceptibility maps, as given in panel (b). The left and right hippocampal regions of interest are delineated in yellow. Table 1 summarizes the demographic details of the study participants along with the susceptibility values measured for the left and right hippocampus, including their average values. A scatter plot correlating the average susceptibility values for both hippocampi with participant age is provided, featuring a linear fit line with R2 and the corresponding significance p-value. For CSF outflow assessment, Figure 3 illustrates the manually traced regions of interest for a participant. Figure 4 offers a visual summary of the CSF outflow quantification. Colormaps indicating the signal increase ratio throughout the entire superior sagittal sinus region are superimposed on the magnitude image in the top row, whereas the bottom row contrasts the colormaps created by the subtraction method (Tag-on – Tag-off) in absolute units. The signal increase ratio colormaps effectively highlight areas of intensified flow, which, although less pronounced, remain noticeable in the subtraction maps. Lastly, Figure 5 presents average values from the CSF outflow quantification (Table 2) and bar charts per metric, grouped by ROIs for all study participants.Discussion
In this study we observed a strong correlation (R2=0.794, p=0.042) between Quantitative Susceptibility Mapping (QSM) values and patient age, suggesting an increase in iron deposition with age. In contrast, our cerebrospinal fluid (CSF) outflow measurements did not reveal any age-related correlation. The small sample size may have limited our ability to detect a significant effect on CSF outflow. These findings build on our previous research, which suggested that lifestyle factors, such as exercise, could also influence CSF outflow. By integrating these two metrics—QSM and non-contrast CSF outflow measurements—we aim to provide a more comprehensive assessment of neurodegenerative changes associated with aging. This combined multi-parametric approach could provide a clearer insight into the progression of neurodegenerative diseases and how lifestyle changes may influence their course.Conclusions
This pilot study in a small cohort suggests a trend of increased iron deposition with age using QSM, without a clear age-related pattern in CSF outflow. These initial findings support the need for further research with expanded datasets to validate the potential of combined QSM and CSF metrics in understanding neurodegenerative processes.Acknowledgements
This work was supported by an NIH grant RF1AG076692 (M.M.) and a grant by Canon Medical Systems, Japan (35938).References
[1] de Leon MJ., et al., J Nucl Med. Sep;58(9):1471-1476. (2017)
[2] Raven, E. P., et al., JAD, 37(1), 127–136. (2013)
[3] Malis, V., et al., MRMS, 10.2463/mrms.mp.2022-0117. (2022)
[4] Miyazaki, M., et al., MRMS, 10.2463/mrms.mp.2023-0005. (2023)
[5] de Rochefort., et al., MRM, 63(1), 194–206. (2010)
Figures