4202
Volume Measurement of the STN Using High-Spatial-Resolution QSM: A Diagnostic and Disease Monitoring Marker for PSP1Radiology, Samsung Medical Center, Seoul, Korea, Republic of
Synopsis
Keywords: Other Neurodegeneration, Neurodegeneration, Progressive supranuclear palsy
Motivation: The subthalamic nucleus (STN) volumes have not been fully assessed in progressive supranuclear palsy (PSP) and Parkinson’s disease (PD).
Goal(s): Our goal was to explore diagnostic accuracy of STN volumes in PSP and PD.
Approach: We measured the volumes of the STN, brainstem, and superior cerebellar peduncle in PSP and PD patients.
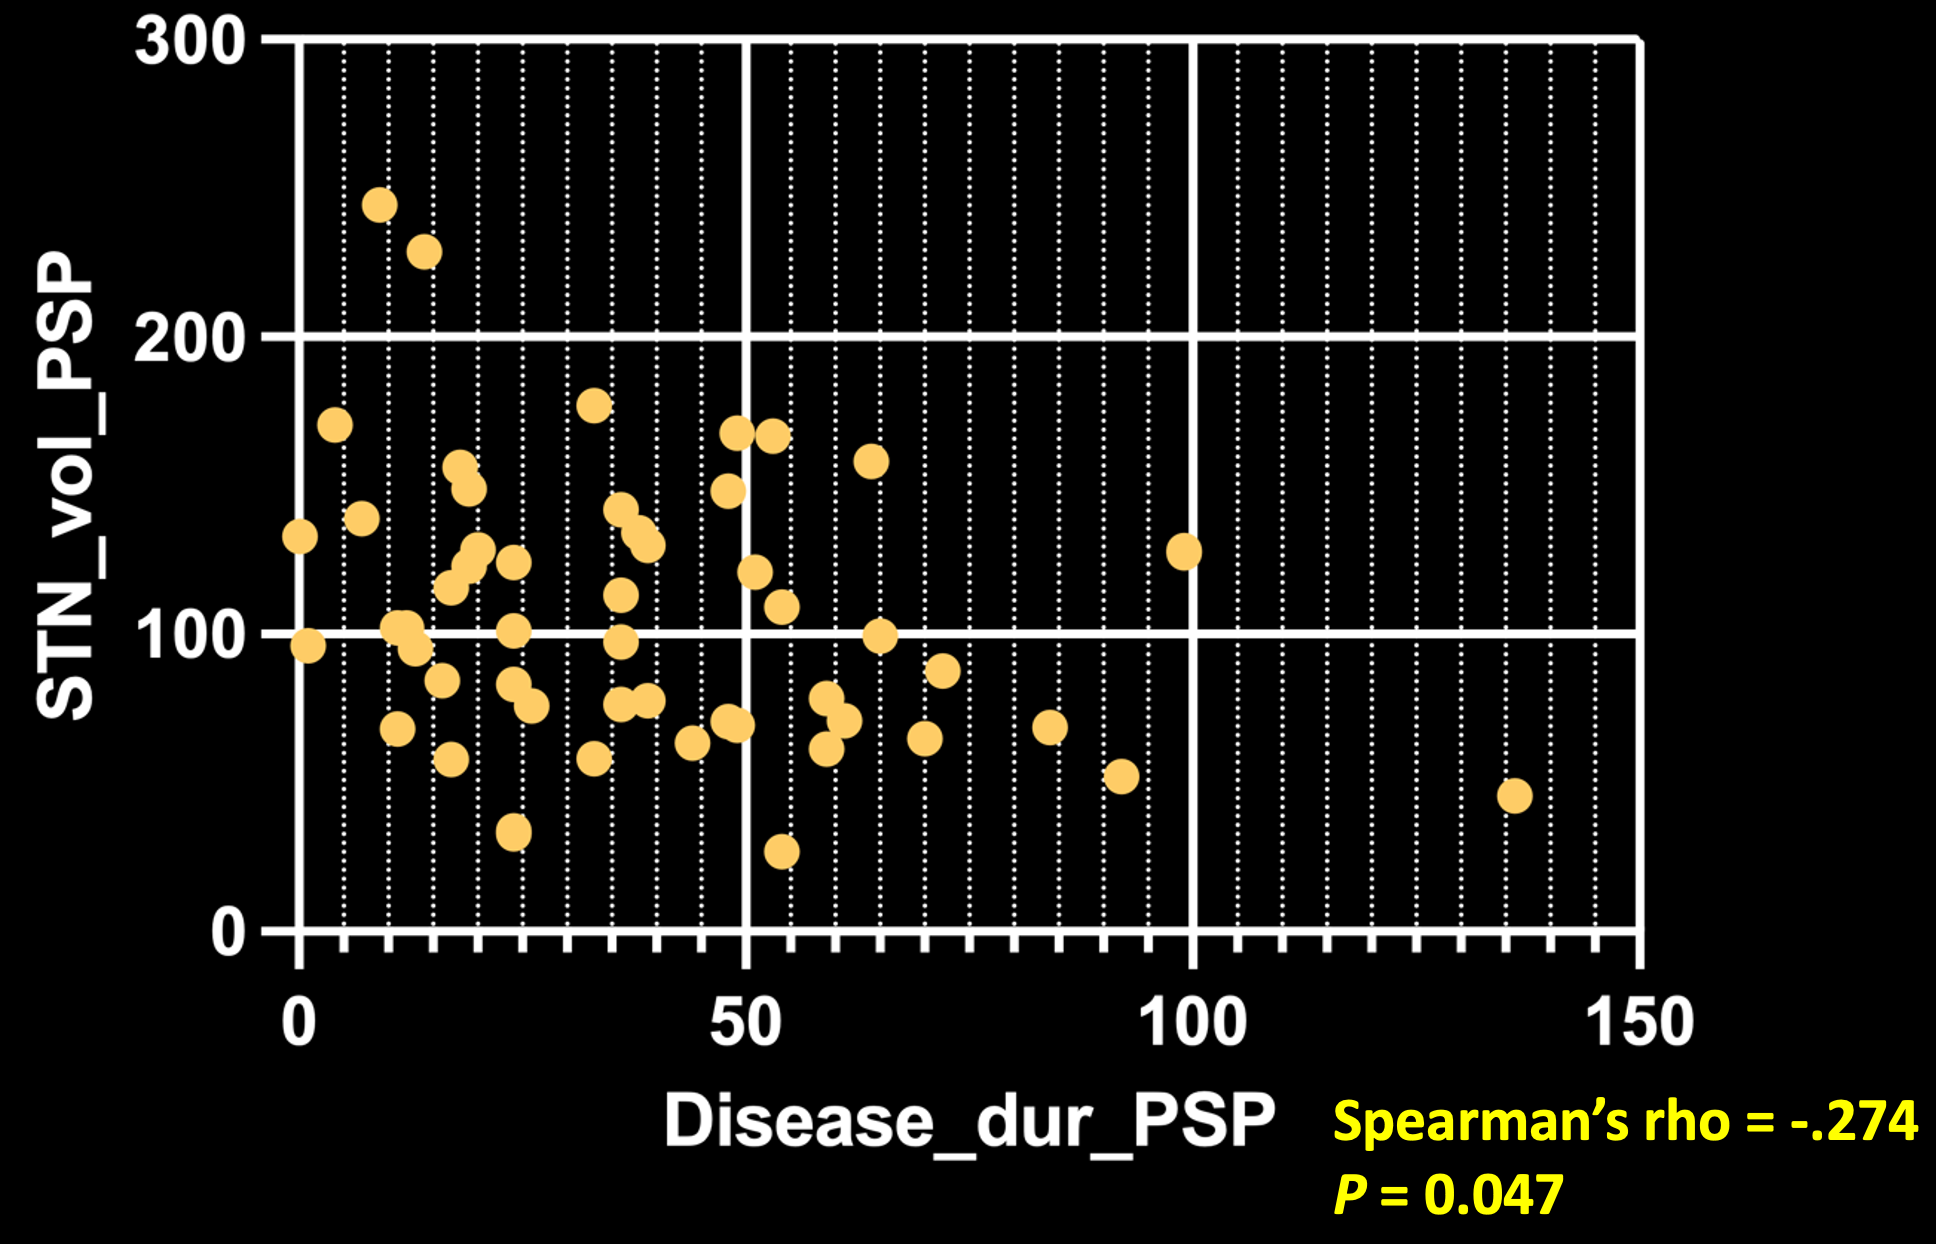
Results: The STN volumes in patients with PSP were significantly reduced compared to those with PD patients. Furthermore, there was a significant negative correlation between the STN volume and disease duration in PSP patients.
Impact: The use of high-spatial-resolution QSM to measure the STN volume has potential as a diagnostic marker for PSP, as well as for monitoring the progression of the disease.
Background and Purpose
Despite the utilization of different MRI markers, distinguishing progressive supranuclear palsy (PSP) from other parkisonian disorders remains difficult. While it has been demonstrated that the subthalamic nucleus (STN) is preferentially affected and shows a reduction in volume in PSP, but its diagnostic performance has not been completely confirmed. The aim of this study is to explore how precise the measurement of the volume of the STN using high-spatial-resolution quantitative susceptibility mapping (QSM) is for diagnosing PSP.Materials and Methods
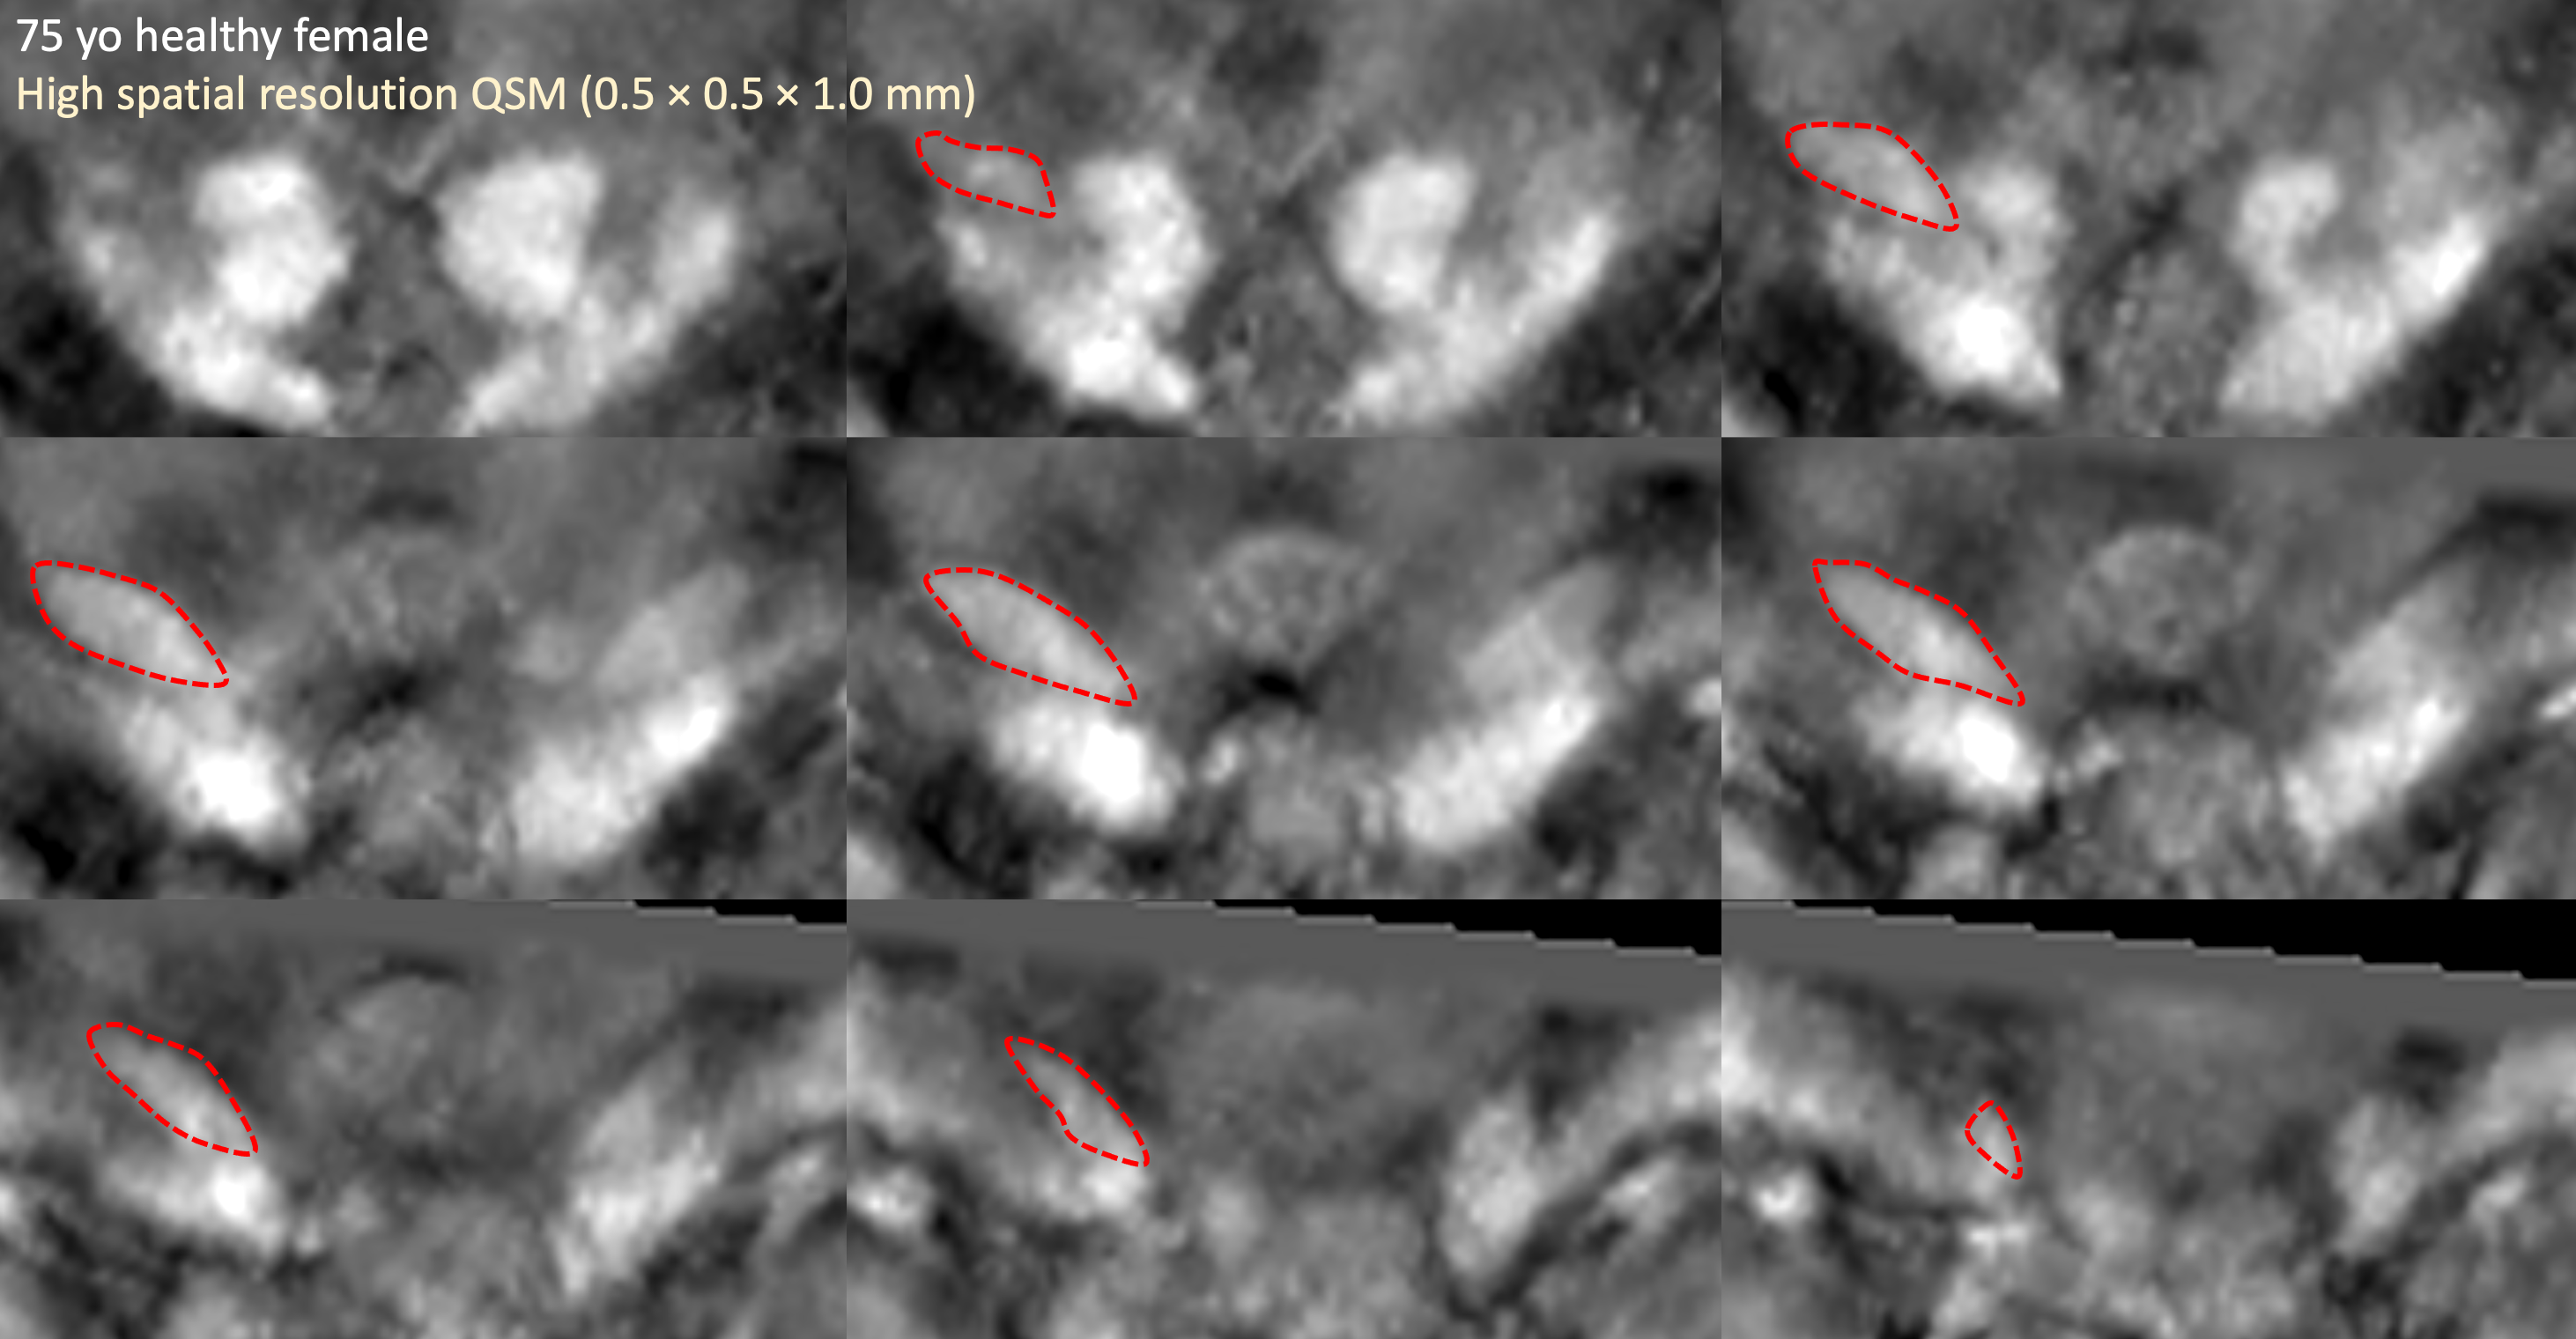
In this retrospective study, we enrolled age-, sex-, and disease duration-matched patients with probable PSP-RS (Richardson syndrome) (n = 53), those with Parkinson’s disease (PD) (n = 53), and age- and sex-matched healthy controls (HC) (n = 49). All participants underwent multi-echo gradient-recalled echo imaging for QSM (0.5 × 0.5 × 1.0 mm3) and 1-mm isovoxel T1-weighted MPRAGE imaging at a 3-T scanner. The volumes of the STN on both sides were separately measured on QSM using 3D Slicer (Fig 1), and the sum was adjusted for intracranial volume for each subject. The normalized STN volumes were compared among patients with PSP, those with PD, and HC. We assessed the diagnostic accuracy using the receiver operating characteristic curve. Additionally, we examined the correlation between disease duration and STN volume in PSP. We deployed a multi-view ensemble model comprising three 2D U-Nets to segment the midbrain, pons, medulla, and superior cerebellar peduncle (SCP). We further constructed a machine learning model with the support vector machine (SVM) algorithm to classify Parkinsonian syndromes (PD vs PSP) based on the volumetric measurements acquired from the segmentation model. The diagnostic performance for differentiating PD from PSP was compared between volumetric measurements of the STN and volumetric assessment of the brainstem and SCP based on deep learning.Results
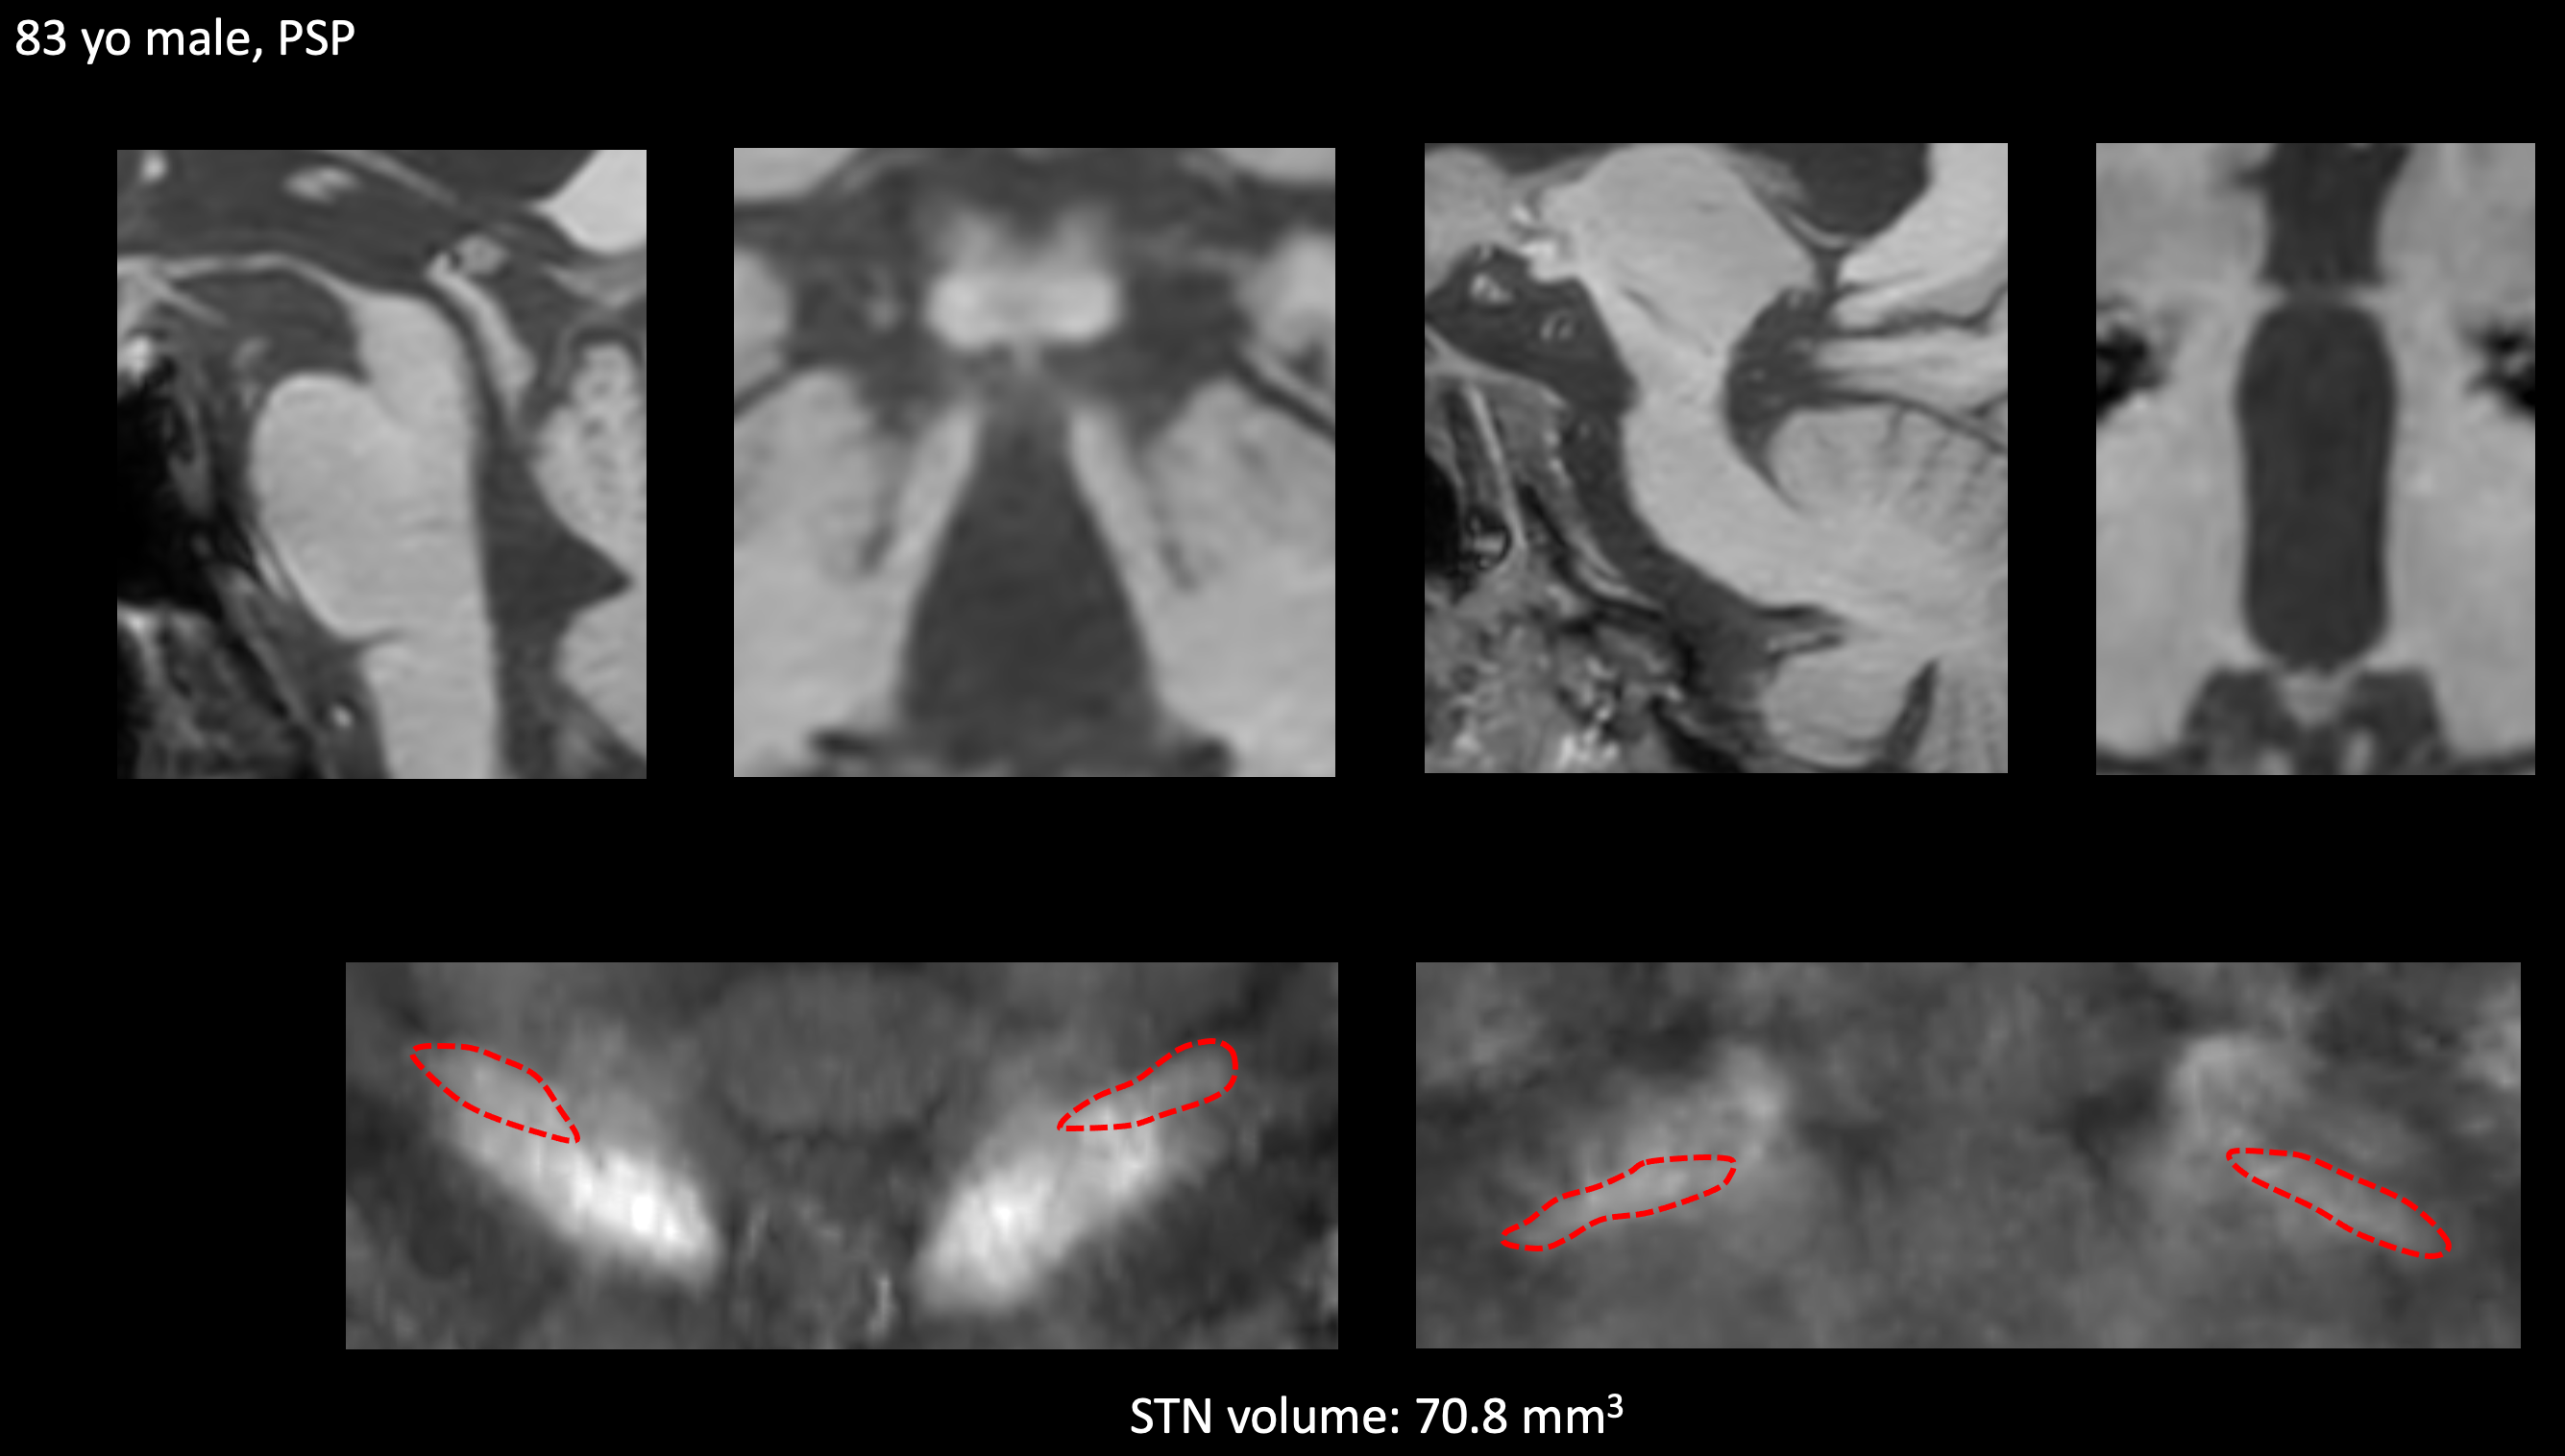
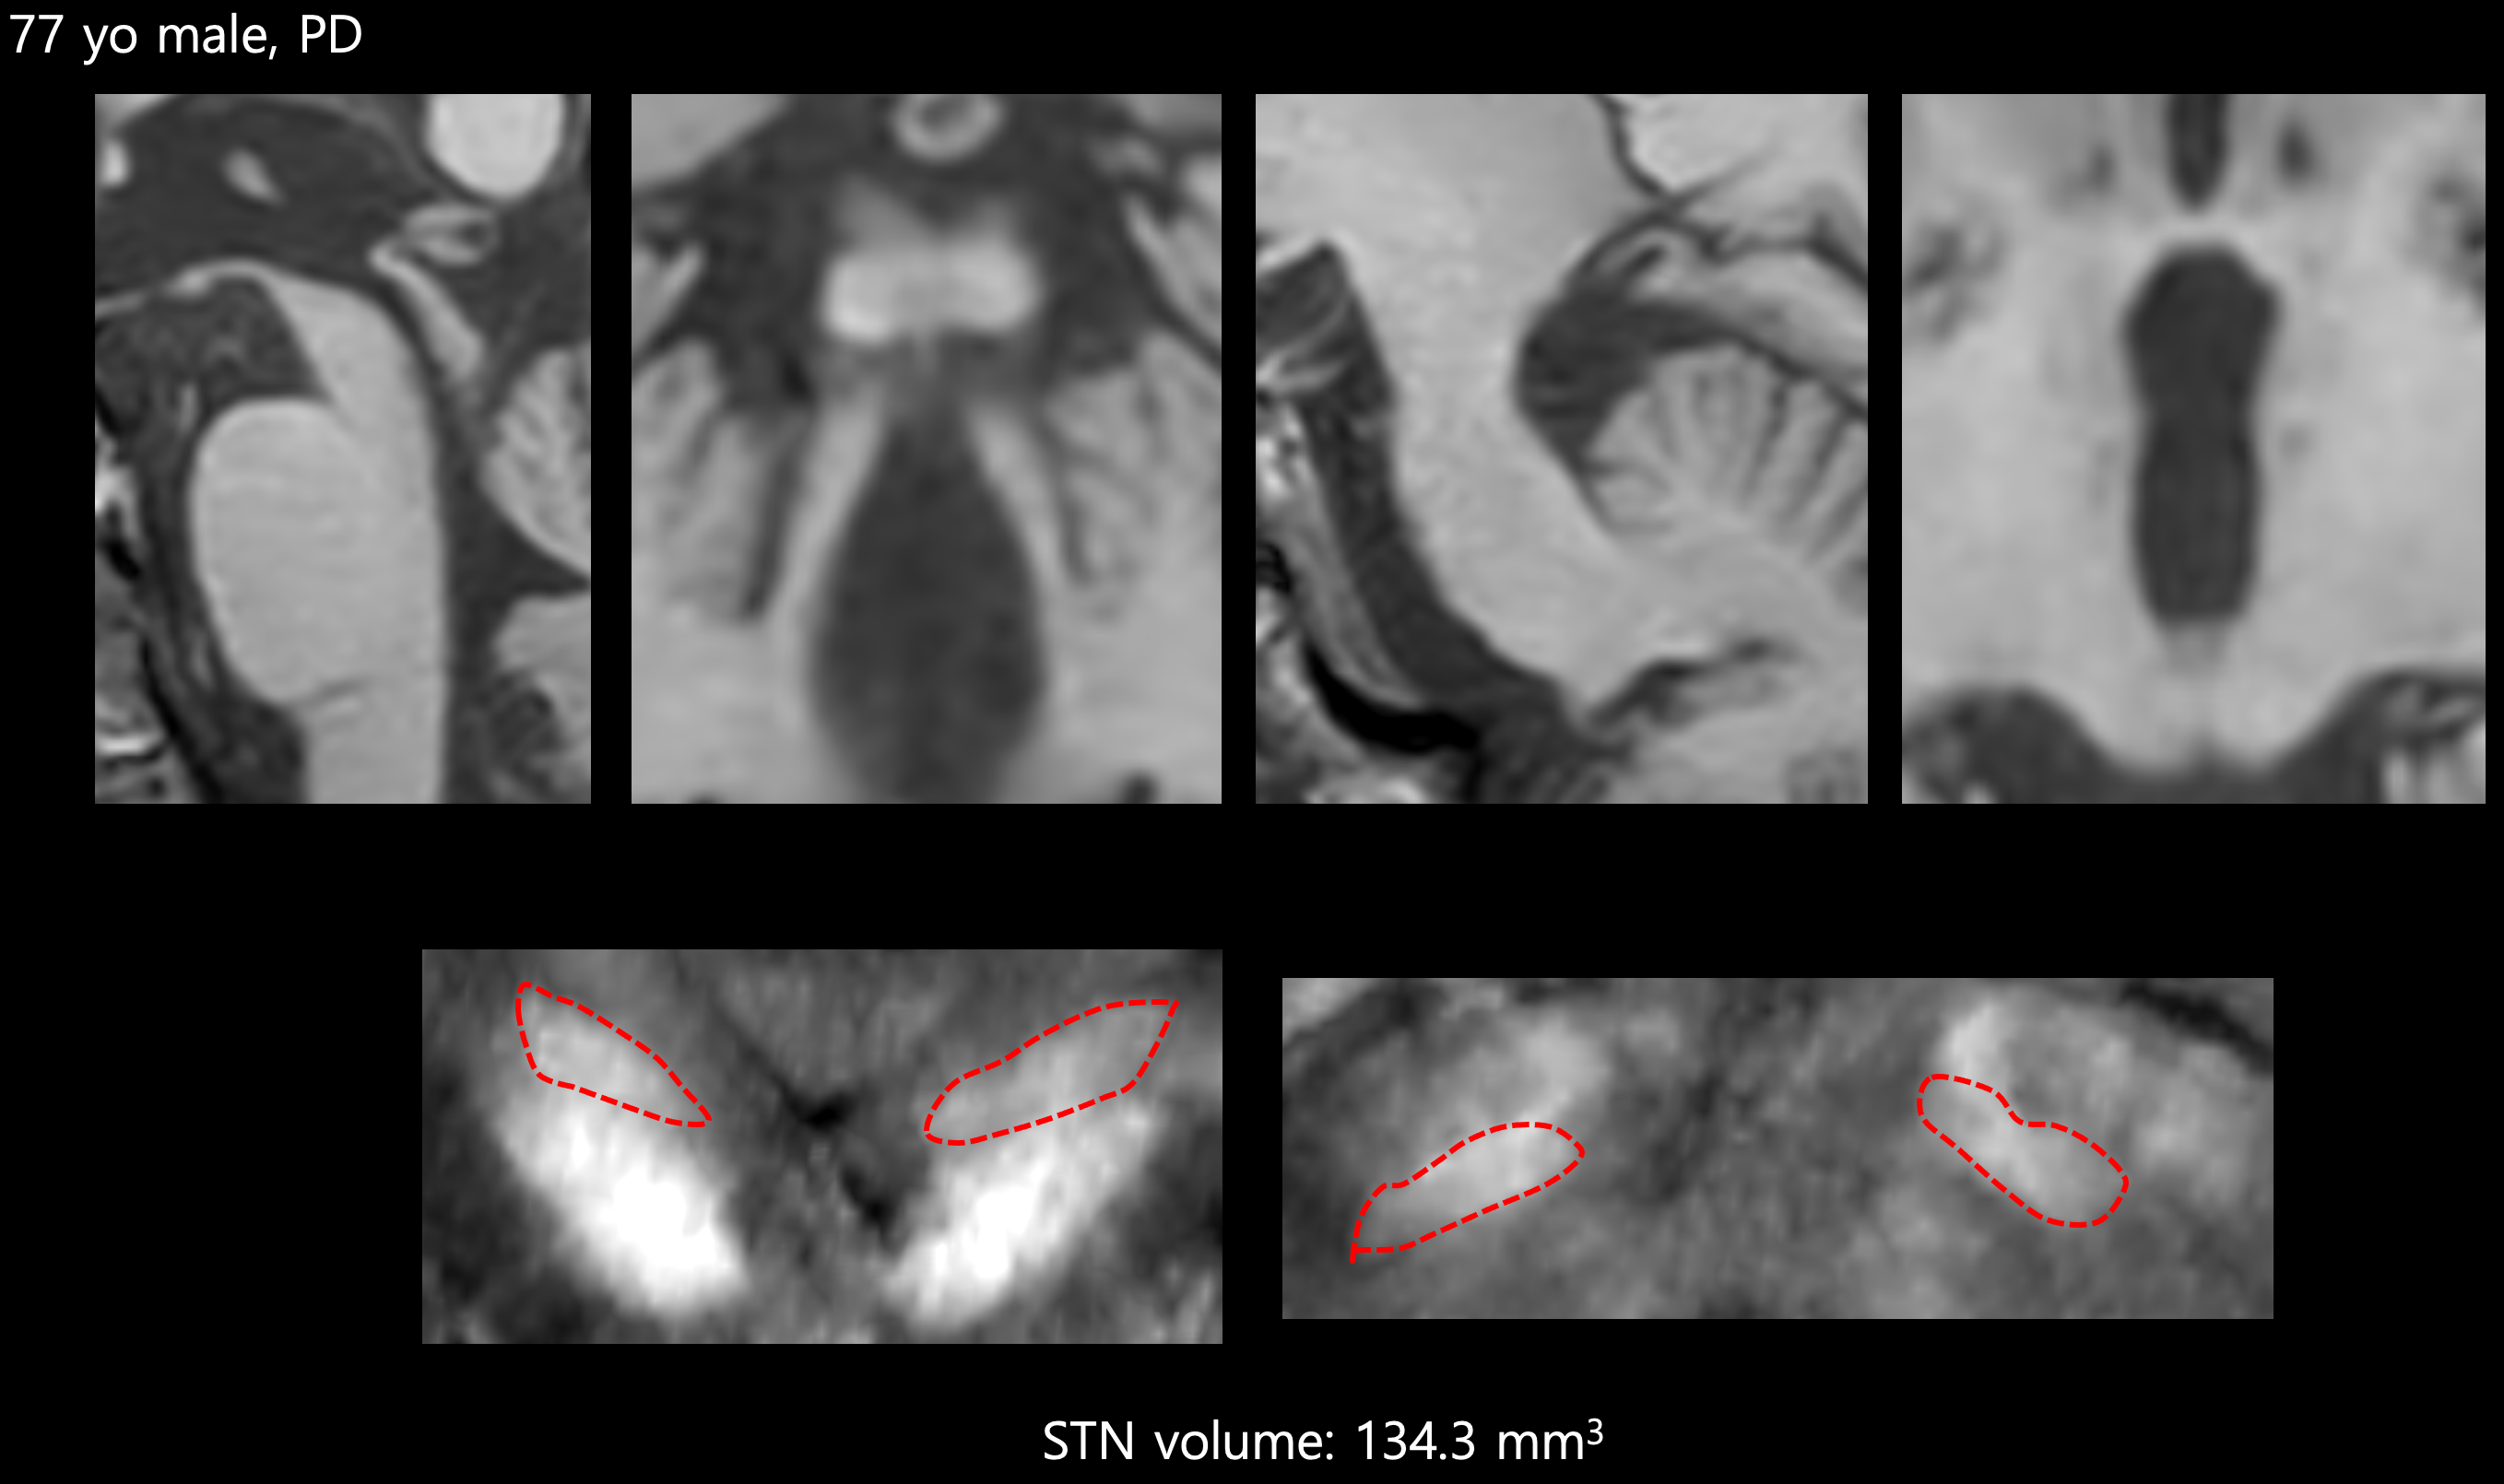
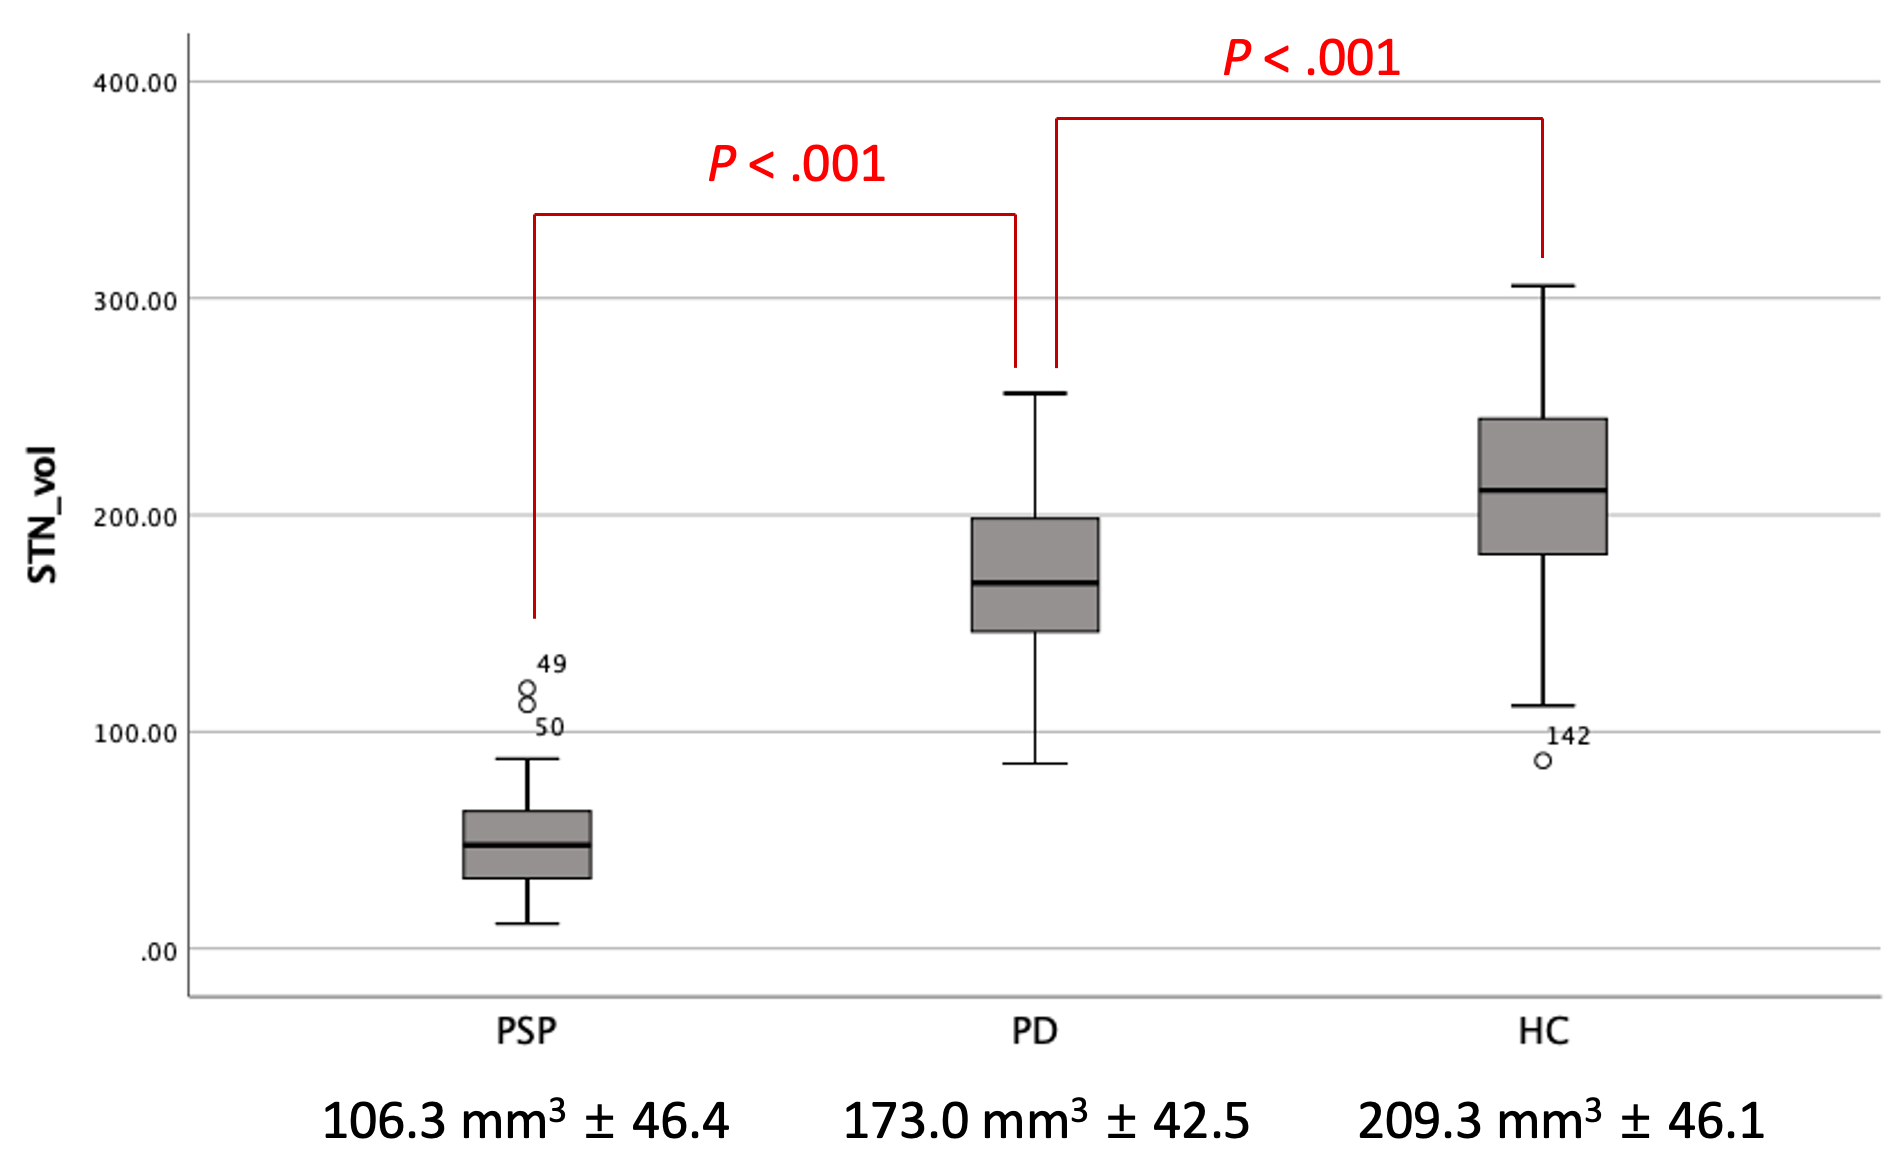
The STN volumes (mean ± SD) of the PSP patients (106.3 mm3 ± 46.4) (Fig 2A) were significantly smaller than those of PD patients (173.0 mm3 ± 42.5) (Fig 2B) and controls (209.3 mm3 ± 46.1) (P < .001). The STN volumes of PD patients were also significantly lower than those of HC (P < .001) (Fig 3). The diagnostic sensitivity and specificity of the STN volume measurement using QSM to discriminate PSP from PD were 77.4% and 83.0%, respectively (areas under the curve, 0.864 [95% CI, 0.784 – 0.923]). There was a significant negative correlation between STN volume and disease duration in PSP patients (P = .04) (Fig 4). The diagnostic sensitivity and specificity of the STN volumes and volumetry of the brainstem and SCP were 75.5% and 83.2%, and 50.9% and 84.9%, respectively, showing significantly higher performance of STN volume measurements over volumetry of the brainstem and SCP (P = .02).Conclusion
The volume of the STN in patients with PSP was significantly reduced compared to those with PD patients and HC. Furthermore, there was a significant negative correlation between the STN volume and disease duration in PSP patients.Acknowledgements
This study was supported by the National Research Foundation of Korea (NRF) grants funded by the Korea government (MSIT) (No. 2022R1F1A1073551)References
Brain 2007;130(Pt 6):1566-1576
J Neuropathol Exp Neurol 1997;56(2):132-142
Sci Rep 2020;10(1):8785
Mov Disord 2020;35(1):161-170
Figures