4200
Combining brain MRI and MRS, neuropsychological testing and brain-derived cell-free DNA level for the early detection of Alzheimer’s Disease1IRCCS Istituto delle Scienze Neurologiche di Bologna, Bologna, Italy, 2Department of Medicine and Surgery, University of Parma, Parma, Italy, 3Department of Life Quality Studies, University of Bologna, Bologna, Italy, 4Department of Biomedical and Neuromotor Sciences, University of Bologna, Bologna, Italy, 5Department of Medical and Surgical Sciences, University of Bologna, Bologna, Italy
Synopsis
Keywords: Alzheimer's Disease, Brain, Morphometry; Spectroscopy; cell-free DNA; Biomarkers;
Motivation: There is a lack of biomarkers in elderly people with ongoing subjective or clinical cognitive decline that indicate evolution to Alzheimer’s disease, necessary for the timely identification of candidate for pharmacological treatment or cognitive rehabilitation.
Goal(s): Our goal was to determine whether combining MR, neuropsychological and biological data could provide robust biomarkers for this purpose.
Approach: We evaluated patients with subjective cognitive decline, mild cognitive impairment, Alzheimer’s disease and healthy individuals, using a multimodal approach.
Results: We identified candidate biomarkers of condition worsening at early stages of the disease among alterations possibly explained by ongoing neurodegeneration.
Impact: Our results support the combined investigation of imaging, biological and neuropsychological data to detect patients in the early stages of the Alzheimer’s disease spectrum, who may undergo active neurodegeneration and worsening of the condition.
Introduction
Although cognitive decline in Alzheimer’s disease (AD) spectrum is associated with degenerative neurobiological features, reliable markers for the early detection of AD are not fully established1. We aimed to track ongoing brain neurodegeneration in the AD spectrum by combining brain MRI features, neuropsychological evaluations and plasmatic (liquid biopsy) brain-derived circulating cell-free DNA (b-cfDNA) data2.Methods
25 healthy controls (CTR, 13 F, 66.6±8.8y), 18 subjective cognitive decline (DCS, 9 F, 70.6±8.7y), 16 mild cognitive impairment (MCI, 12 F, 72.4±6.8y), and 21 AD (15 F, 71.4±8.9y) patients were recruited. All subjects underwent the following standardized protocol: extensive neuropsychological evaluation; blood-sample test for b-cfDNA level estimation via a targeted bisulfite sequencing assay3, based on quantification of DNA methylation; a MR protocol on 3T Siemens MAGNETOM Skyra scanner, including volumetric MPRAGE T1-weighted sequence (1-mm isotropic resolution) and single-voxel (8mL) 1H PRESS spectroscopy sequence (TR/TE=2000/30ms, 128 averages) localized in the posterior cingulate cortex4. Participants were further classified as b-cfDNA-positive/negative based on their b-cfDNA level, by thresholding at the median CTR value. MR features were additionally compared between them.FreeSurfer 5.3 was used to extract the volume, area and cortical thickness of 68 cortical and 14 subcortical regions according to the Destrieux atlas5 from T1 images. Spectroscopic analysis was performed with LCModel v.6.3. Metabolites were quantified relatively to creatine (Cr) or myo-Inositol (mI) as internal reference.
Normality of the data distributions was assessed using the Shapiro-Wilk test. ANCOVA was used to test for neuropsychological (covariates: age, education) and morphometric (covariates: age, total intracranial volume) differences across groups; Kruskal-Wallis test was used to compare b-cfDNA and metabolite levels. Pearson’s correlation was calculated between morphometric, spectroscopic, neuropsychological, and b-cfDNA data. Statistical significance was set at p<0.05 after Bonferroni correction for multiple comparisons.
Results
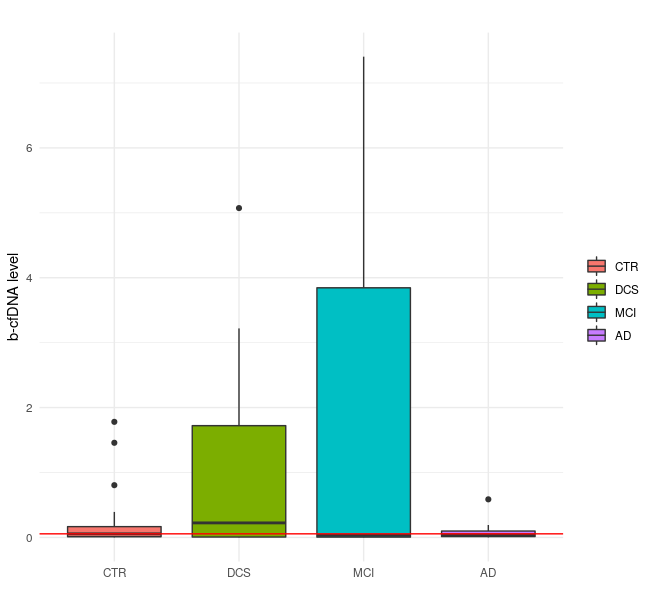
AD patients obtained worse scores than CTR and DCS subjects in all neuropsychological domains (adjusted-p<0.0001) and in Stroop Test with respect to MCI (adjusted-p<0.05). The latter performed worse than CTR in Stroop Test (adjusted-p<0.01).The estimated b-cfDNA level per group is reported in Figure 1. Although no significant differences among groups were found, a trend of higher values in DCS and MCI with respect to CTR and AD was observed.
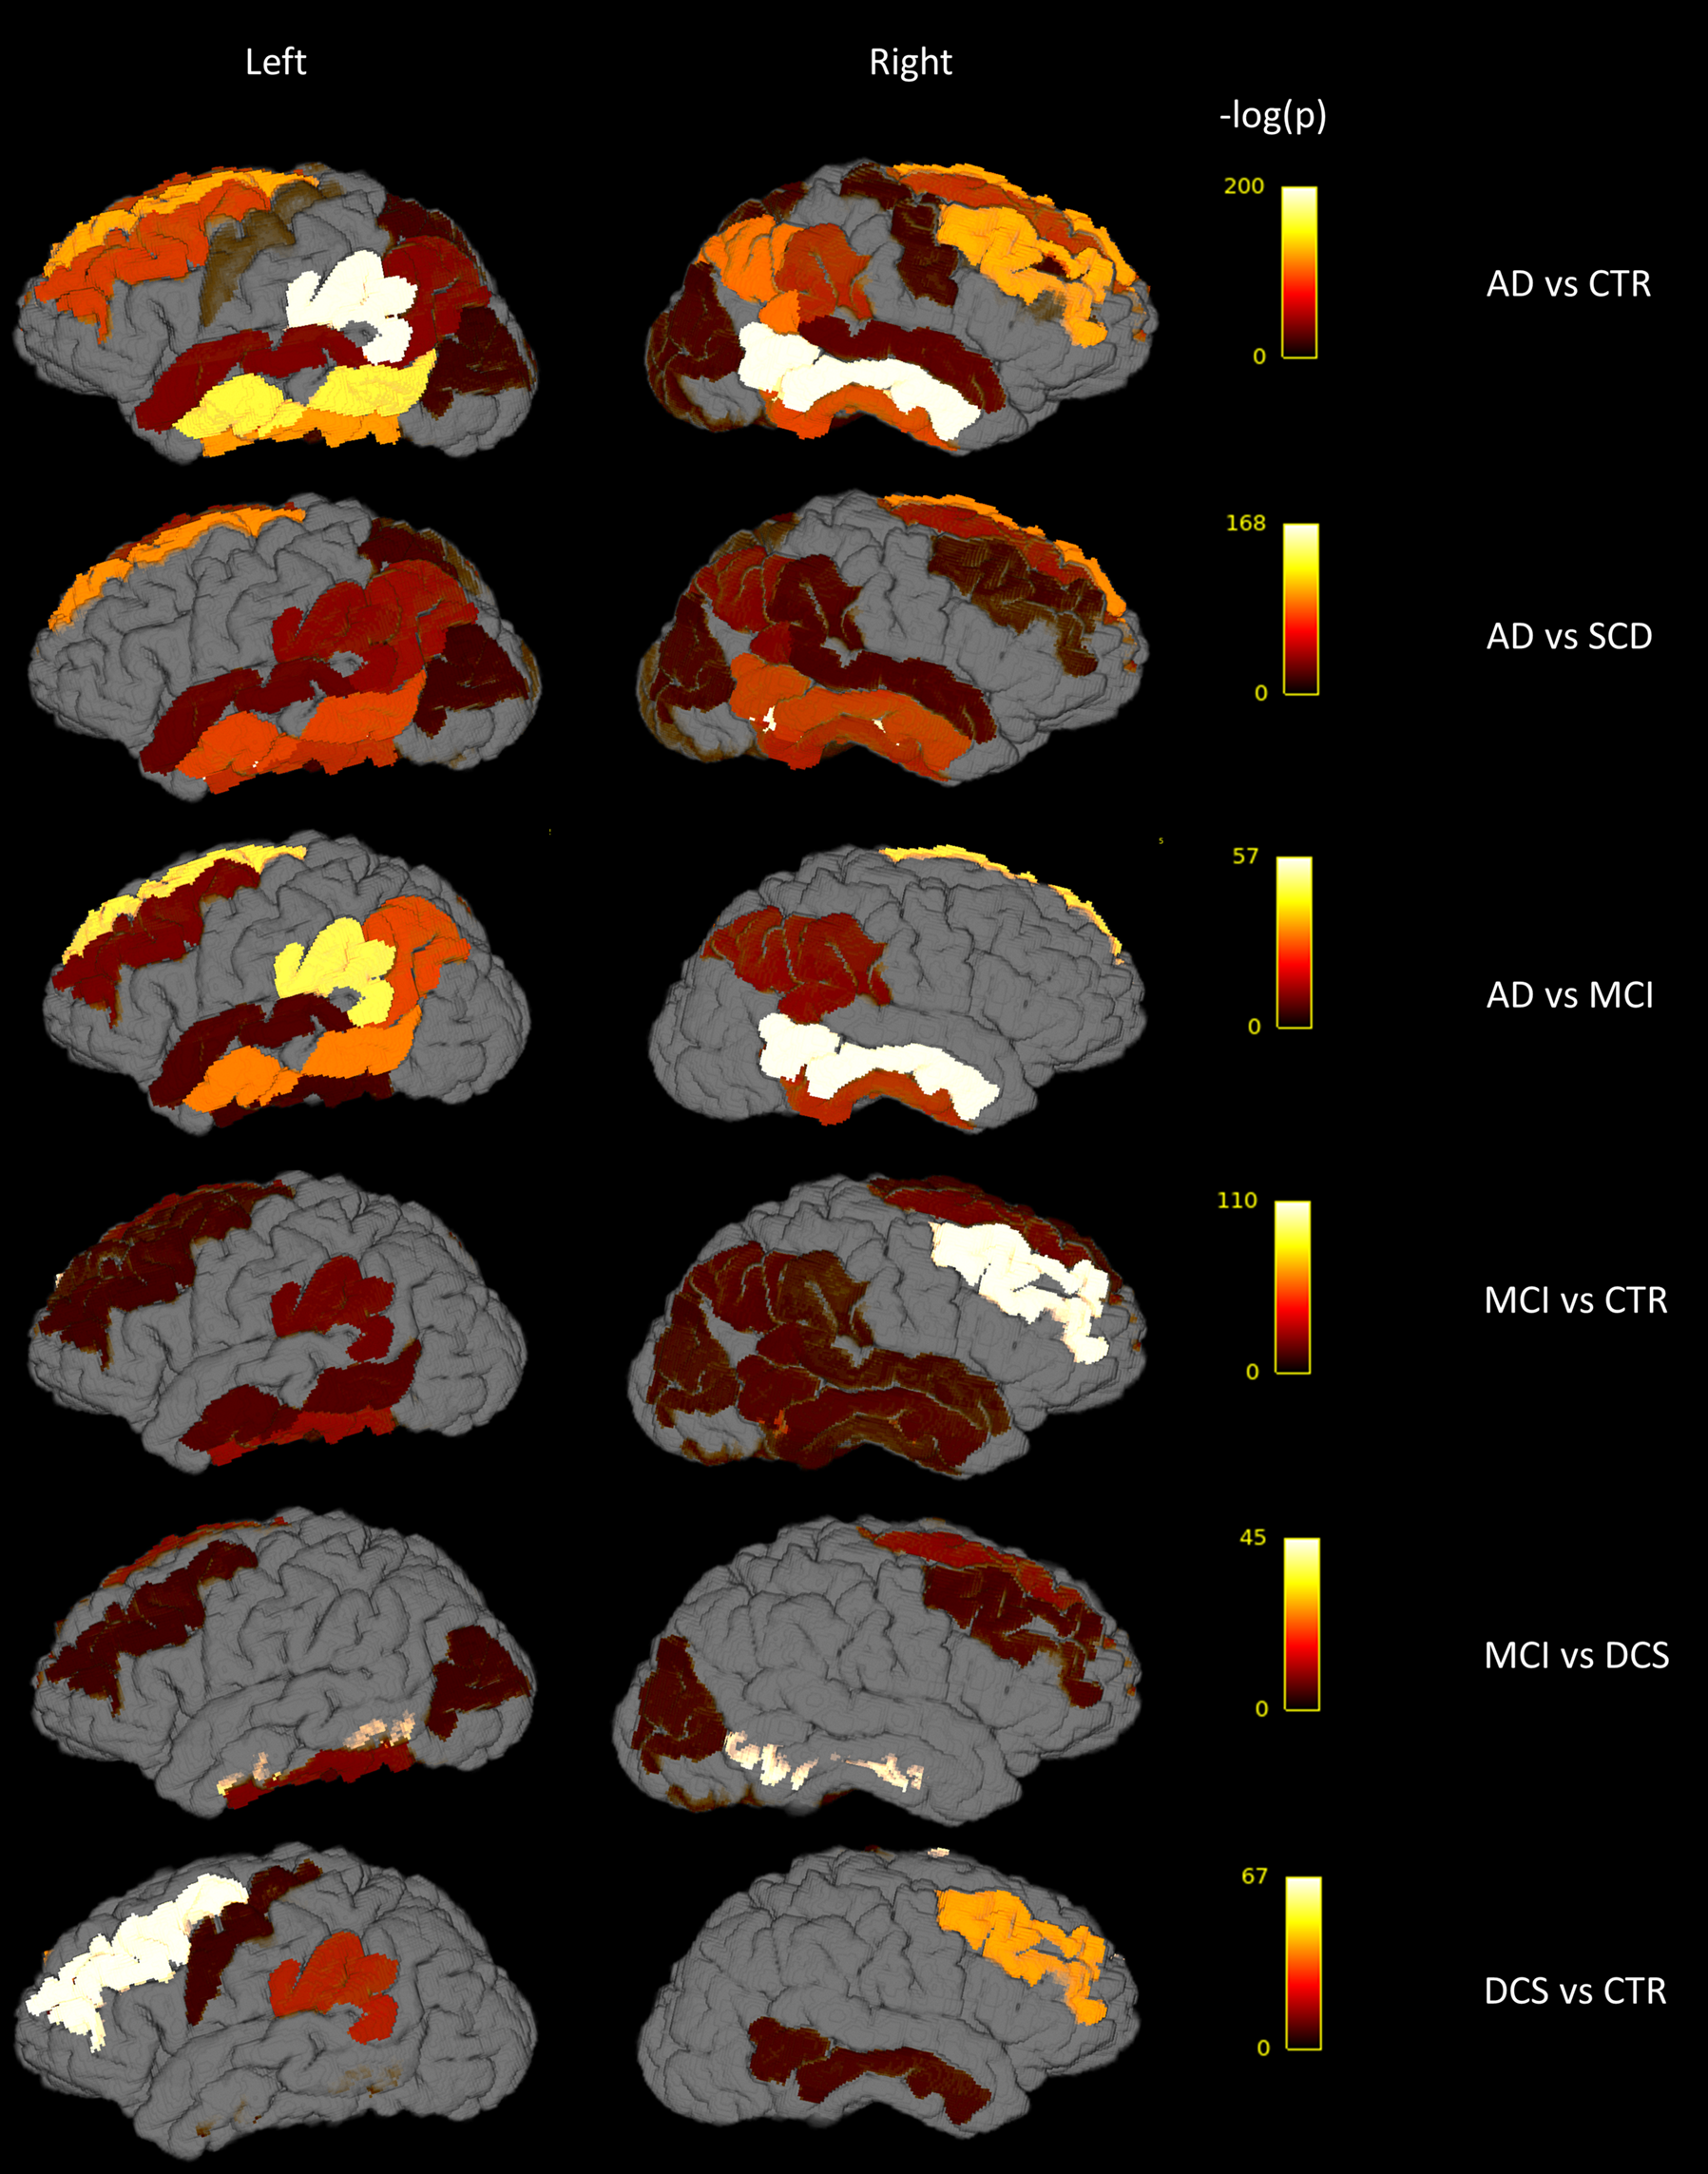
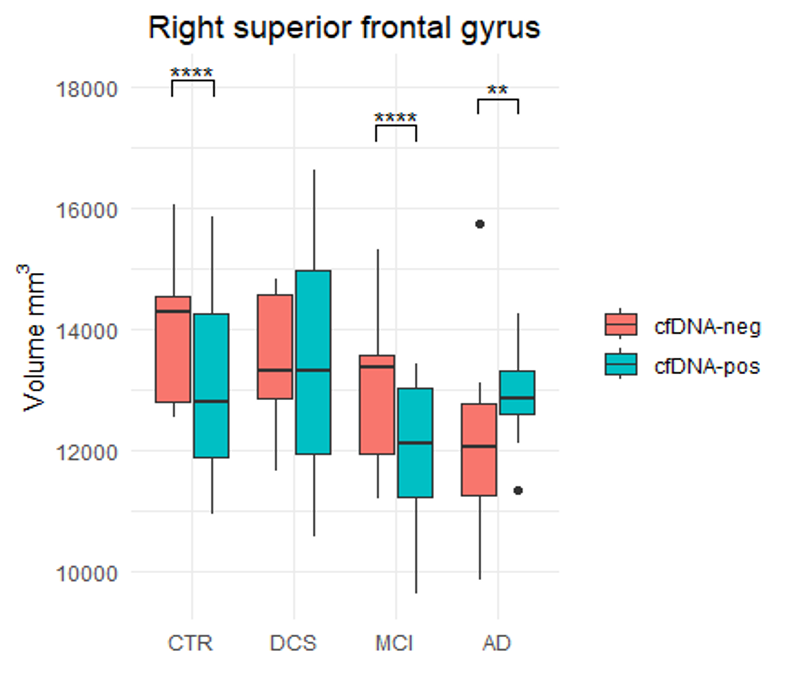
Several regions in temporal, frontal and inferior parietal lobes and subcortical nuclei showed progressively lower morphometric features going from CTR to the AD spectrum (adjusted-p<0.0001). Volumetric results are reported in Figure 2. Figure 3 shows that the volume of the right superior frontal gyrus was significantly greater (adjusted-p<0.01) in b-cfDNA-negative than b-cfDNA-positive subjects in the CTR and MCI subgroup, whereas smaller in the AD subgroup. Similar trends were observed in other regions in the frontal and temporal lobes.
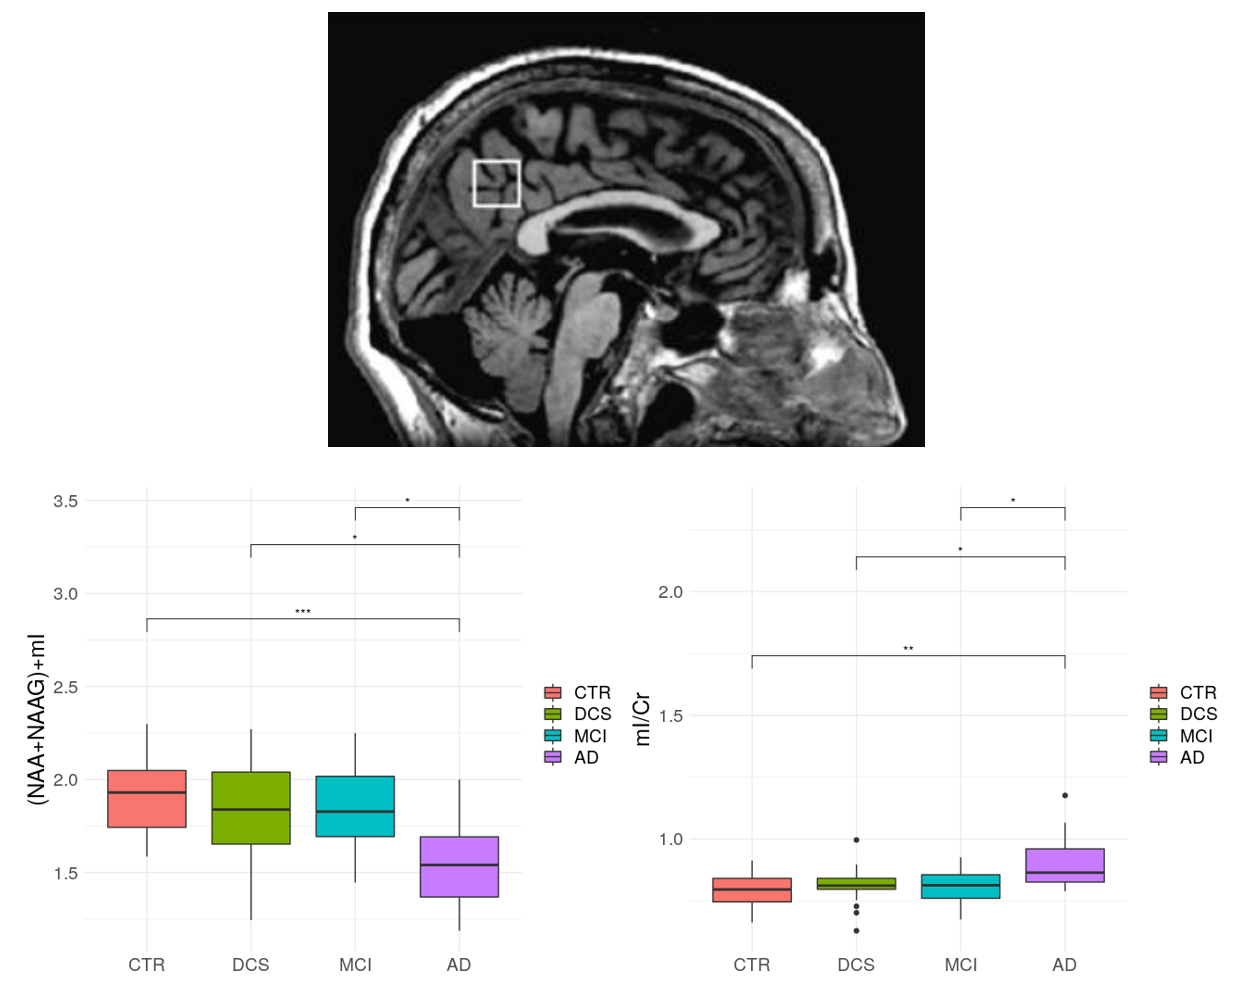
As shown in Figure 4, N-acetyl-aspartate+N-acetyl-aspartyl-glutamate (NAA+NAAG)/mI ratio in AD was lower compared to the other groups (adjusted-p<0.02), whereas mI/Cr content was higher (adjusted-p<0.03). No significant differences were found between MCI, DCS and CTR.
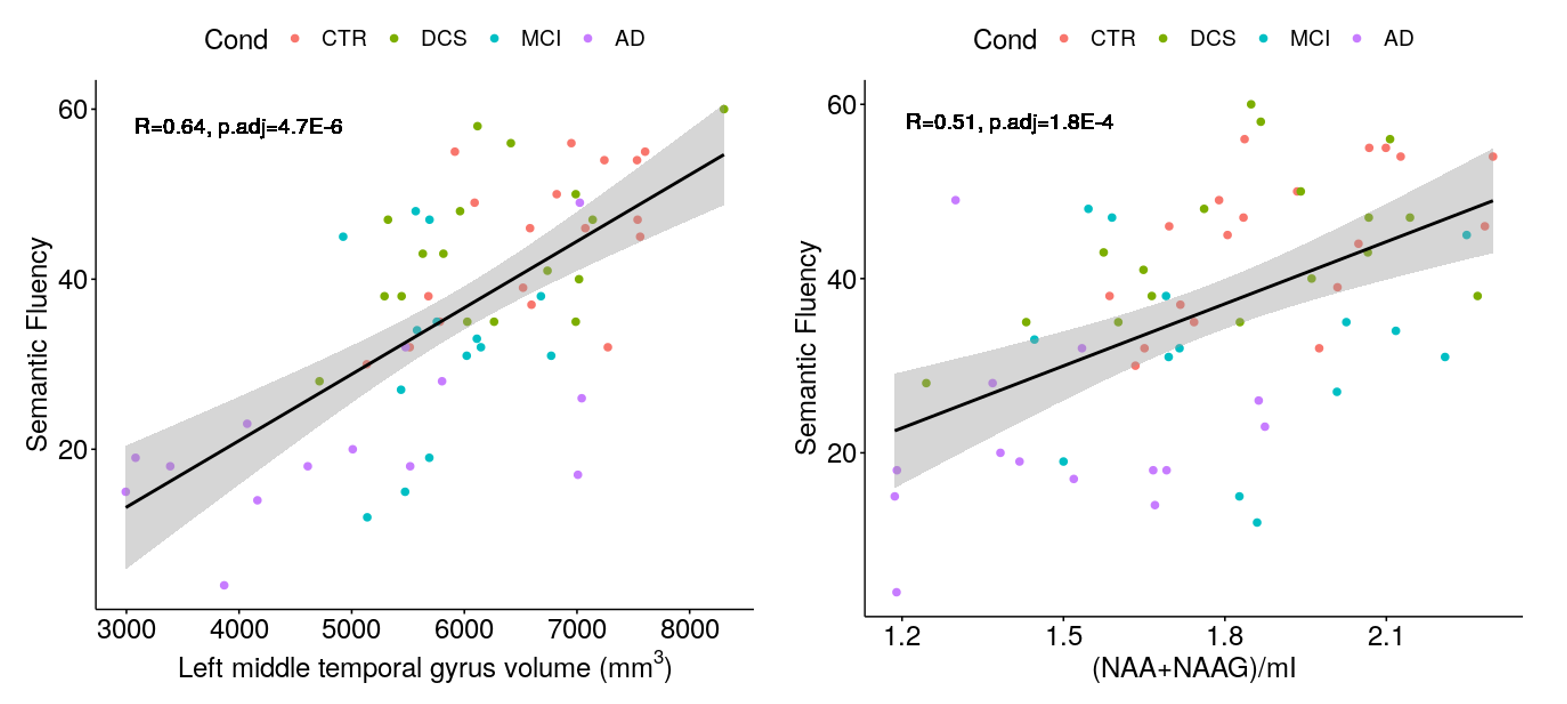
Positive correlations were detected between morphometric features in temporal and inferior parietal regions and metabolites content with each neuropsychological domain across the full sample, see Figure 5 as an example. b-cfDNA values correlated with semantic fluency scores in AD (R=0.89, adjusted-p=0.038) and with Stroop test in CTR (R=0.82, adjusted-p=0.007).
Discussion
Results of MR morphometry and spectroscopy reproduced previous findings on structural and metabolic differences in the AD spectrum4,6. Significant morphometric alterations, which may be prodromal to worsening of the condition, were also found in DCS compared to CTR. MRS alterations only emerged in severe conditions.Despite not being statistically significant, the pattern of b-cfDNA alterations is consistent with a higher release of b-cfDNA in the initial phases of neurodegeneration, supporting previous data that suggest the b-cfDNA increase is more pronounced in the early stages of the disease7, at the beginning of the cognitive decline but prior to the formation of β-amyloid plaques. Different directions of morphometric alterations in b-cfDNA-positive/negative patients may be explained accordingly: as the lower cortical volume is associated with higher clinical severity, such result in CTR and MCI could suggest that active neurodegeneration (possibly occurring also in elderly CTR) is associated with the release of b-cfDNA in plasma; in AD whose neurodegeneration process has already occurred, the volume in b-cfDNA-negative patients is lower than b-cfDNA-positive cases.
Conclusions
The combination of MRI, biological, neuropsychological and clinical data emerged as promising for the characterization of different neurodegeneration stages in the AD spectrum, and especially for the detection of prodromal cases leading to AD. Further investigation with larger samples, diffusion and functional MRI data and region-specific b-cfDNA estimation are needed to identify selective biomarkers for the early identification of cases evolving to AD, integrating longitudinal data.Acknowledgements
This study is part of the Radiogenomics for Early detection of Alzheimer's Disease (READy) project, which is supported by the Airalzh-Grants-for-Young-Researchers 2020.References
1. Guzman-Martinez L, Maccioni RB, Farías GA, Fuentes P, Navarrete LP. Biomarkers for Alzheimer’s Disease. CAR. 2019;16(6):518-528. doi:10.2174/1567205016666190517121140
2. Gaitsch H, Franklin RJM, Reich DS. Cell-free DNA-based liquid biopsies in neurology. Brain. 2023;146(5):1758-1774. doi:10.1093/brain/awac438
3. Ravaioli F, Zampieri M, Morandi L, et al. DNA Methylation Analysis of Ribosomal DNA in Adults With Down Syndrome. Front Genet. 2022;13:792165. doi:10.3389/fgene.2022.792165
4. Mitolo M, Stanzani-Maserati M, Capellari S, et al. Predicting conversion from mild cognitive impairment to Alzheimer’s disease using brain 1H-MRS and volumetric changes: A two- year retrospective follow-up study. NeuroImage: Clinical. 2019;23:101843. doi:10.1016/j.nicl.2019.101843
5. Destrieux C, Fischl B, Dale A, Halgren E. Automatic parcellation of human cortical gyri and sulci using standard anatomical nomenclature. NeuroImage. 2010;53(1):1-15. doi:10.1016/j.neuroimage.2010.06.010
6. Pini L, Pievani M, Bocchetta M, et al. Brain atrophy in Alzheimer’s Disease and aging. Ageing Research Reviews. 2016;30:25-48. doi:10.1016/j.arr.2016.01.002
7. Pai MC, Kuo YM, Wang IF, Chiang PM, Tsai KJ. The Role of Methylated Circulating Nucleic Acids as a Potential Biomarker in Alzheimer’s Disease. Mol Neurobiol. 2019;56(4):2440-2449. doi:10.1007/s12035-018-1229-z
Figures