4199
Cerebral metabolic changes in healthy aging: A cross-sectional 1H-MRS study1Department of Diagnostic Imaging, St Jude Children's Research Hospital, Memphis, TN, United States, 2Department of Psychology and Biobehavioral Sciences, St Jude Children's Research Hospital, Memphis, TN, United States, 3Department of Oncology, St Jude Children's Research Hospital, Memphis, TN, United States, 4Department of Epidemiology and Cancer Control, St Jude Children's Research Hospital, Memphis, TN, United States
Synopsis
Keywords: Aging, Aging
Motivation: Understanding age-associated changes in cerebral metabolism may provide mechanistic insights into the physiology of cognitive decline.
Goal(s): The goal of the study was to explore the effect of normal aging on neurometabolite levels in different brain regions using proton magnetic resonance spectroscopy (1H-MRS).
Approach: We performed 1H-MRS in brain regions associated with executive function, memory, and motor coordination in individuals without known disease recruited from the community and ranging from 19-57 years of age.
Results: We found a steady decline in markers of neuronal health and neurotransmission and an increase in markers of gliosis and/or neuroinflammation in the dorsolateral prefrontal cortex with age.
Impact: This study will inform future studies using 1H-MRS based normative brain metabolic data by mapping metabolic levels in healthy brain regions involved with executive function, memory, and motor coordination.
Introduction
Advances in non-invasive imaging have successfully informed anatomical changes that occur in the brain during normal aging (E.g., Cortical thinning, atrophy, and grey matter loss) [1]. These anatomical changes are preceded by mild impairments in biochemical processes in the brain including cellular metabolism and neurotransmission [2]. Alteration in neurometabolite levels occurs in neurodegenerative diseases and in the context of normal aging [3, 4]. Proton magnetic resonance spectroscopy (1H-MRS) is a tool used for the non-invasive quantification of age-related neurometabolite levels, particularly those associated with neurotransmission, oxidative stress, and neuroinflammation [4]. In this study, we explored the effect of normal aging on the level of neurometabolites in different brain regions using 1H-MRS in healthy individuals.Methods
Participants: Thirty-five healthy volunteers (mean [SD] age at evaluation, 40.2 [11] years; 17 females [48.5%]; 18 males [51.4%]) aged 19-57 years were recruited and underwent single voxel 1H-MRS.Data Acquisition: Data were acquired on a 3T MRI scanner (Siemens Medical Systems, Erlangen, Germany). Acquisition of 1H-MRS data was preceded by a T1-weighted MPRAGE scan (TR/TE/ 6.9/3.2 ms; FA 8°) with 1 mm3 isotropic resolution for voxel positioning and tissue segmentation. PRESS [5] localization (1.3 kHz refocusing bandwidth) was employed and configured with the following parameters: TR/TE: 2000/30 ms; was used to acquire metabolite spectra with voxels localized in the right and left dorsolateral prefrontal cortex (dlPFC) (20x20x20 mm3), right and left hippocampus (25x10x8 mm3), and left cerebellum (20x20x20 mm3) as shown in Figure 1.
Data Analysis: Regional concentrations of N-acetylaspartate (NAA), choline-containing compounds (tCho), glutamate (Glu), gamma-aminobutyric acid (GABA), glutamine (Gln) and glutamate + glutamine (Glx), myo-inositol (mI), glutathione (GSH) and other metabolites were determined using LCmodel software [6]. Metabolite concentration ratios with respect to total creatine + phosphocreatine (tCr) and SD≤30% were used for the analysis. All statistical analysis was performed using GraphPad Prism software (version 9). Shapiro-Wilk test was used to assess the normality of metabolite distributions. Pearson correlations were performed for normally distributed data and Spearman correlations were performed for non-normally distributed data. One-way ANOVA was performed for groupwise comparisons and Tukey’s test was performed for multiple comparisons correction. A significance level of p ≤ 0.05 was considered statistically significant.
Results and Discussion
Multiple comparisons showed no significant difference (p > 0.9999) in levels of any metabolite between right and left dorsolateral prefrontal cortex (dlPFC) and right and left hippocampal regions (Figure 2). Since there was no difference between metabolite levels in left or right brain regions, we combined the metabolite levels for bilateral dlPFC and hippocampus to assess regional differences in metabolite levels (Figure 3). We found significant regional differences in the levels of all metabolites between left cerebellum, dlPFC, and hippocampus regions as shown in Figure 4. Significant association with age was observed for the following metabolites: NAA/tCr (r= -0.5231, p= 0.0018); Glu/tCr (r= -0.4951, p= 0.0034) and mI/NAA (r= 0.4126, p= 0.0189) in the right dlPFC region; NAA/tCr (r= -0.5842, p= 0.0004) and Glu/tCr (r= -0.5697, p= 0.0005) in the left dlPFC region (Figure 5). No significant correlations were seen between age and Glx, total Cho, m-Ins, GSH, Gln/tCr, mI/NAA, GSH/NAA, GSH/Glu+Gln, m-Ins/Glu+Gln and GSH/mI in any brain region.The primary correlation analysis revealed negative age-related association for NAA/tCr and Glu/tCr in the right and left dlPFC regions (Figure 5). NAA is considered an indicator of neuronal health, and Glu is associated with glutamatergic neuronal activity. Our finding of decrease in these metabolite levels as individuals age might indicate a correlation between age-related neuronal impairments and alterations in both neuronal well-being and glutamatergic activity. This finding may also serve as a potential biomarker for executive function impairment as dlPFC is known to regulate executive memory [7]. Further, we observed a positive association between mI/NAA and age suggesting regional gliosis and/or neuroinflammation. mI is a marker for glial cells in brain and is reported to be elevated in neurodegenerative disorders and healthy aging [4, 8-10]. The changes observed in our study may reflect a natural part of the aging processes, and likely contribute to age-related cognitive decline. Moreover, regional differences in brain metabolite levels observed in the current study reflect the functional specialization of different brain regions and can provide biomarkers for disease diagnosis.
Acknowledgements
No acknowledgement found.References
1. Blinkouskaya, Y., et al., Brain aging mechanisms with mechanical manifestations. Mechanisms of Ageing and Development, 2021. 200: p. 111575.2. Lee, J. and H.J. Kim, Normal Aging Induces Changes in the Brain and Neurodegeneration Progress: Review of the Structural, Biochemical, Metabolic, Cellular, and Molecular Changes. Front Aging Neurosci, 2022. 14: p. 931536.
3. Angelie, E., et al., Regional differences and metabolic changes in normal aging of the human brain: proton MR spectroscopic imaging study. AJNR Am J Neuroradiol, 2001. 22(1): p. 119-27.
4. Cleeland, C., et al., Neurochemical changes in the aging brain: A systematic review. Neuroscience & Biobehavioral Reviews, 2019. 98: p. 306-319.
5. Bottomley, P.A., Spatial localization in NMR spectroscopy in vivo. Ann N Y Acad Sci, 1987. 508: p. 333-48.
6. Provencher, S.W., Estimation of metabolite concentrations from localized in vivo proton NMR spectra. Magn Reson Med, 1993. 30(6): p. 672-9.
7. Friedman, N.P. and T.W. Robbins, The role of prefrontal cortex in cognitive control and executive function. Neuropsychopharmacology, 2022. 47(1): p. 72-89.
8. Huang, W., et al., High brain myo-inositol levels in the predementia phase of Alzheimer's disease in adults with Down's syndrome: a 1H MRS study. Am J Psychiatry, 1999. 156(12): p. 1879-86.
9. Voevodskaya, O., et al., Brain myoinositol as a potential marker of amyloid-related pathology: A longitudinal study. Neurology, 2019. 92(5): p. e395-e405.
10. Patkee, P.A., et al., Neurometabolite mapping highlights elevated myo-inositol profiles within the developing brain in down syndrome. Neurobiology of Disease, 2021. 153: p. 105316.
Figures
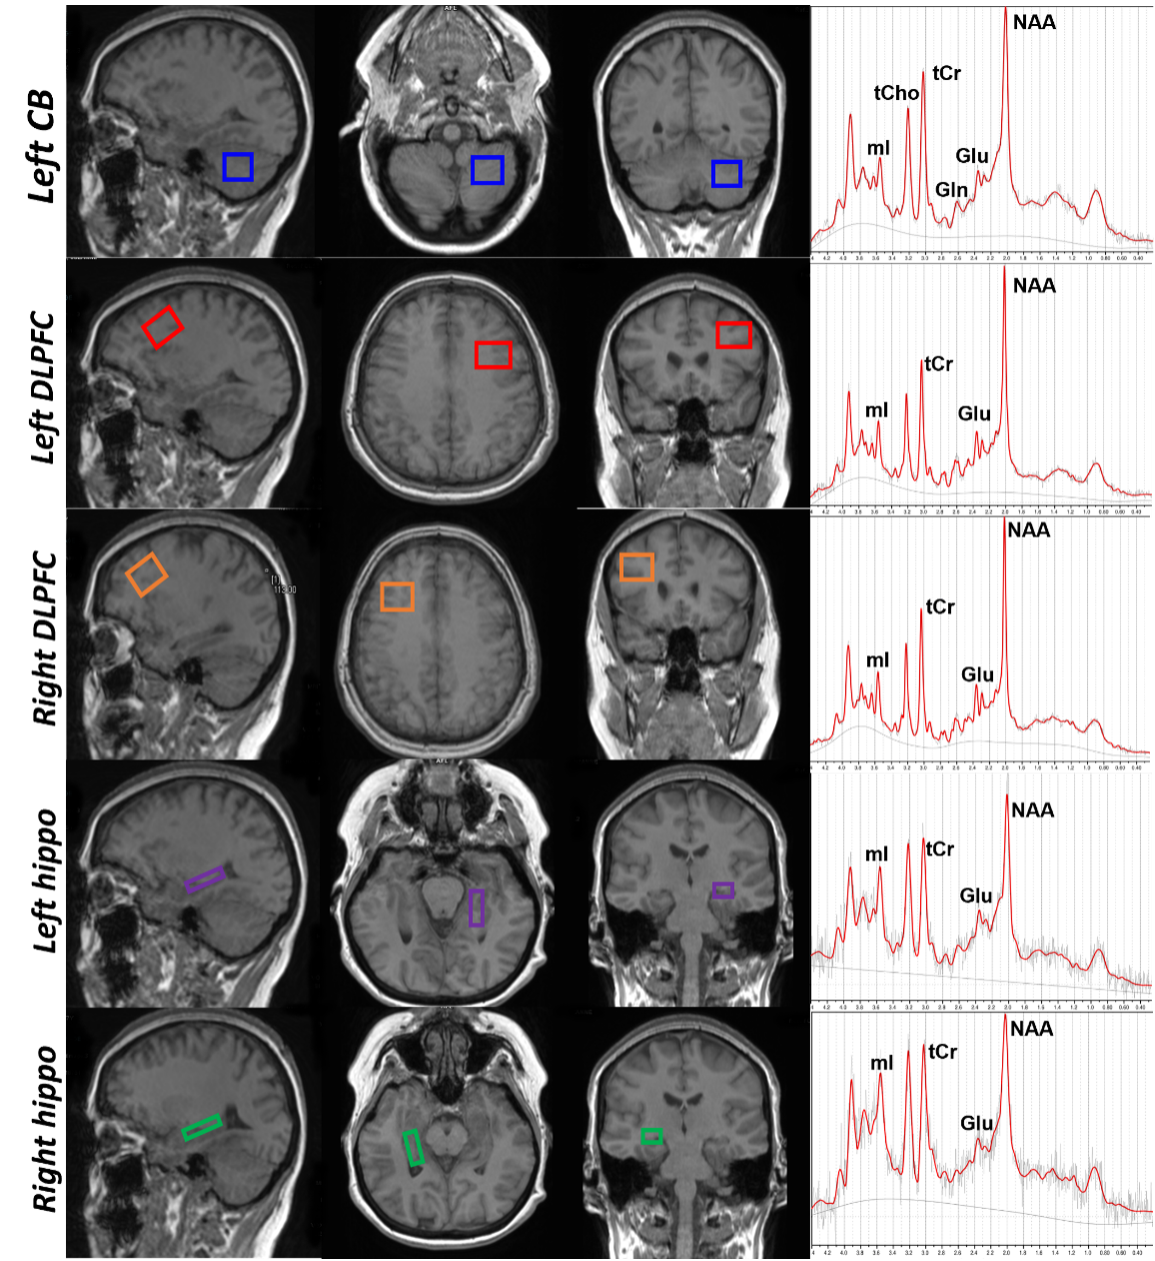
Figure 1: PRESS voxel placement and representative spectra for left CB, bilateral dlPFC, and bilateral hippocampus. CB: cerebellum; dlPFC: dorsolateral prefrontal cortex; Hippo: hippocampus.
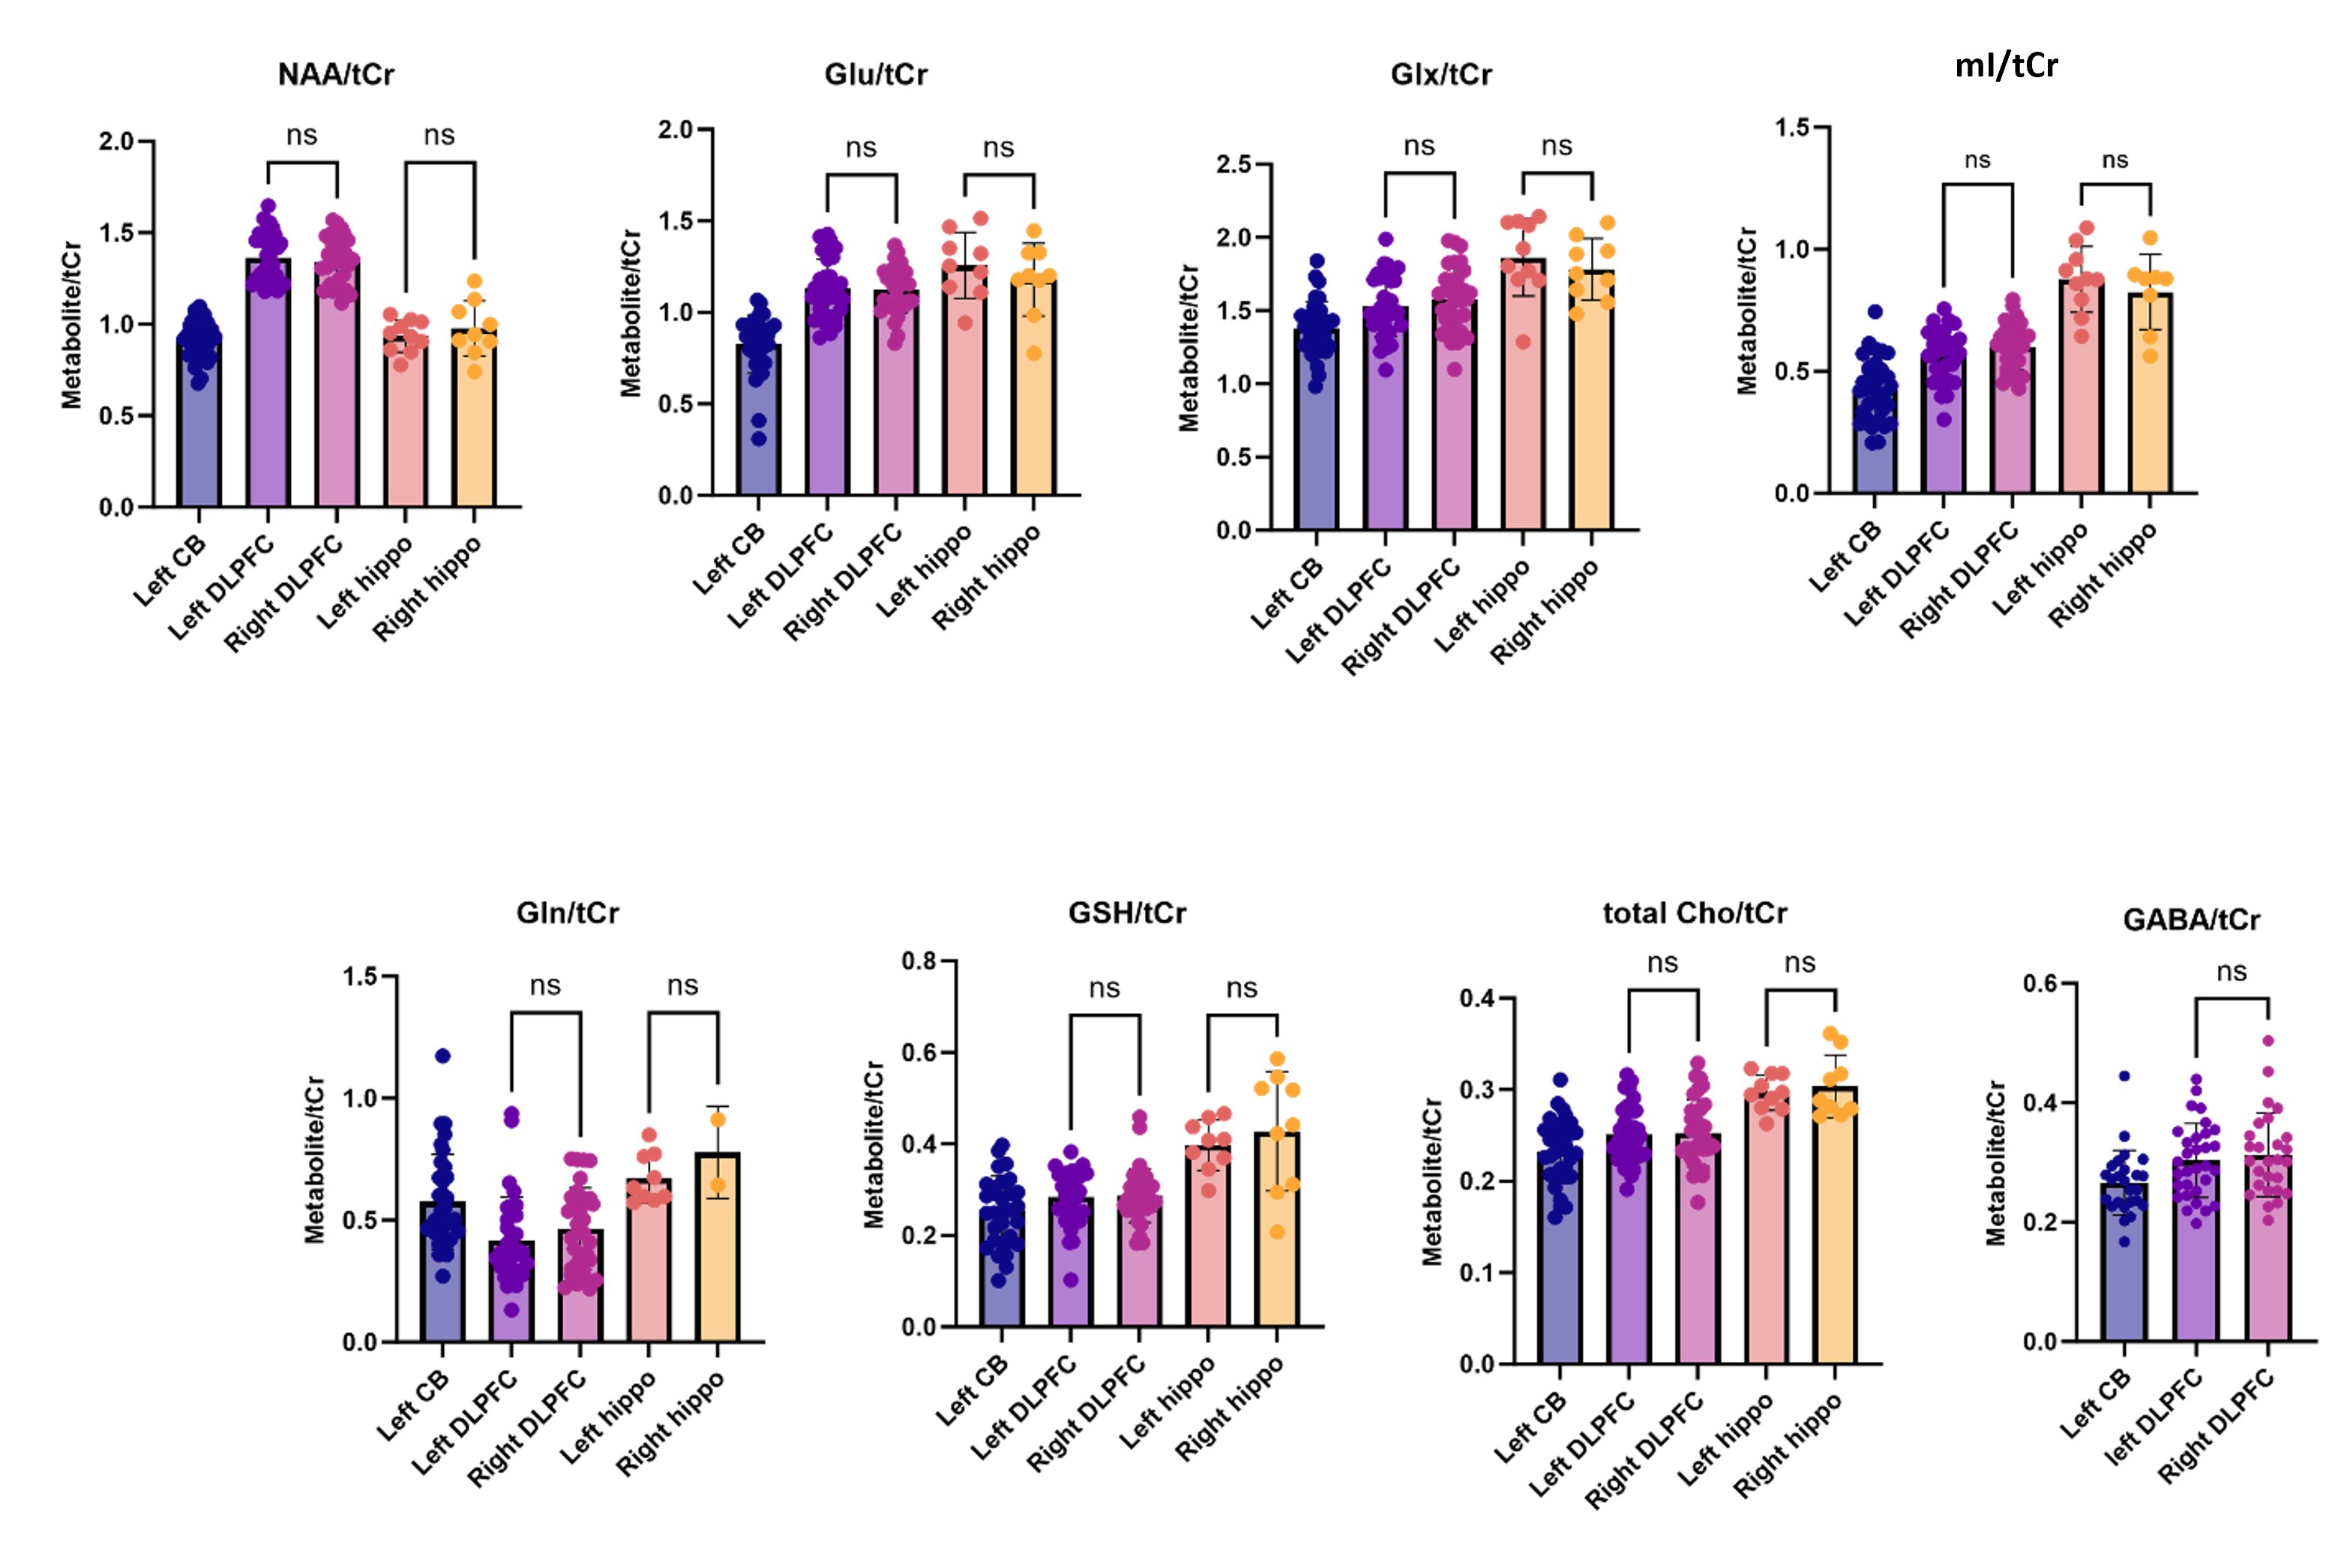
Figure 2: Metabolite differences between right and left dlPFC and right and left hippocampus. One way-ANOVA found no significant differences in metabolite levels between bilateral dlPFC and hippocampus. A significance level of p ≤ 0.05 was considered statistically significant. NAA: N-acetyl aspartate; Glu: glutamate; Glx: glutamate+glutamine; mI: myo-inositol; Gln: glutamine; GSH: glutathione; Cho: choline; GABA: gamma aminobutyric acid; tCr: total creatine.
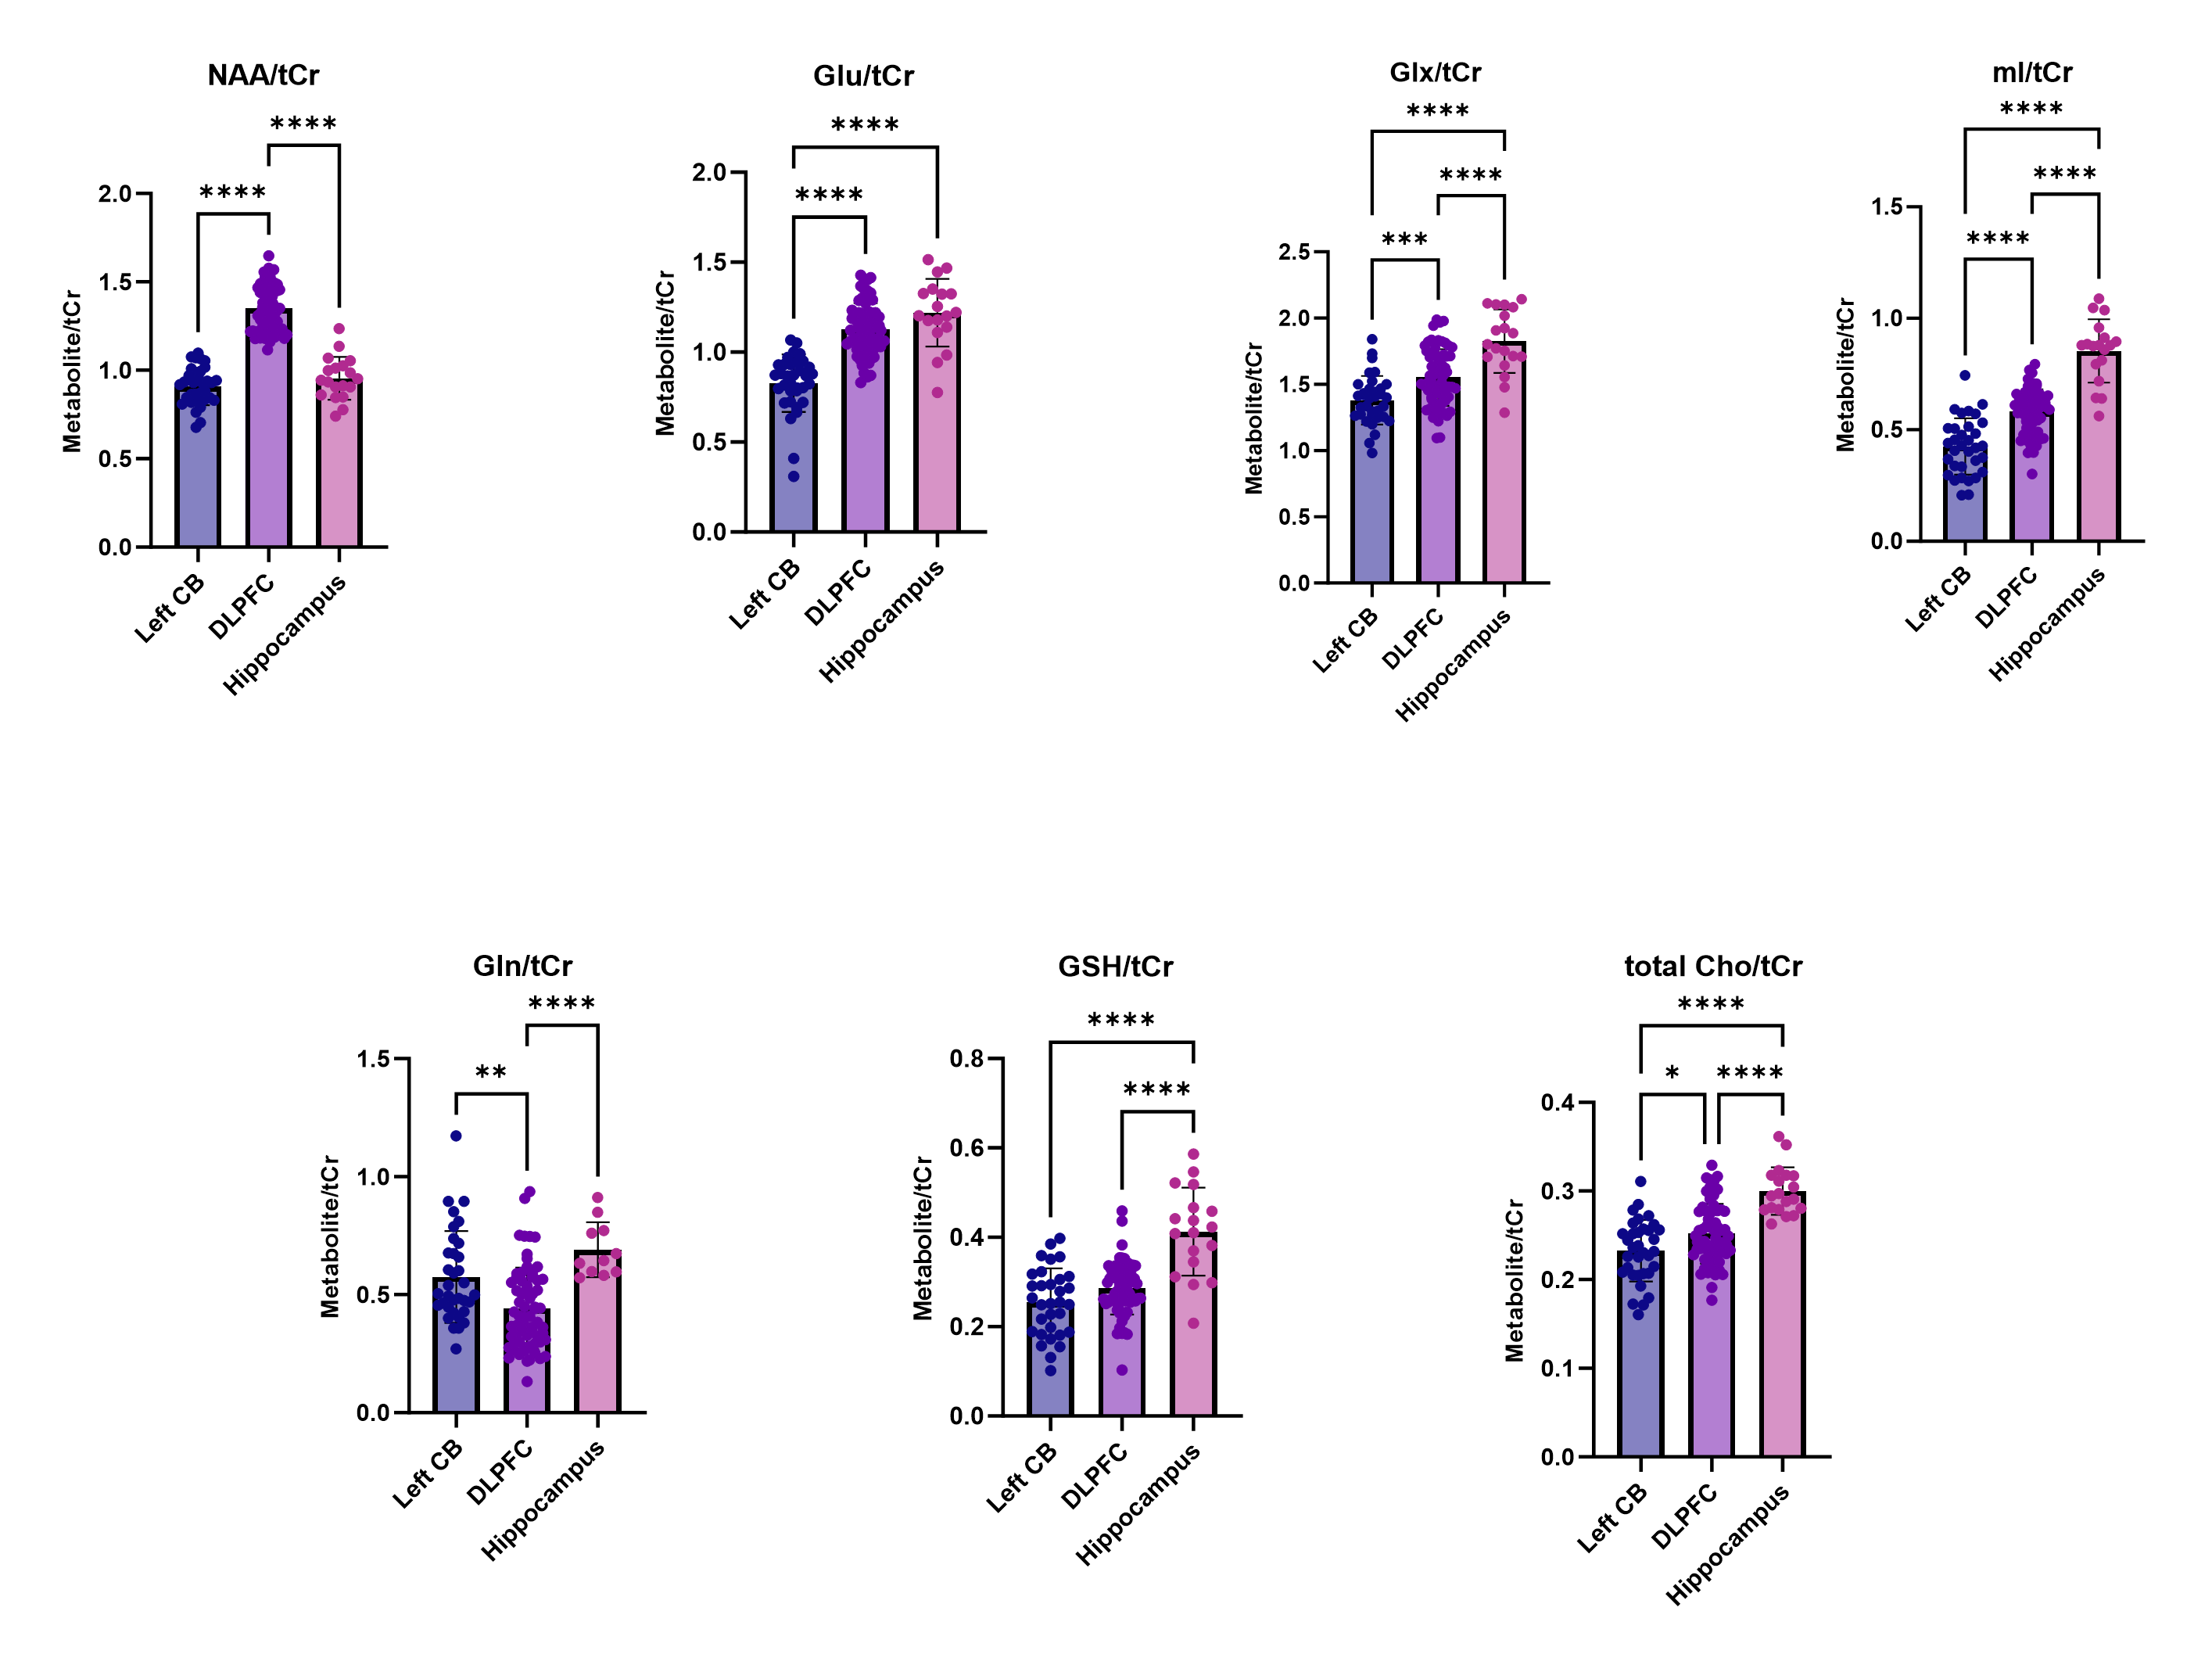
Figure 3: Regional metabolite level differences in CB, dlPFC, and hippocampus. One way-ANOVA found significant differences in metabolite levels between bilateral dlPFC and hippocampus. p values are indicated by asterisks, p ≤ 0.05 (*), p ≤ 0.001 (***), p ≤ 0.0001 (****). NAA: N-acetyl aspartate; Glu: glutamate; Glx: glutamate+glutamine; mI: myo-inositol; Gln: glutamine; GSH: glutathione; Cho: choline; GABA: gamma aminobutyric acid; tCr: total creatine.
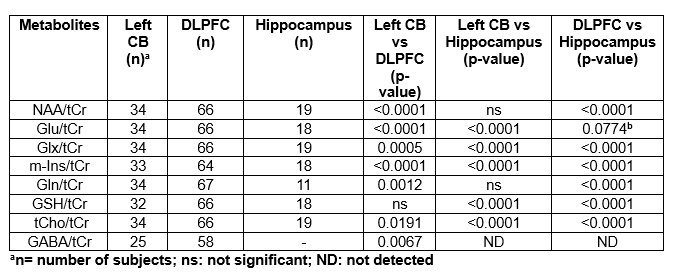
Figure 4: Regional differences in the levels of all metabolites between left CB, dlPFC, and hippocampus regions. CB: cerebellum; dlPFC: dorsolateral prefrontal cortex.
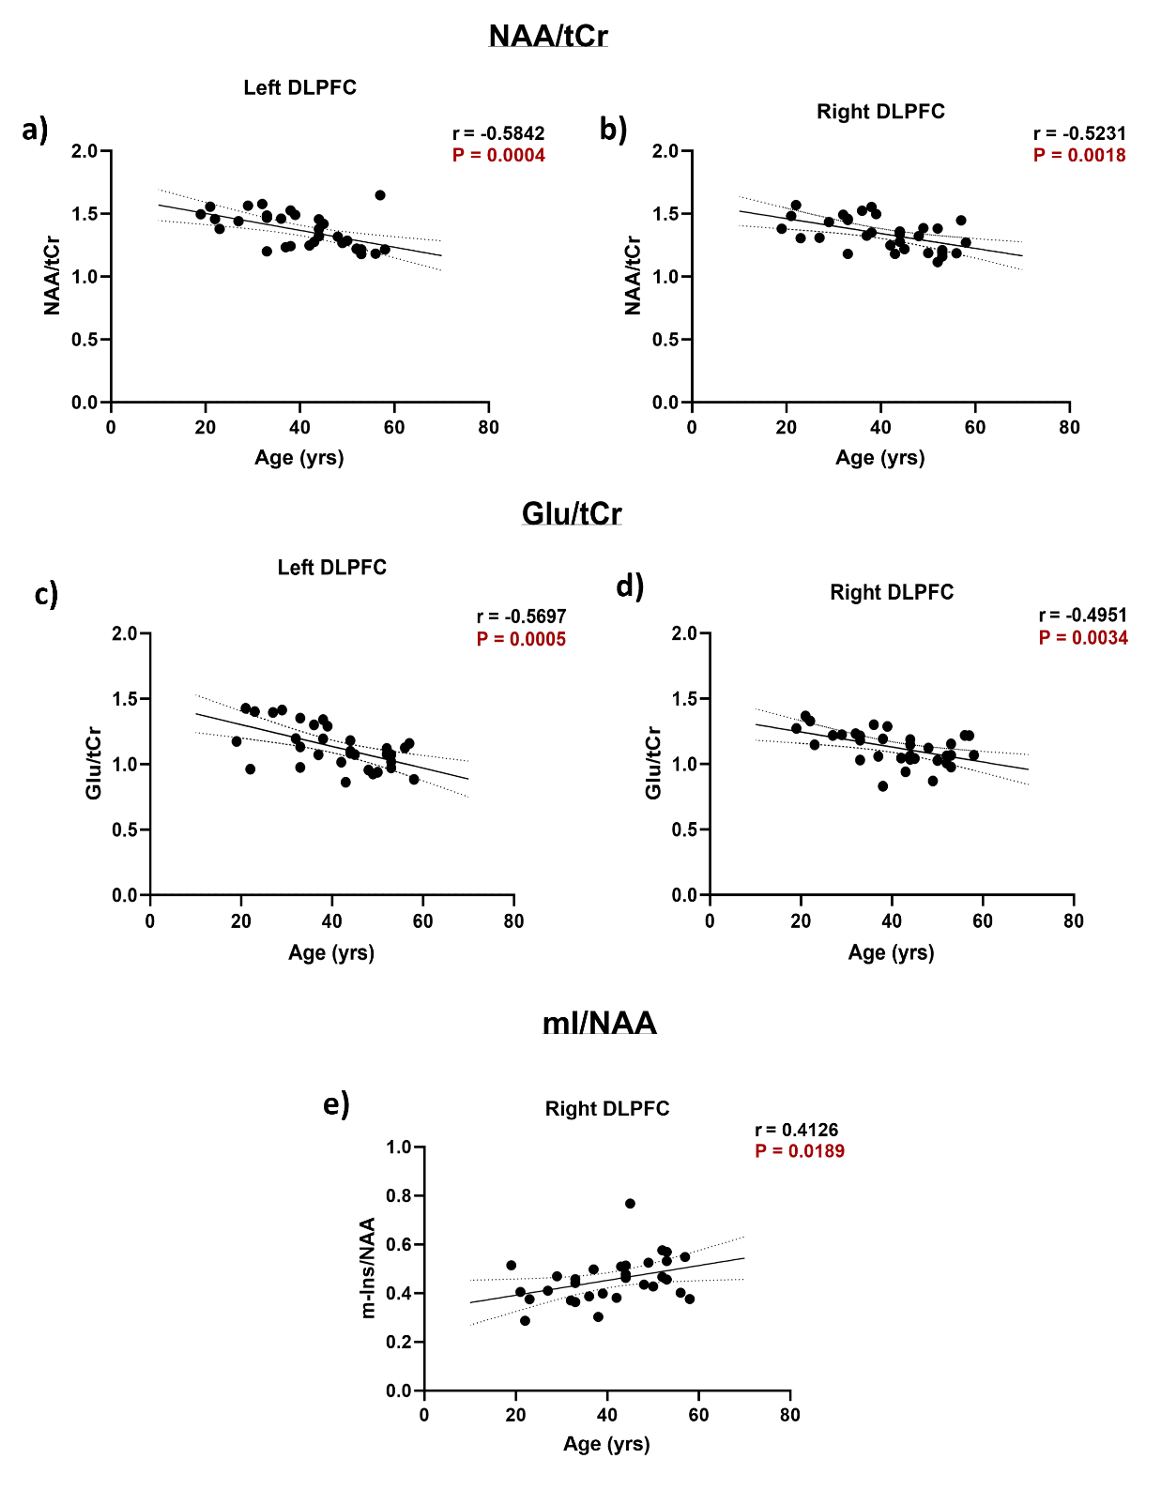
Figure 5: Associations between neurometabolites with age in healthy individuals. Correlation analysis showed significant correlations of neurometabolites levels with age (a) NAA/tCr (r= -0.5231, p= 0.0018) (d) Glu/tCr (r= -0.4951, p= 0.0034) and (e) mI/NAA (r= 0.4126, p= 0.0189) in the right DLPFC region; (b) NAA/tCr (r= -0.5842, p= 0.0004) and (c) Glu/tCr (r= -0.5697, p= 0.0005) in the left dlPFC region. A significance level of p ≤ 0.05 was considered statistically significant. NAA: N-acetyl aspartate; Glu: glutamate; mI: myo-inositol; tCr: total creatine.