4197
Fractal Dimension as a T1 Measure for Multiparametric Investigation of Outcome Variance Following Deep Brain Stimulation in Parkinson’s Disease1Radiology and Biomedical Imaging, University of California San Francisco, San Francisco, CA, United States, 2Neurology, University of California San Francisco, San Francisco, CA, United States, 3Neurological Surgery, University of California San Francisco, San Francisco, CA, United States
Synopsis
Keywords: Parkinson's Disease, Parkinson's Disease, DBS, T1, multiparametric, fractal dimension, therapeutic outcomes, stimulation
Motivation: Improved prognostic criteria are needed to better understand outcome variance in response to DBS for Parkinson's disease. Leveraging routinely collected T1-w MRI could offer accessible predictive biomarkers.
Goal(s): In 129 patients, we sought to find features derivable from preoperative T1-w images to serve as informative biomarkers to explain variance in response to DBS.
Approach: Employing regional analysis and regression techniques, we examined the relationships between fractal dimension (FD), regional volumes, and post-DBS treatment responses.
Results: Analysis revealed distinct, significant correlations between FD and volumes with response to DBS, indicating their potential for complementary integration in a multi-parametric predictive tool.
Impact: Fractal dimension and volume, metrics derived from T1-w MRI, correlate with DBS response variance in PD patients. Integration of multi-parametric T1-w imaging features into prediction models could aid clinicians in candidate selection and treatment planning to ultimately improve patient-centric outcomes.
Introduction
Deep brain stimulation (DBS) has emerged as a therapeutic intervention for patients with Parkinson's disease (PD) when medication becomes less effective overtime1. Despite its efficacy in some patients, outcomes following DBS can vary significantly, with instances of notable improvement juxtaposed with cases displaying limited response2-4. Currently in the field, advanced connectome-based MR techniques are being leveraged for predictive biomarker development to identify objective prognostic criteria5-6. The utilization of T1-weighted (T1-w) images has been limited in this domain, despite being the most frequently acquired sequence for DBS screening and surgical targeting.Fractal dimension (FD) is potentially informative T1-w feature which represents a measure of the complexity and irregularity of brain structures7. It has previously been utilized to distinguish between healthy controls (HCs) and patients with PD8-10 and to study subtle changes in neurodegeneration11. To shed light on the potential role of FD as a novel imaging biomarker for assessing DBS treatment response in PD, here we examined the relationship between FD and subject response to DBS, while also exploring regional brain volume as a secondary T1-w biomarker.
Methods
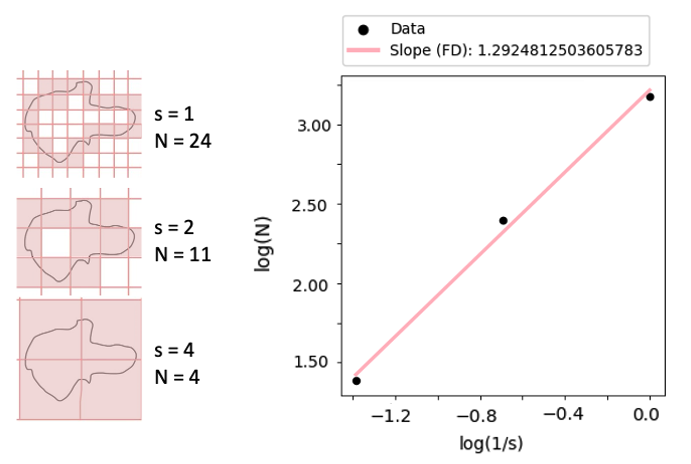
Pre-operative T1-w MRI was collected for 129 patients with PD (mean age=65, range=40-80; 22% female) undergoing DBS implantation surgery bilaterally (N=97) or unilaterally (NL=15, NR=17) targeting the subthalamic nucleus (NSTN=75) or the globus pallidus interna (NGPi=54). Clinical scans were performed on 3T GE or Philips systems with variable acquisition parameters reflecting real-world clinical settings including: echo time (TE)=3-4ms, repetition time (TR)=680-1000ms, field-of-view= 256x256mm, and voxel size= 0.5x0.5x1mm or 1mm isotropic.Brain volume was extracted and normalized by whole brain scaling for 90 regions of interest (ROIs) from the automated anatomical labeling atlas12. FD was calculated in Python using the box-counting method (Fig 1). Patients’ pre-to-post change in PD medications, specifically the change in their levodopa equivalent daily dose (LEDD) at up to 2 years postop, was used as a surrogate measure of therapeutic response to DBS. Linear regression analysis was performed in R for both FD and volume metrics, evaluating their relationship with the change in LEDD across all ROIs, while correcting for age, lead location, and target as covariates. ROIs with a Pearson correlation coefficient (R2) > 0.1 and p-value < 0.05 between either FD or volume and change in LEDD were deemed significantly correlated. The DeepHypergraph PyTorch package13 was used to demonstrate clustering of patients based on their similarities in the FD and volume feature spaces.
Results
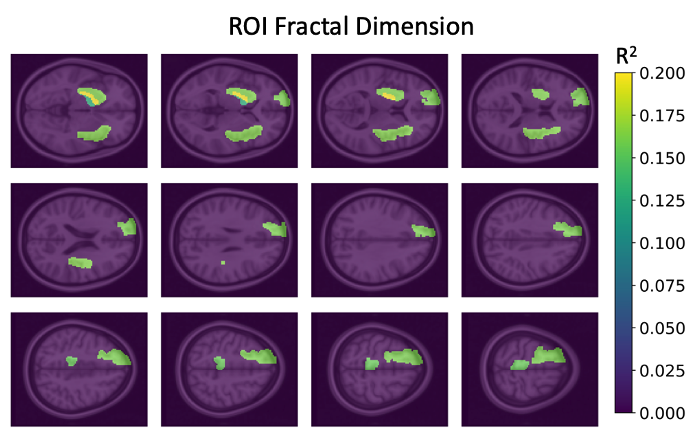
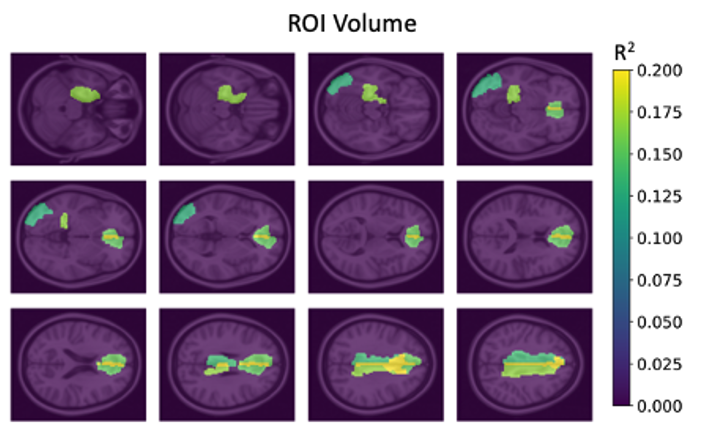
Analysis revealed ROIs with notable correlations between their FD or volume and the patients’ pre-to-post change in LEDD (Figs 2,3). The correlation between FD and LEDD change was highest in the right frontal superior gyrus (R2=0.16, p<0.05), left insular cortex (R2=0.16, p<0.05), and right paracentral lobule (R2=0.15, p<0.05). For normalized volume, the highest correlation was with the bilateral middle and anterior cingulate cortex (all p<0.05; left: Rm2=0.17, Ra2=0.15, p<0.05; right: Rm2=0.14, Ra2=0.16), and the right inferior occipital region (R2=0.13, p<0.05). Notably, cross-correlation analysis revealed minimal association between FD and volume (R2<0.02) across all ROIs and no shared significant ROIs.Discussion
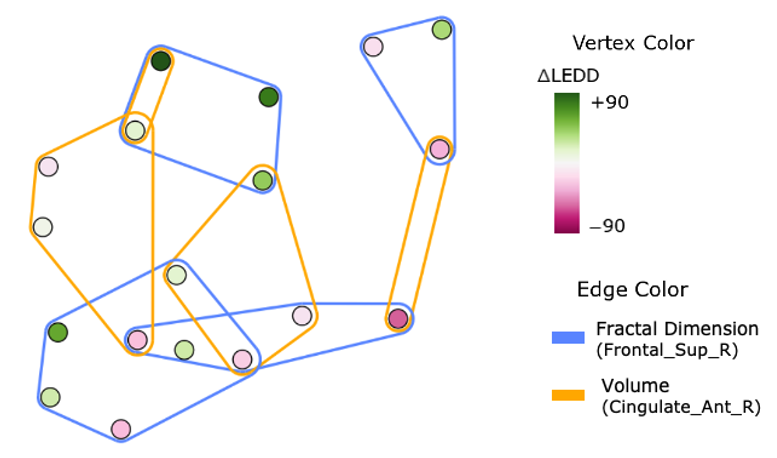
Our results suggest that reduced FD of the frontal superior gyrus, insular cortex, and paracentral lobule, and increased volume of the cingulate cortex and inferior occipital region, may be informative biomarkers for future multi-parametric prediction models of DBS outcomes. This agrees with previous findings of FD reduction with anatomical degeneration11, as well as regional increases in brain volume that are thought to reflect compensatory effects due to loss of function14. The lack of shared significant regions between FD and volume suggests their complementary utility as they appear to reflect different underlying processes.With significant ROIs predominantly involved in PD-related non-motor functions, the results underscore the influence of neurocognitive status on DBS outcomes. However, this could also reflect the sensitivity of LEDD change to the choice of brain target which is typically based on patient non-motor status during candidate selection.Hypergraph visualization of patient clustering based on our T1-w metrics (Fig 4), highlights the intricate interplay between subject-level imaging features, emphasizing the potential for identifying an array of clinical responder subtypes.Collectively, these findings underscore the feasibility of leveraging T1-w MRI alongside advanced analytical techniques to explain variances in PD response to DBS. Next steps will involve integrating these T1-w metrics with connectome and susceptibility-based MR metrics for multi-parametric prediction of DBS outcomes.
Conclusion
Our study highlights the potential of integrating fractal dimension and volumetric measurements from T1-w MRI with advanced machine learning techniques to better understand variances in PD outcomes with DBS and facilitate the development of decision-support tools for DBS candidate and target selection.Acknowledgements
We extend our heartfelt thanks to the neurologists and MRI technicians for their invaluable assistance in data collection and to the patients and caregivers who generously participated in and supported this study.References
- Hariz M, Blomstedt P: Deep brain stimulation for Parkinson’s disease. J Intern Med 2022:764–778.
- Nickl, R. C. et al. Rescuing Suboptimal Outcomes of Subthalamic Deep Brain Stimulation in Parkinson Disease by Surgical Lead Revision. Neurosurgery 85, E314–E321 (2019).
- Frizon, L. A. et al. Outcomes following deep brain stimulation lead revision or reimplantation for Parkinson’s disease. J. Neurosurg. 130, 1841–1846 (2019).
- Anheim, M. et al. Improvement in Parkinson Disease by Subthalamic Nucleus Stimulation Based on Electrode Placement. Arch. Neurol. 65, (2008).
- Wong JK, Middlebrooks EH, Grewal SS, Almeida L, Hess CW, Okun MS: A Comprehensive Review of Brain Connectomics and Imaging to Improve Deep Brain Stimulation Outcomes. Movement Disorders 2020:741–751.
- DiMarzio MD, Madhavan R, Joel S, et al.: Use of Functional Magnetic Resonance Imaging to Assess How Motor Phenotypes of Parkinson’s Disease Respond to Deep Brain Stimulation. Neurosurgery 2019(Supplement 1):310–696.
- Agboola O, Onyango MS, Popoola P, Oyewo OA: Fractal Geometry and Porosity. Fractal Analysis - Applications in Physics, Engineering and Technology 2017.
- Li D, Wang E, Jia Y, et al.: Cortical complexity and gyrification patterns in Parkinson’s disease. NeuroReport 2020:565–570.
- Kubera KM, Schmitgen MM, Hirjak D, Wolf RC, Orth M: Cortical neurodevelopment in pre-manifest Huntington’s disease. NeuroImage: Clinical 2019:101913.
- Kubera KM, Schmitgen MM, Nagel S, et al.: A search for cortical correlates of trait impulsivity in Parkinson´s disease. Behavioural Brain Research 2019:111911.
- Ziukelis ET, Mak E, Dounavi M-E, Su L, T O’Brien J: Fractal dimension of the brain in neurodegenerative disease and dementia: A systematic review. Ageing Research Reviews 2022:101651.
- Tzourio-Mazoyer N, Landeau B, Papathanassiou D, et al.: Automated Anatomical Labeling of Activations in SPM Using a Macroscopic Anatomical Parcellation of the MNI MRI Single-Subject Brain. NeuroImage 2002:273–289.
- Gao, Y., Feng, Y., Ji, S., & Ji, R. (2022). HGNN: General Hypergraph Neural Networks. IEEE Transactions on Pattern Analysis and Machine Intelligence.
- Lin C-H, Chen C-M, Lu M-K, et al.: VBM Reveals Brain Volume Differences between Parkinson’s Disease and Essential Tremor Patients. Front Hum Neurosci 2013.
Figures