4196
Metabolic story of functional connectivity in Parkinson’s Disease- A multimodal imaging perspective.1Nuclear Magnetic Resonance (NMR), AIIMS, New Delhi, India, 2Neurology, AIIMS, Delhi, India
Synopsis
Keywords: Parkinson's Disease, Brain Connectivity, Functional Connectivity, Parkinson's Disease, Magnetic Resonance Spectriscopy
Motivation: Cortical regions are consequential in non-invasive brain stimulation studies in Parkinson’s Disease. It is important to investigate the cortical connectivity and understand the status of cortical networks with respect to the metabolic profile in PD.
Goal(s): This study explored the metabolic profile (using 1H-magnetic resonance spectroscopy-MRS) and functional connectivity (resting state functional MRI).
Approach: Resting state functional MRI (with 360 dynamics), 3D T1, single voxel 1H-MRS (in bilateral primary motor areas) were assessed in PD and controls.
Results: Perturbations in cortico-cortical networks with increased choline metabolites signify loss in neural integrity.
Impact: This study explores the cortical connectivity correlates with neural biochemistry. PD related changes in the cortical connectivity could be due to loss in neural integrity in primary motor area. Multimodal studies could lay a groundwork for brain stimulation studies.
Introduction
Parkinson’s Disease is a progressive neurodegenerative disorder characterized by clinical as well as non-motor deficits1. These deficits are attributed to dopaminergic depletions in basal ganglia that eventuate into functional connectivity alteration in the cortical regions2. Primary motor area and supplementary motor area etc., are involved in planning and execution of movements and exhibit an altered connectivity pattern in PD3,4. Hence, non-invasive brain stimulation studies have targeted these brain areas, making it important to understand the functioning of these brain regions5. This study was thus planned as a pilot investigation to explore the metabolic profile (using 1H-magnetic resonance spectroscopy (MRS)) of functional connectivity (resting state functional MRI).Methods
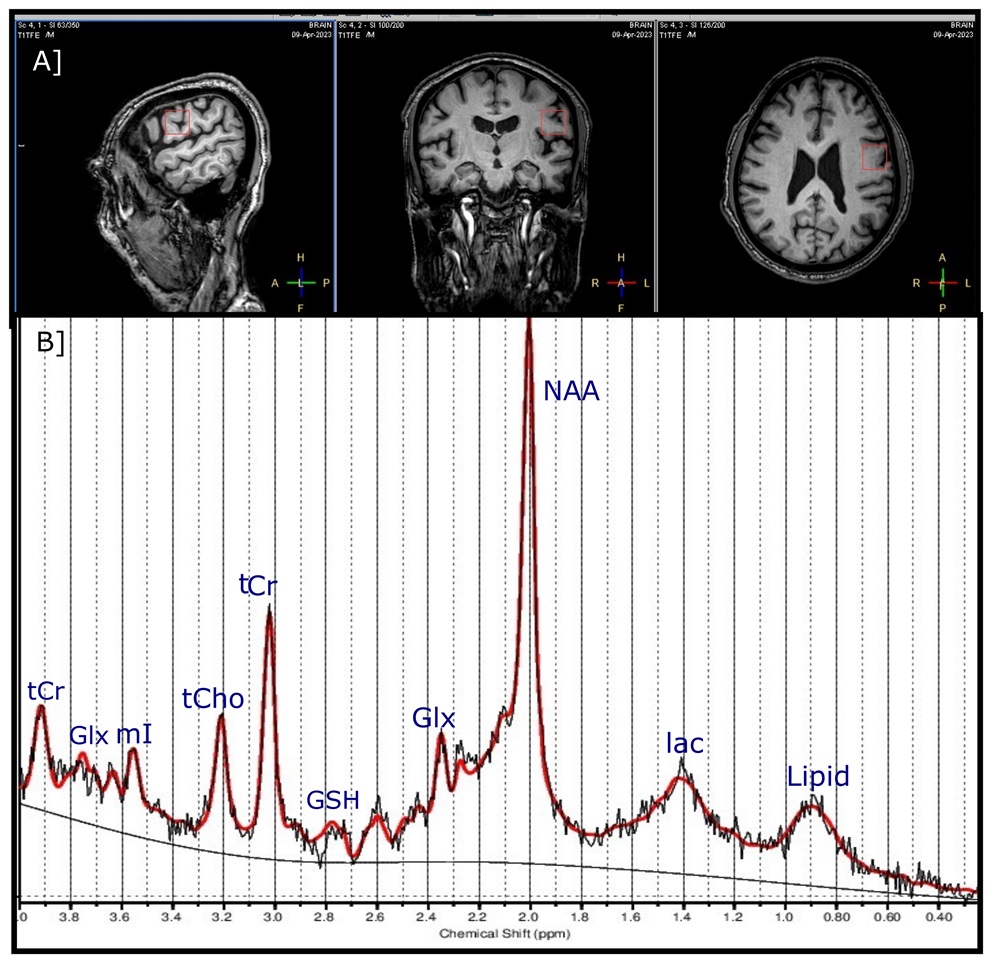
Subjects [N=14; PD (N:7), healthy volunteers-HV (N:7)] were recruited as a part of a ongoing multi-phased study wherein all protocols were approved by the Institutional Review Board and each subject provided written informed consent prior to the study. PD were recruited according to the United Kingdom PD brain bank criteria. MRI studies were conducted on 3.0-Tesla MRI scanner (Ingenia, Philips Medical Systems, The Netherlands). The functional scans were acquired with multiband (factor 3) single-shot echo-planar imaging (EPI): EPI factor- 43, FOV- 230× 230×144, iso-voxel 3× 3× 3mm3, echo-time (TE)- 25 ms, repetition time (TR)- 1000 msec, dynamics- 360. The 1H-MRS was acquired with Single Volume Point Resolved Spectroscopy sequence (PRESS) with acquisition parameters: TR/TE = 2000/34ms; NEX=128, spectral bandwidth=2000, spectral points= 1024 and excitation pulse sequence for water suppression. The PRESS was acquired on primary motor cortex located at pre-central gyrus on both hemispheres with voxel size of 20× 20× 20. The voxel position was planned in all the three planes of a 3D T1 sequence (Figure 1A).The MRS raw data was processed using LC Model Version 6.3 for quantitative assessment of the brain metabolites (Figure 1B). Regional volumes from both hemispheres and metabolite ratios were examined for significant differences between PD patients and controls using Mann Whitney U test thresholded at p<0.05 for statistical significance. Clinical scores and metabolite data were analysed using SPSS (version 22.0, IBM Corp, USA). Functional data were analysed using Conn toolbox (ver 22.a). Pre-processing included realignment, outlier detection (using ART-Artefact Detection Tool), co-registration (to T1), normalization (to MNI-Montreal neurological institute template) and smoothing (kernel of FWHM=6), denoising (band-pass filter= 0.008 to 0.09 Hz). Seed based connectivity (SBC) connectivity maps were computed timeseries as the Fisher-transformed bivariate correlation coefficients. Precentral gyri (PreCG)- right (x, y, z = 35, -11, 50 mm) and left (x, y, z = -34, 12, 49 mm) were chosen as the seeds for connectivity maps. A voxel threshold of p FDR <0.001 cluster threshold p FDR<0.05 were used for seed to voxel and region of interest (ROI) based connectivity analyses. Degree and clustering coefficient (CC) were estimated as an assessment of graph theoretical measures.
Results
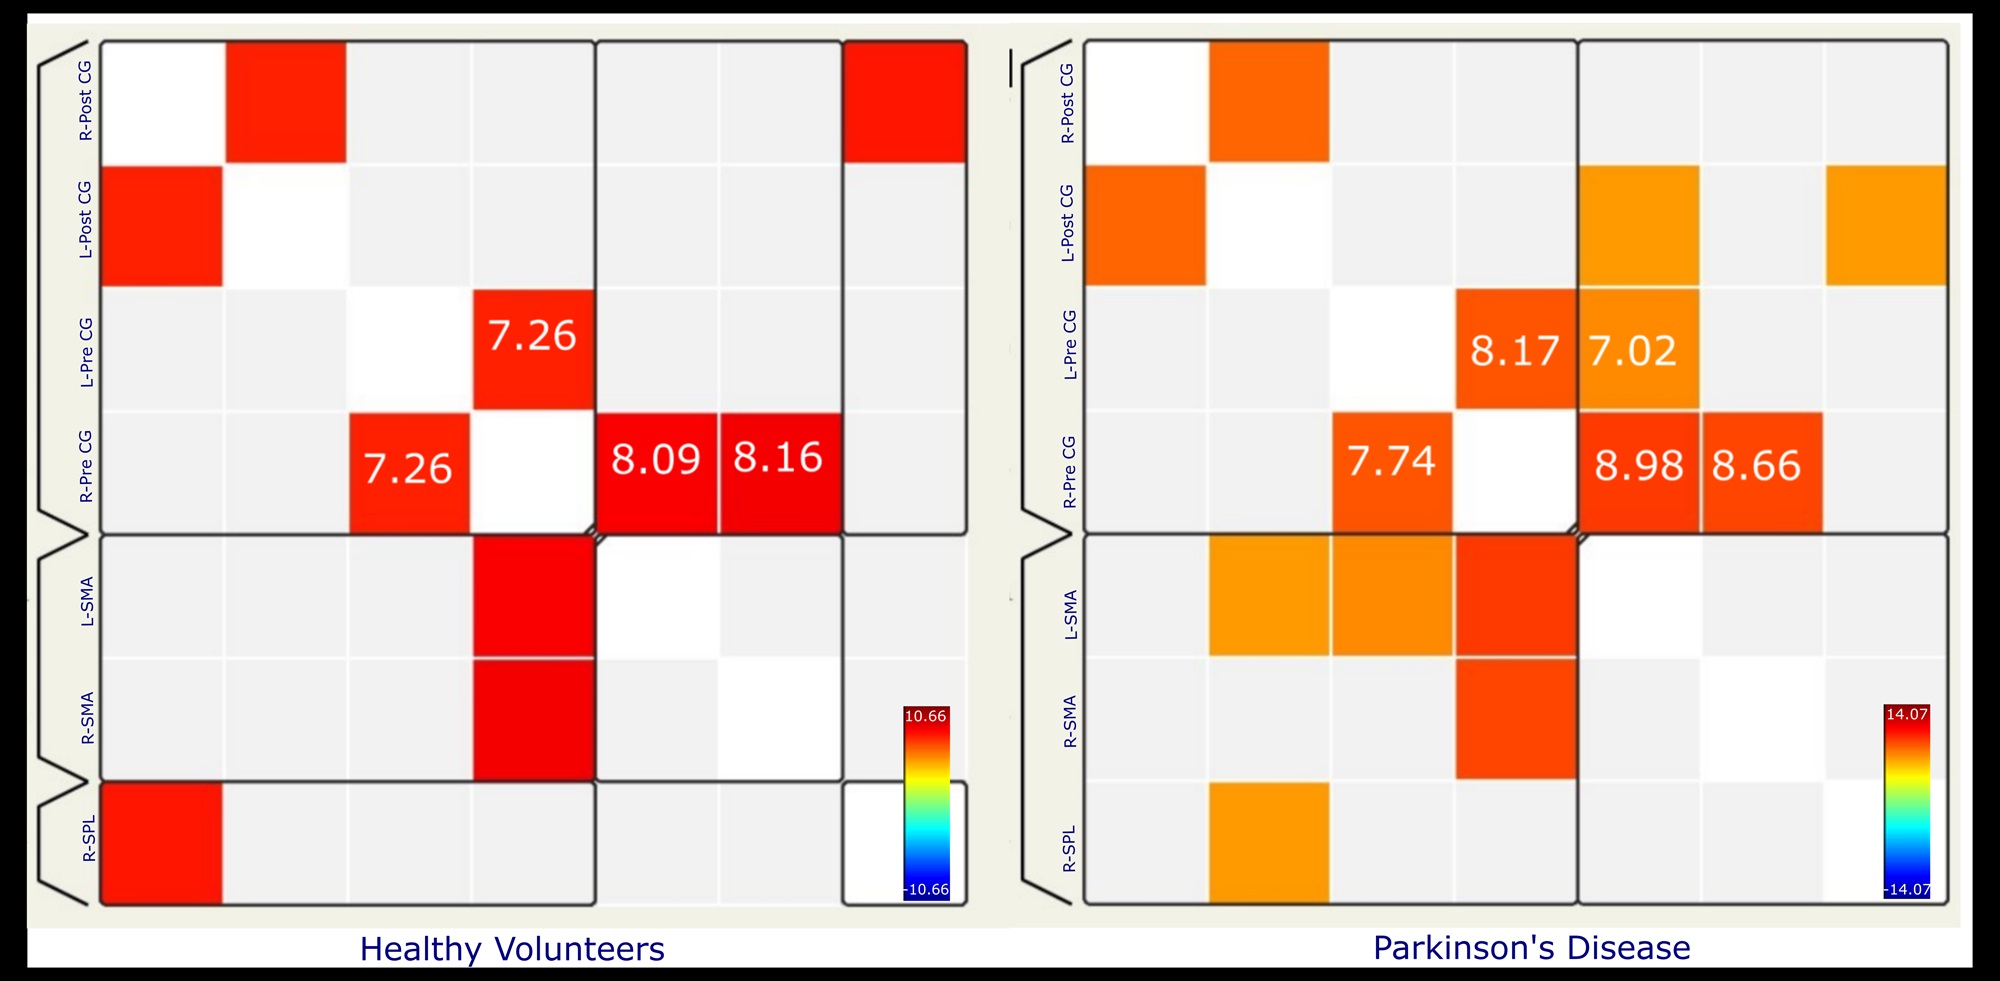
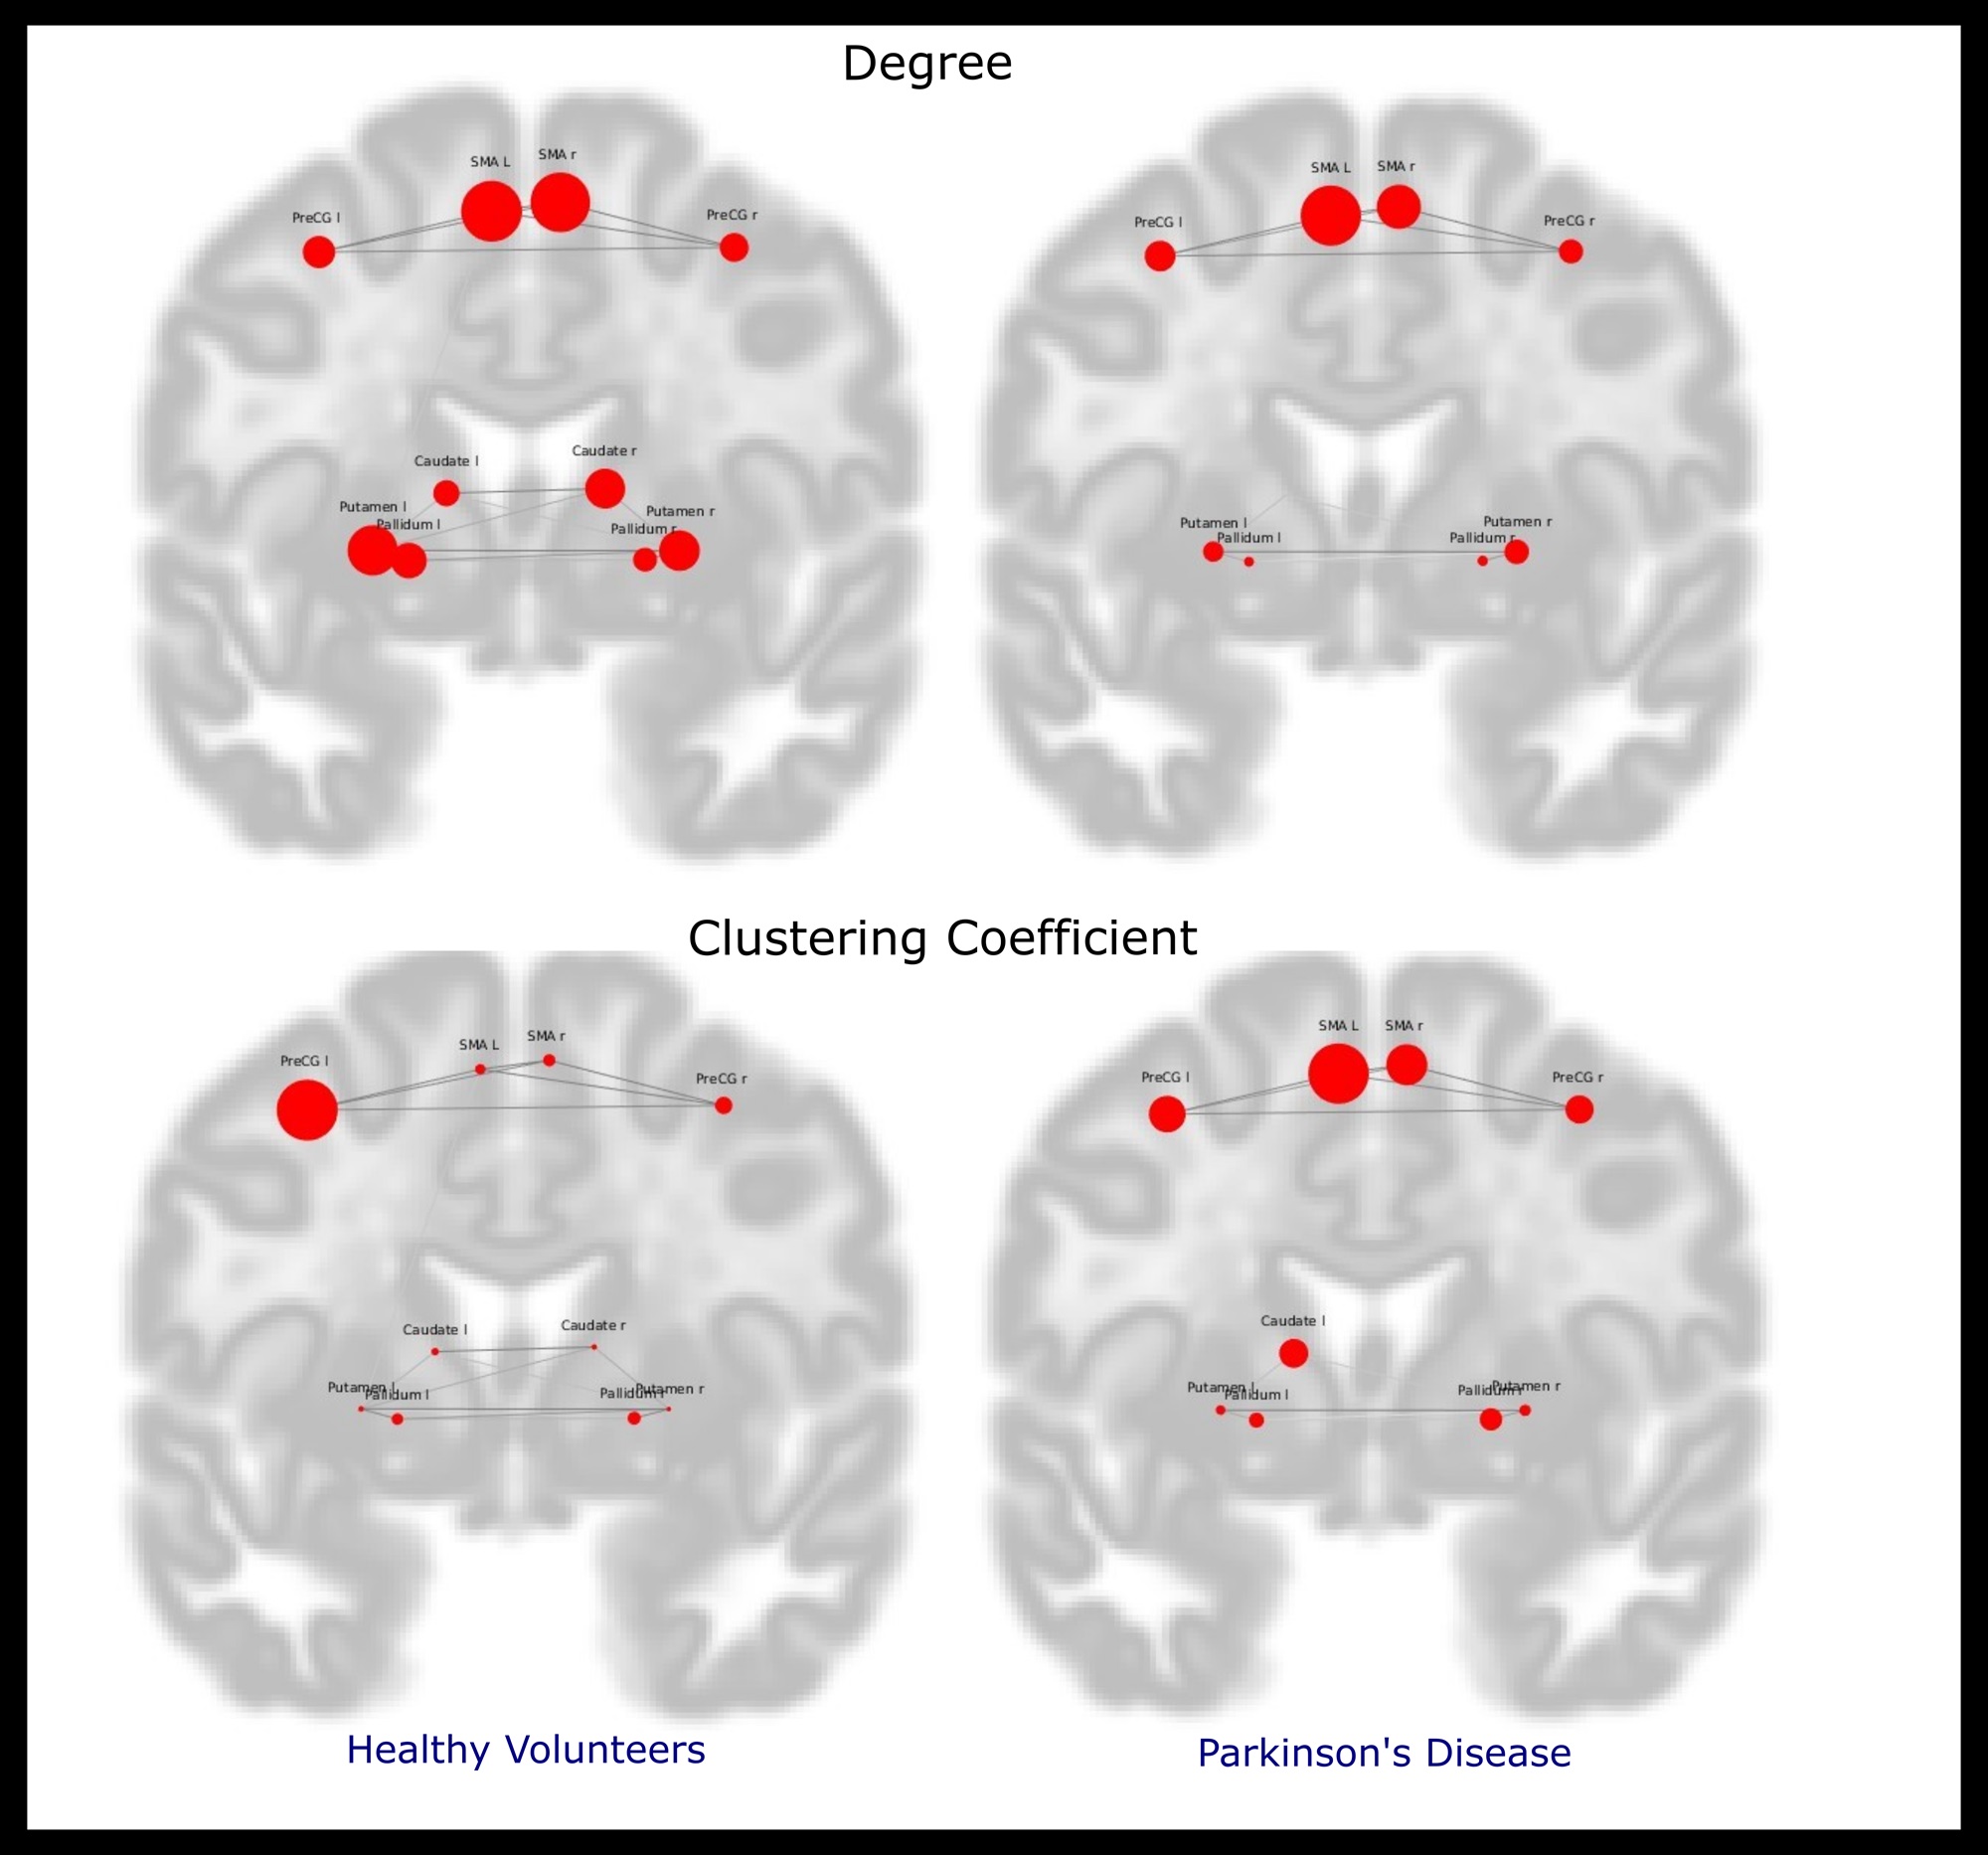
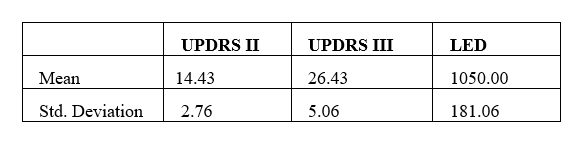
Age [PD= 57.28± 10.24, HV= 52.42± 12.17; (p = 0.273)] and gender [Male: Female PD=5:2, HV=2:5; (p = 0.109)] were not significant between groups. ROI connectivity maps from the seed regions revealed decreased connectivity in PD as compared to that of HV (Figure 2). Degree and CC revealed significant loss in the connectivity between regions (Figure 3). MRS revealed significant increase in [glycerophosphocholine (GPC)]/total creatine (tCr) (p<0.001) as well as [glycerophosphocholine (GPC) + phosphocholine (PCh)]/tCr (p<0.001) in right PreCG in PD as compared to that of HV. When correlated with Unified Parkinson’s Disease Rating Scale (UPDRS) III scores (Table 1) a trend towards positive correlation (spearman’s rho=0.721; p=0.068).Discussion
Functional connectivity is a robustly explored modality to investigate neural functions and effects of interventions in PD6,7. This study explores the cortical connectivity along with neural biochemistry. The increase in choline components signifies possibility of neural perturbations in the right primary motor area in PD that can be attributed to the decrease in neuronal density and integrity8. This, along with decreased cortical connectivity in PD (between right and left primary motor areas); compensatory increase in degree (depicting number of networks from the seed region) and clustering (depicting when a region is hub within a cluster) of supplementary motor areas represents the cortical plasticity, as a result of PD related neurodegeneration.Conclusion
This study highlights the PD related changes in the cortical connectivity and delineates the possible loss in neural integrity in right primary motor area. Multimodal studies attempting to correlate connectivity and metabolic parameters lay a groundwork for brain stimulation studies.Acknowledgements
This work was supported by Grants R.11013/68/2021- GIA/DHR and R.11012/24/2023-GIA/DHR of Department of Health Research, Ministry of Health and Family Welfare, Govt. of India.References
1. Postuma, R. B. et al. The new definition and diagnostic criteria of Parkinson’s disease. Lancet Neurol 15, 546–548 (2016).
2. Kaasinen, V. Ipsilateral deficits of dopaminergic neurotransmission in Parkinson’s disease. Ann Clin Transl Neurol 5;3(1):21-6 (2015).
3. Udupa, K. & Chen, R. Motor Cortical Plasticity in Parkinson’s Disease. Front Neurol 4, 128 (2013).
4. Burciu, R. G. & Vaillancourt, D. E. Imaging of Motor Cortex Physiology in Parkinson’s Disease. Movement Disorders 33, 1688–1699 (2018).
5. Bhat P, Goyal V, Kumaran SS, et al., Mechanisms of 1 Hz Inhibitory and 5 Hz Excitatory Repetitive Transcranial Magnetic Stimulations in Parkinson’s Disease: A Functional Magnetic Resonance Imaging Study. Brain Connect Brain Connect. 2023;13(4):247-263 (2023).
6. Bohnen, N. I. & Martin, W. R. W. Dopamine-dependent functional connectivity in Parkinson disease. Neurology 83, 202 (2014).
7. Bhat, P., Kumaran, S. S., Goyal, V., Srivastava, A. K. & Behari, M. Effect of rTMS at SMA on task-based connectivity in PD. Behavioural Brain Research 452, 114602 (2023).
8. Hammen, T. & Kuzniecky, R. Magnetic resonance spectroscopy in epilepsy. Handb Clin Neurol 107, 399–408 (2012).
Figures