4193
Genetic mechanisms underlying gray matter atrophy in Parkinson’s disease: a combined transcriptome and neuroimaging study1The Affiliated Wuxi People's Hospital of Nanjing Medical University, WuXi, China
Synopsis
Keywords: Parkinson's Disease, Neurodegeneration
Motivation: Extensive research has shown prominent gray matter atrophy in patients with Parkinson's disease, yet its genetic mechanisms are largely unknown.
Goal(s): We aimed to investigate the genetic mechanisms underlying gray matter atrophy in PD.
Approach: We performed a comprehensive neuroimaging meta-analysis along with an independent dataset analysis. Utilizing the Allen Human Brain Atlas, we performed spatial association analyses linking transcriptome data to neuroimaging findings, along with gene functional feature analyses for the identified genes.
Results: Our findings suggest that prominent gray matter atrophy in PD may be a consequence of intricate interactions among a diverse set of genes with various functional features.
Impact: Our findings may offer unique insights into the genetic mechanisms underlying brain gray matter atrophy in Parkinson’s Disease through bridging the gap between microscale molecular function and macroscale brain architecture.
Introduction
Parkinson’s disease (PD) is a complex clinical syndrome with a range of causes and clinical presentations (1), representing the fastest-growing neurological disorder on a global scale and thus giving rise to a considerable societal burden (2). Notably, it is well established that brain structural damage is a typical and stable neuropathological feature of PD (3). Nevertheless, the genetic mechanisms underlying this neurobiological phenotype are far from being understood. The purpose of this study was to explore the genetic mechanisms underlying gray matter volume alterations in PD.Methods
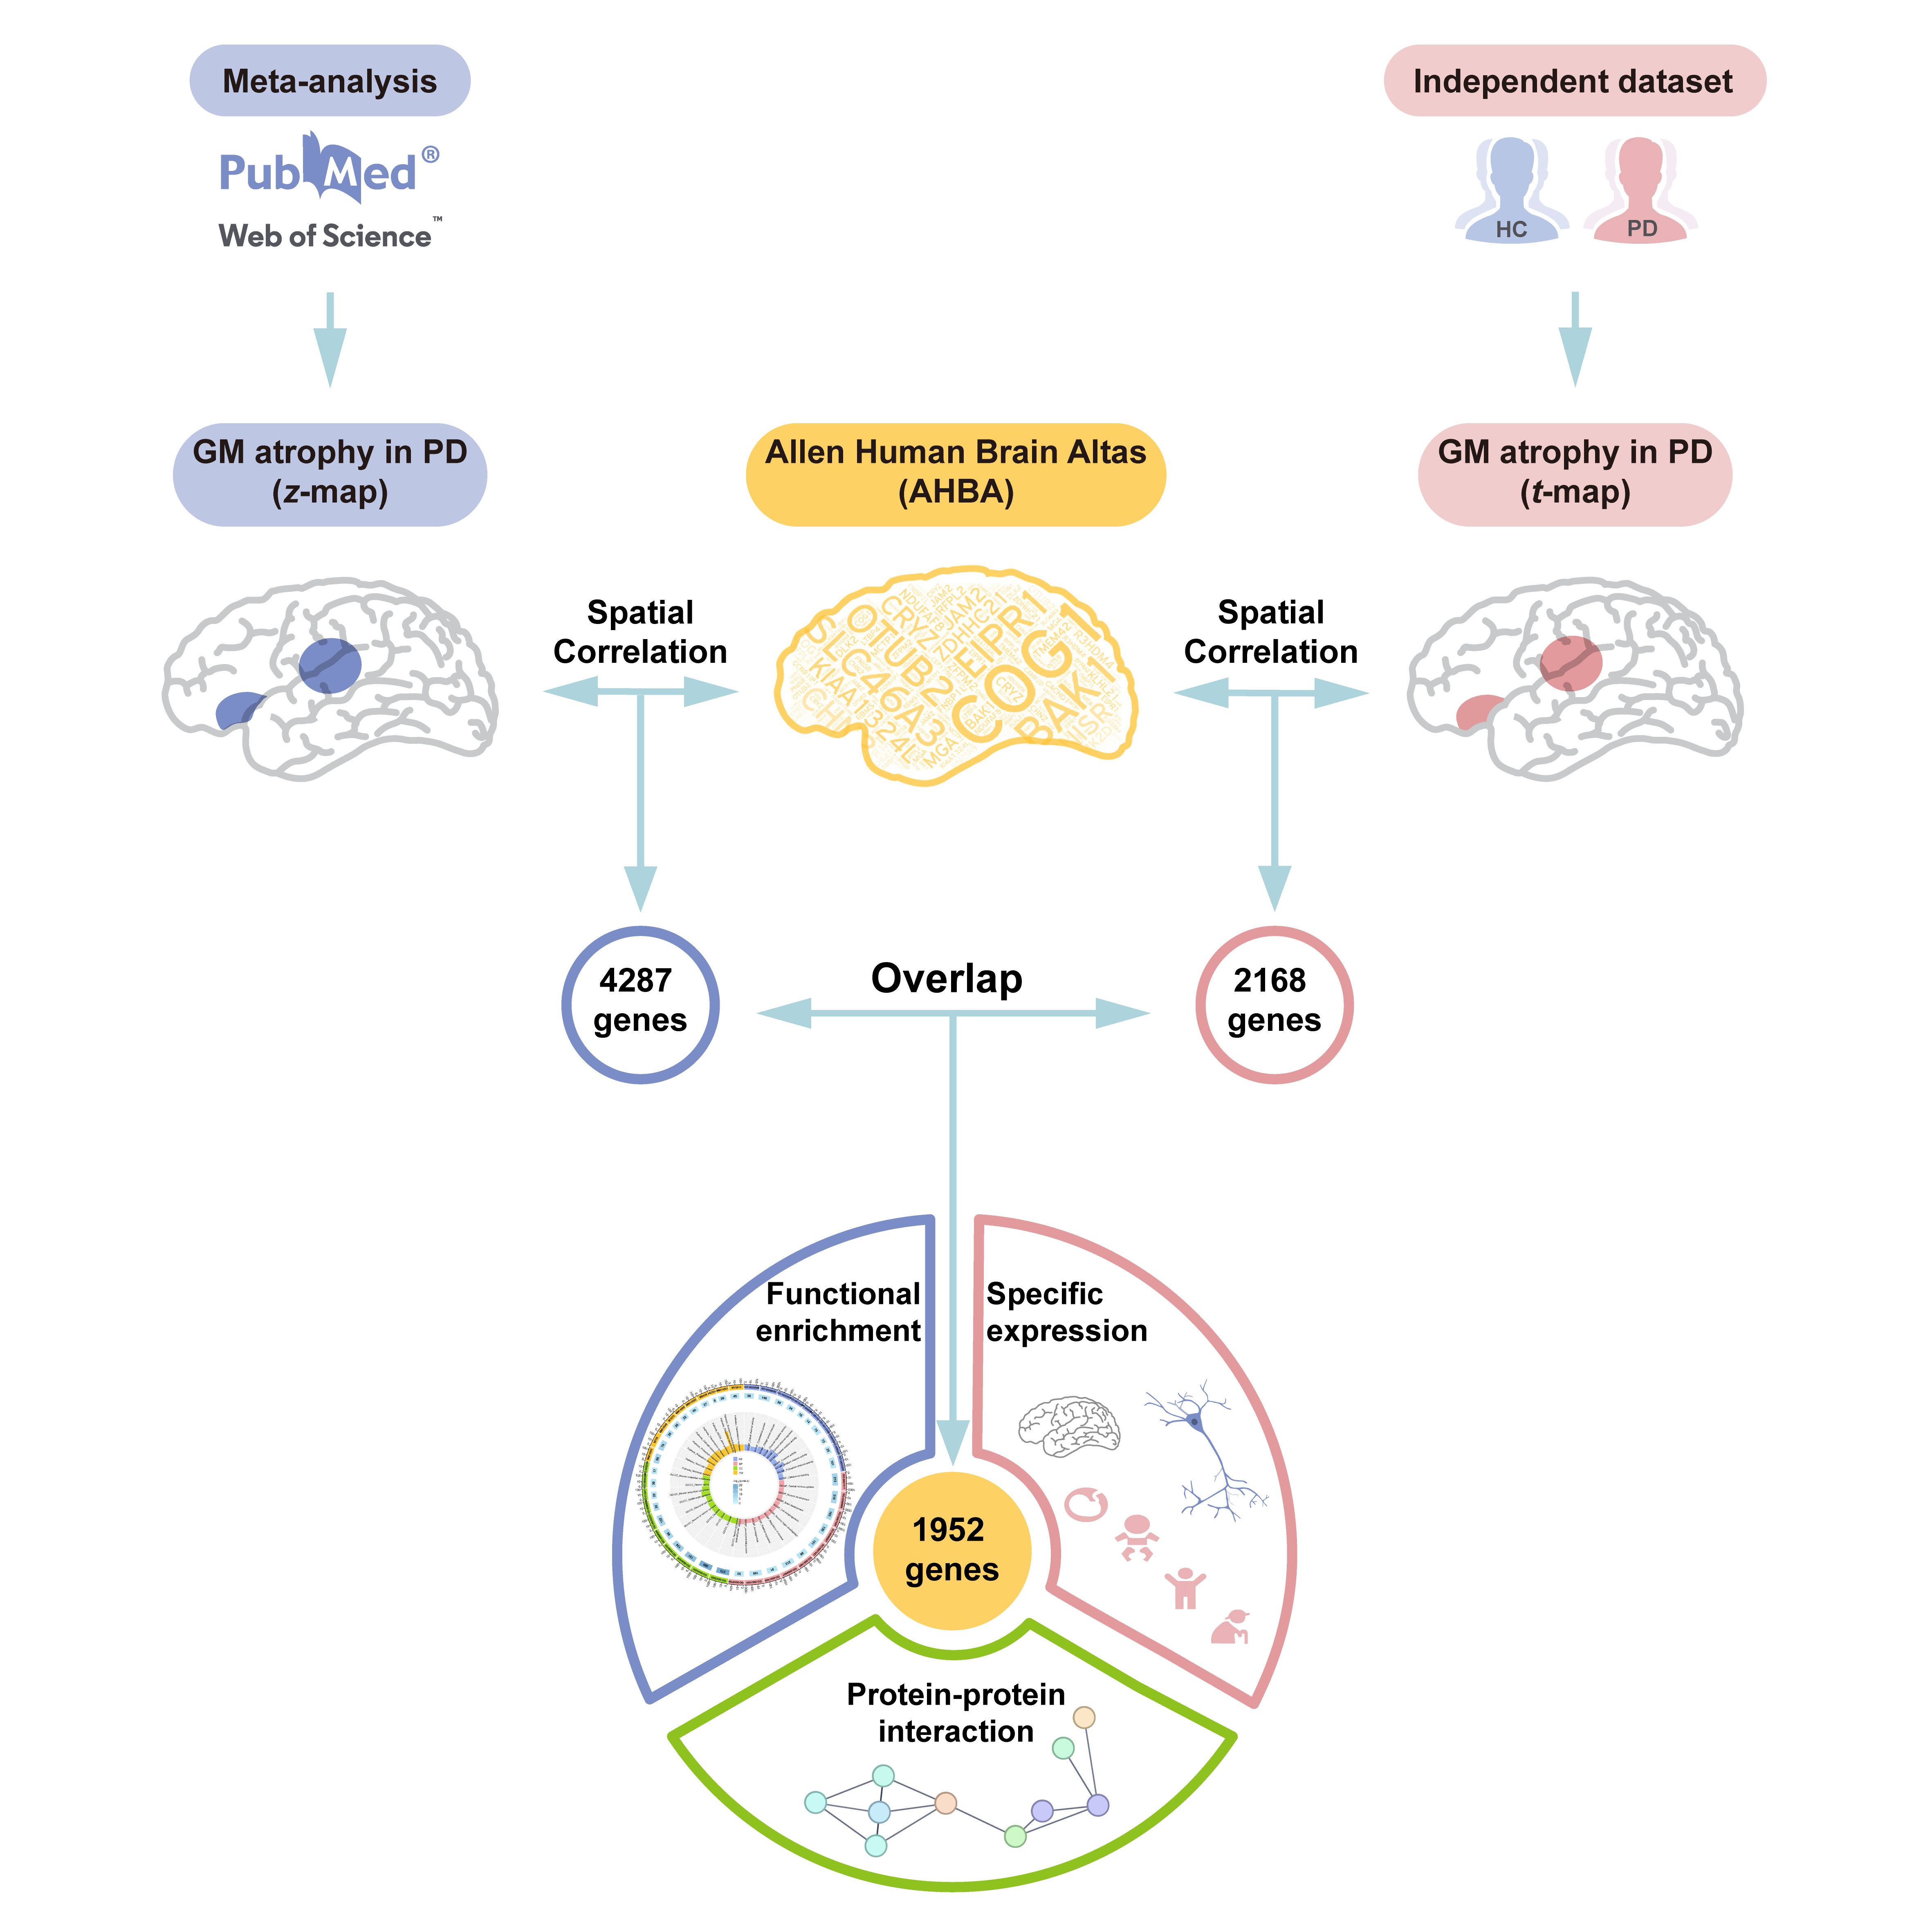
To achieve this goal, we first conducted a neuroimaging meta-analysis as well as a VBM study in an independent dataset to investigate GMV changes in PD. We carried out the mete-analysis following the PRISMA guidelines (4), resulting in the final map of GMV differences (z map) between groups for all included studies.Also, we recruited 48 PD patients and 26 healthy controls (HC) from the Affiliated Wuxi People's Hospital of Nanjing Medical University, acquiring Magnetic resonance images using a 3.0T MRI scanner (Magnetom 3T Siemens, Prisma, Germany).
Furthermore, we combined the Allen Human Brain Atlas to perform a transcriptome-neuroimaging spatial association analysis to identify genes whose expression levels were related to gray matter atrophy in PD (5). In order to test the statistical significance of our findings, a spatially-constrained permutation was conducted to determine whether the number of our discovered genes was significantly higher than the random level.
Finally, an array of post-hoc analyses (i.e., functional enrichment, specific expression, protein-protein interaction (PPI) and behavioral relevance analyses) were conducted to investigate the functional features of the identified genes (Fig. 1).
Results
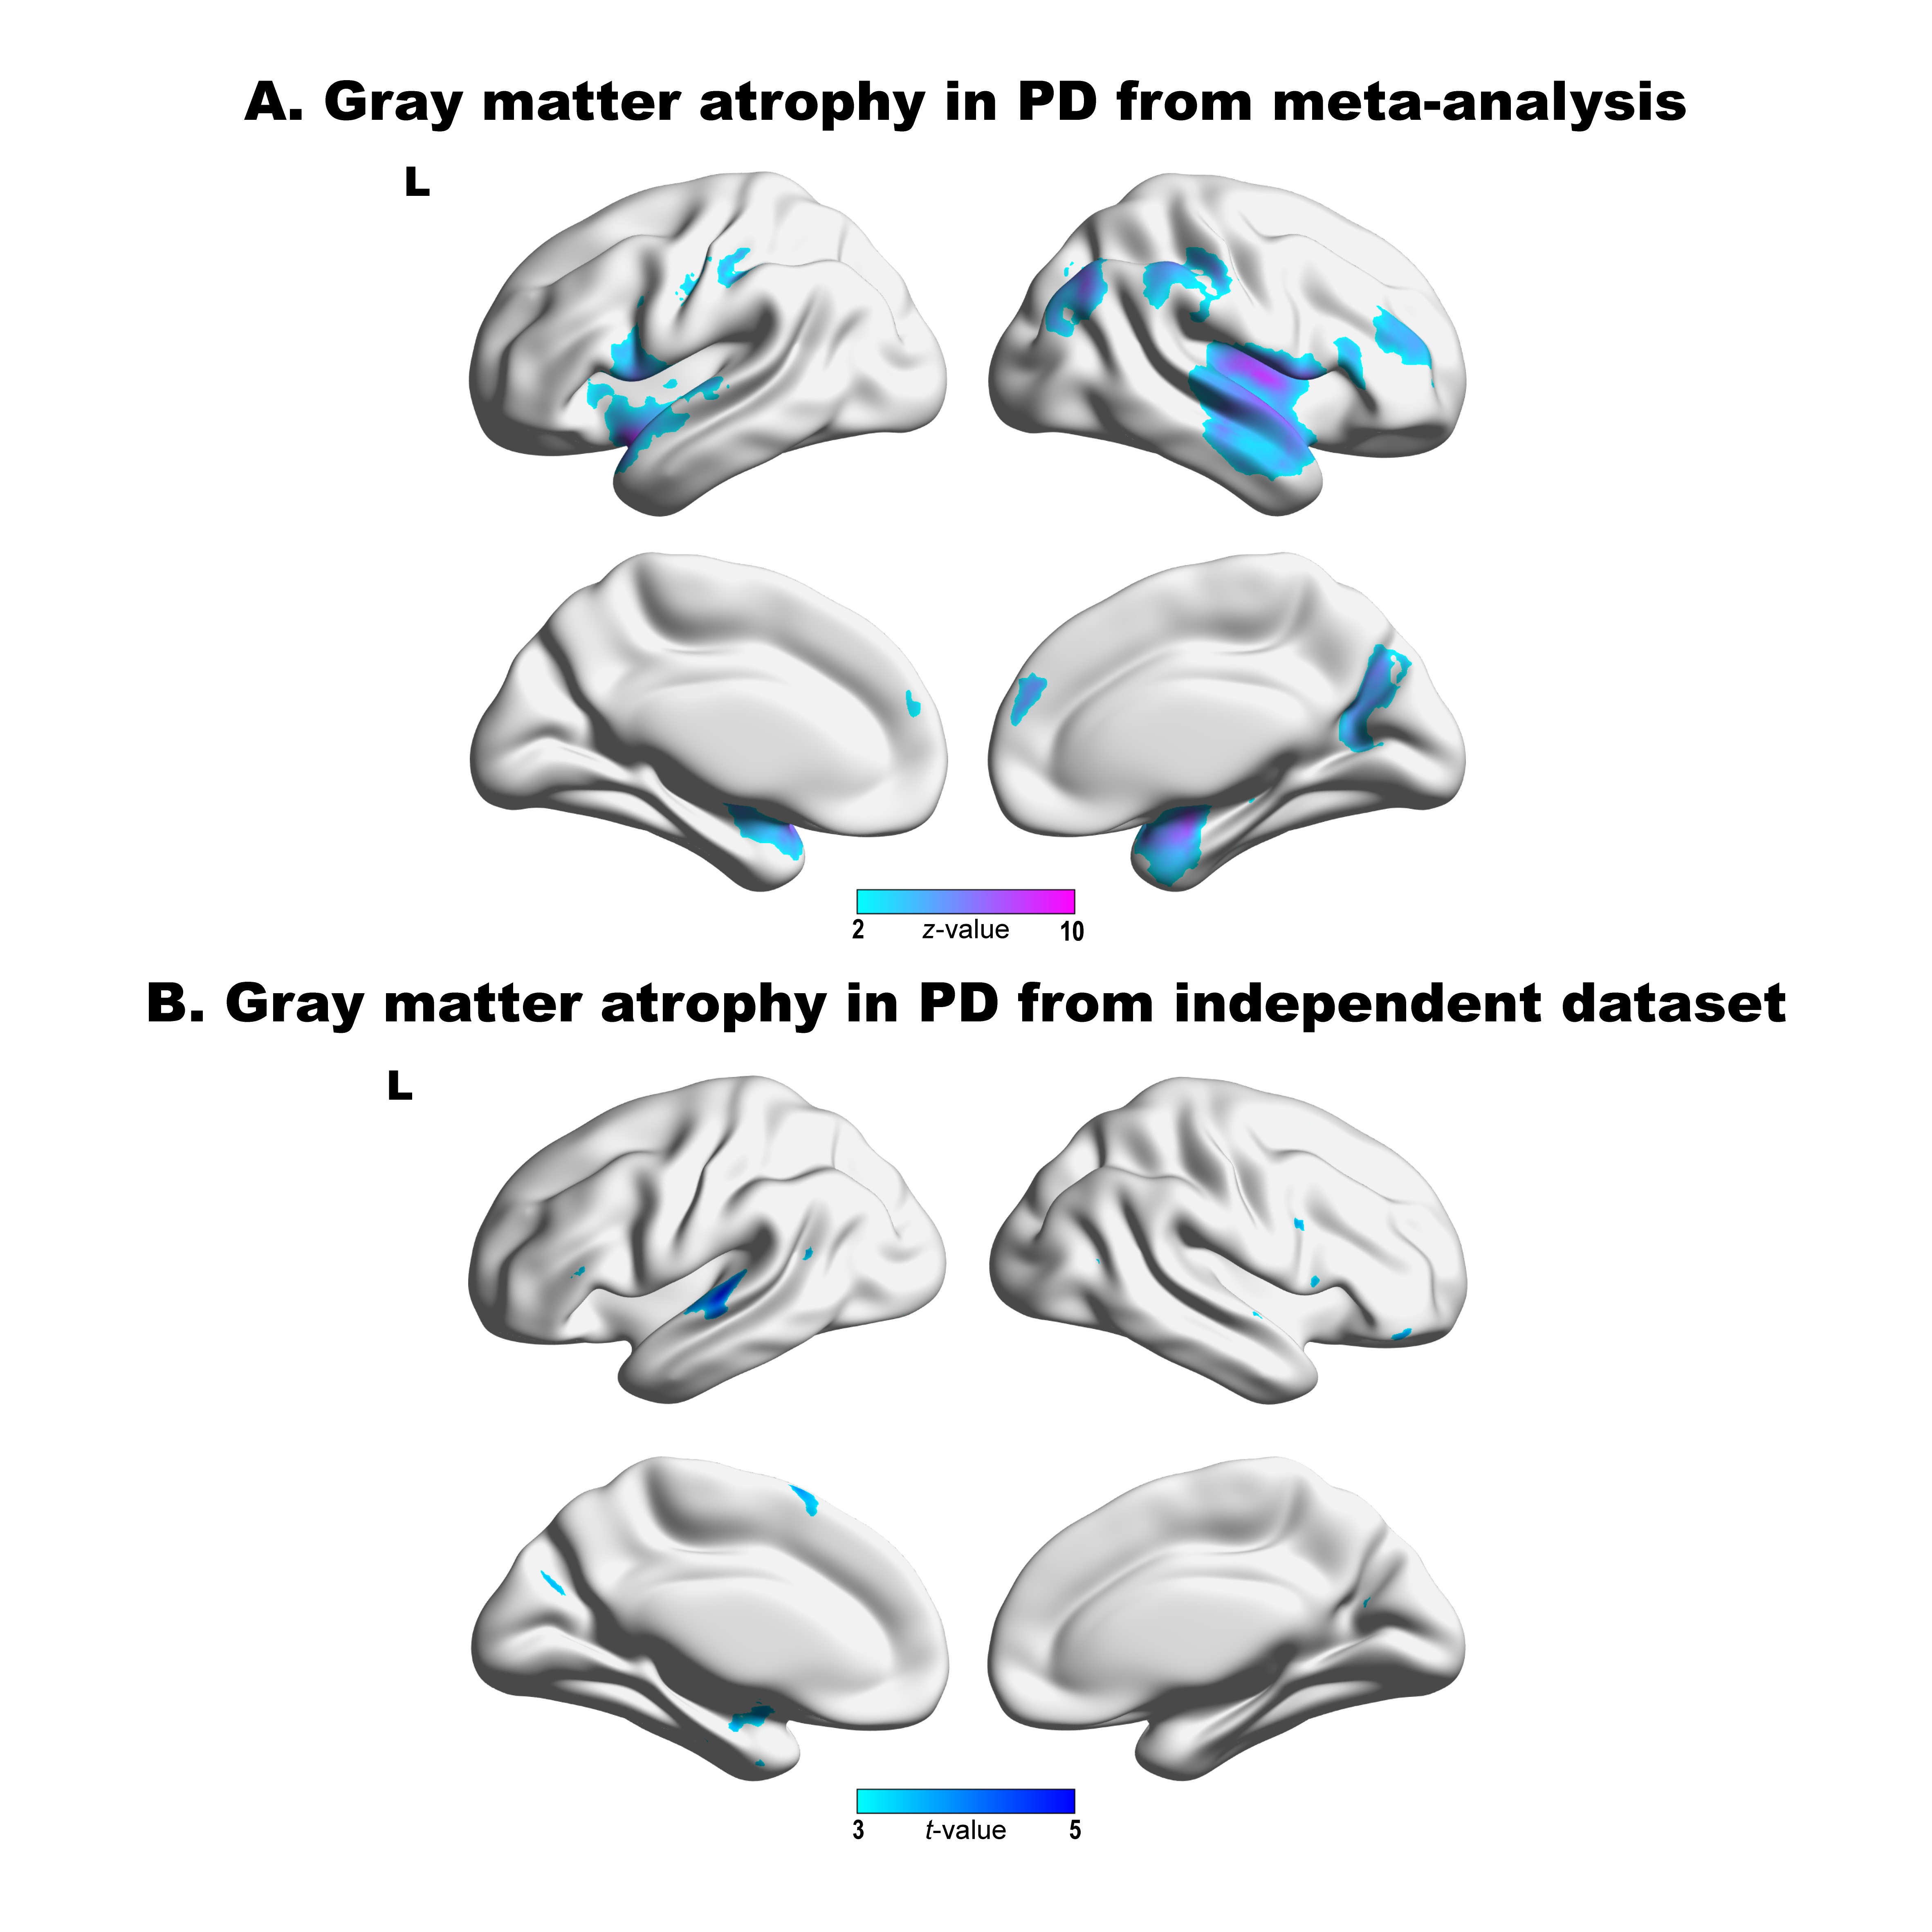
Following the extensive literature review and selection process, 1,831 PD patients and 1,378 HC from 44 studies were included in our neuroimaging meta-analysis, with prominent gray matter atrophy in PD patients (p < 0.05, voxel-level FWE corrected). In independent dataset, the voxel-wise two-sample t test also showed gray matter atrophy comparable to the results in the meta-analysis. Our data showed that PD patients consistently showed significant gray matter atrophy in the superior temporal gyrus (Fig. 2).Furthermore, a spatial correlation study between the transcriptome data and neuroimaging indicated that these gray matter reductions were spatially related to the expression of 1952 overlap genes, which were enriched for a rich range of MFs, BPs, and CCs as well as some biological pathways.
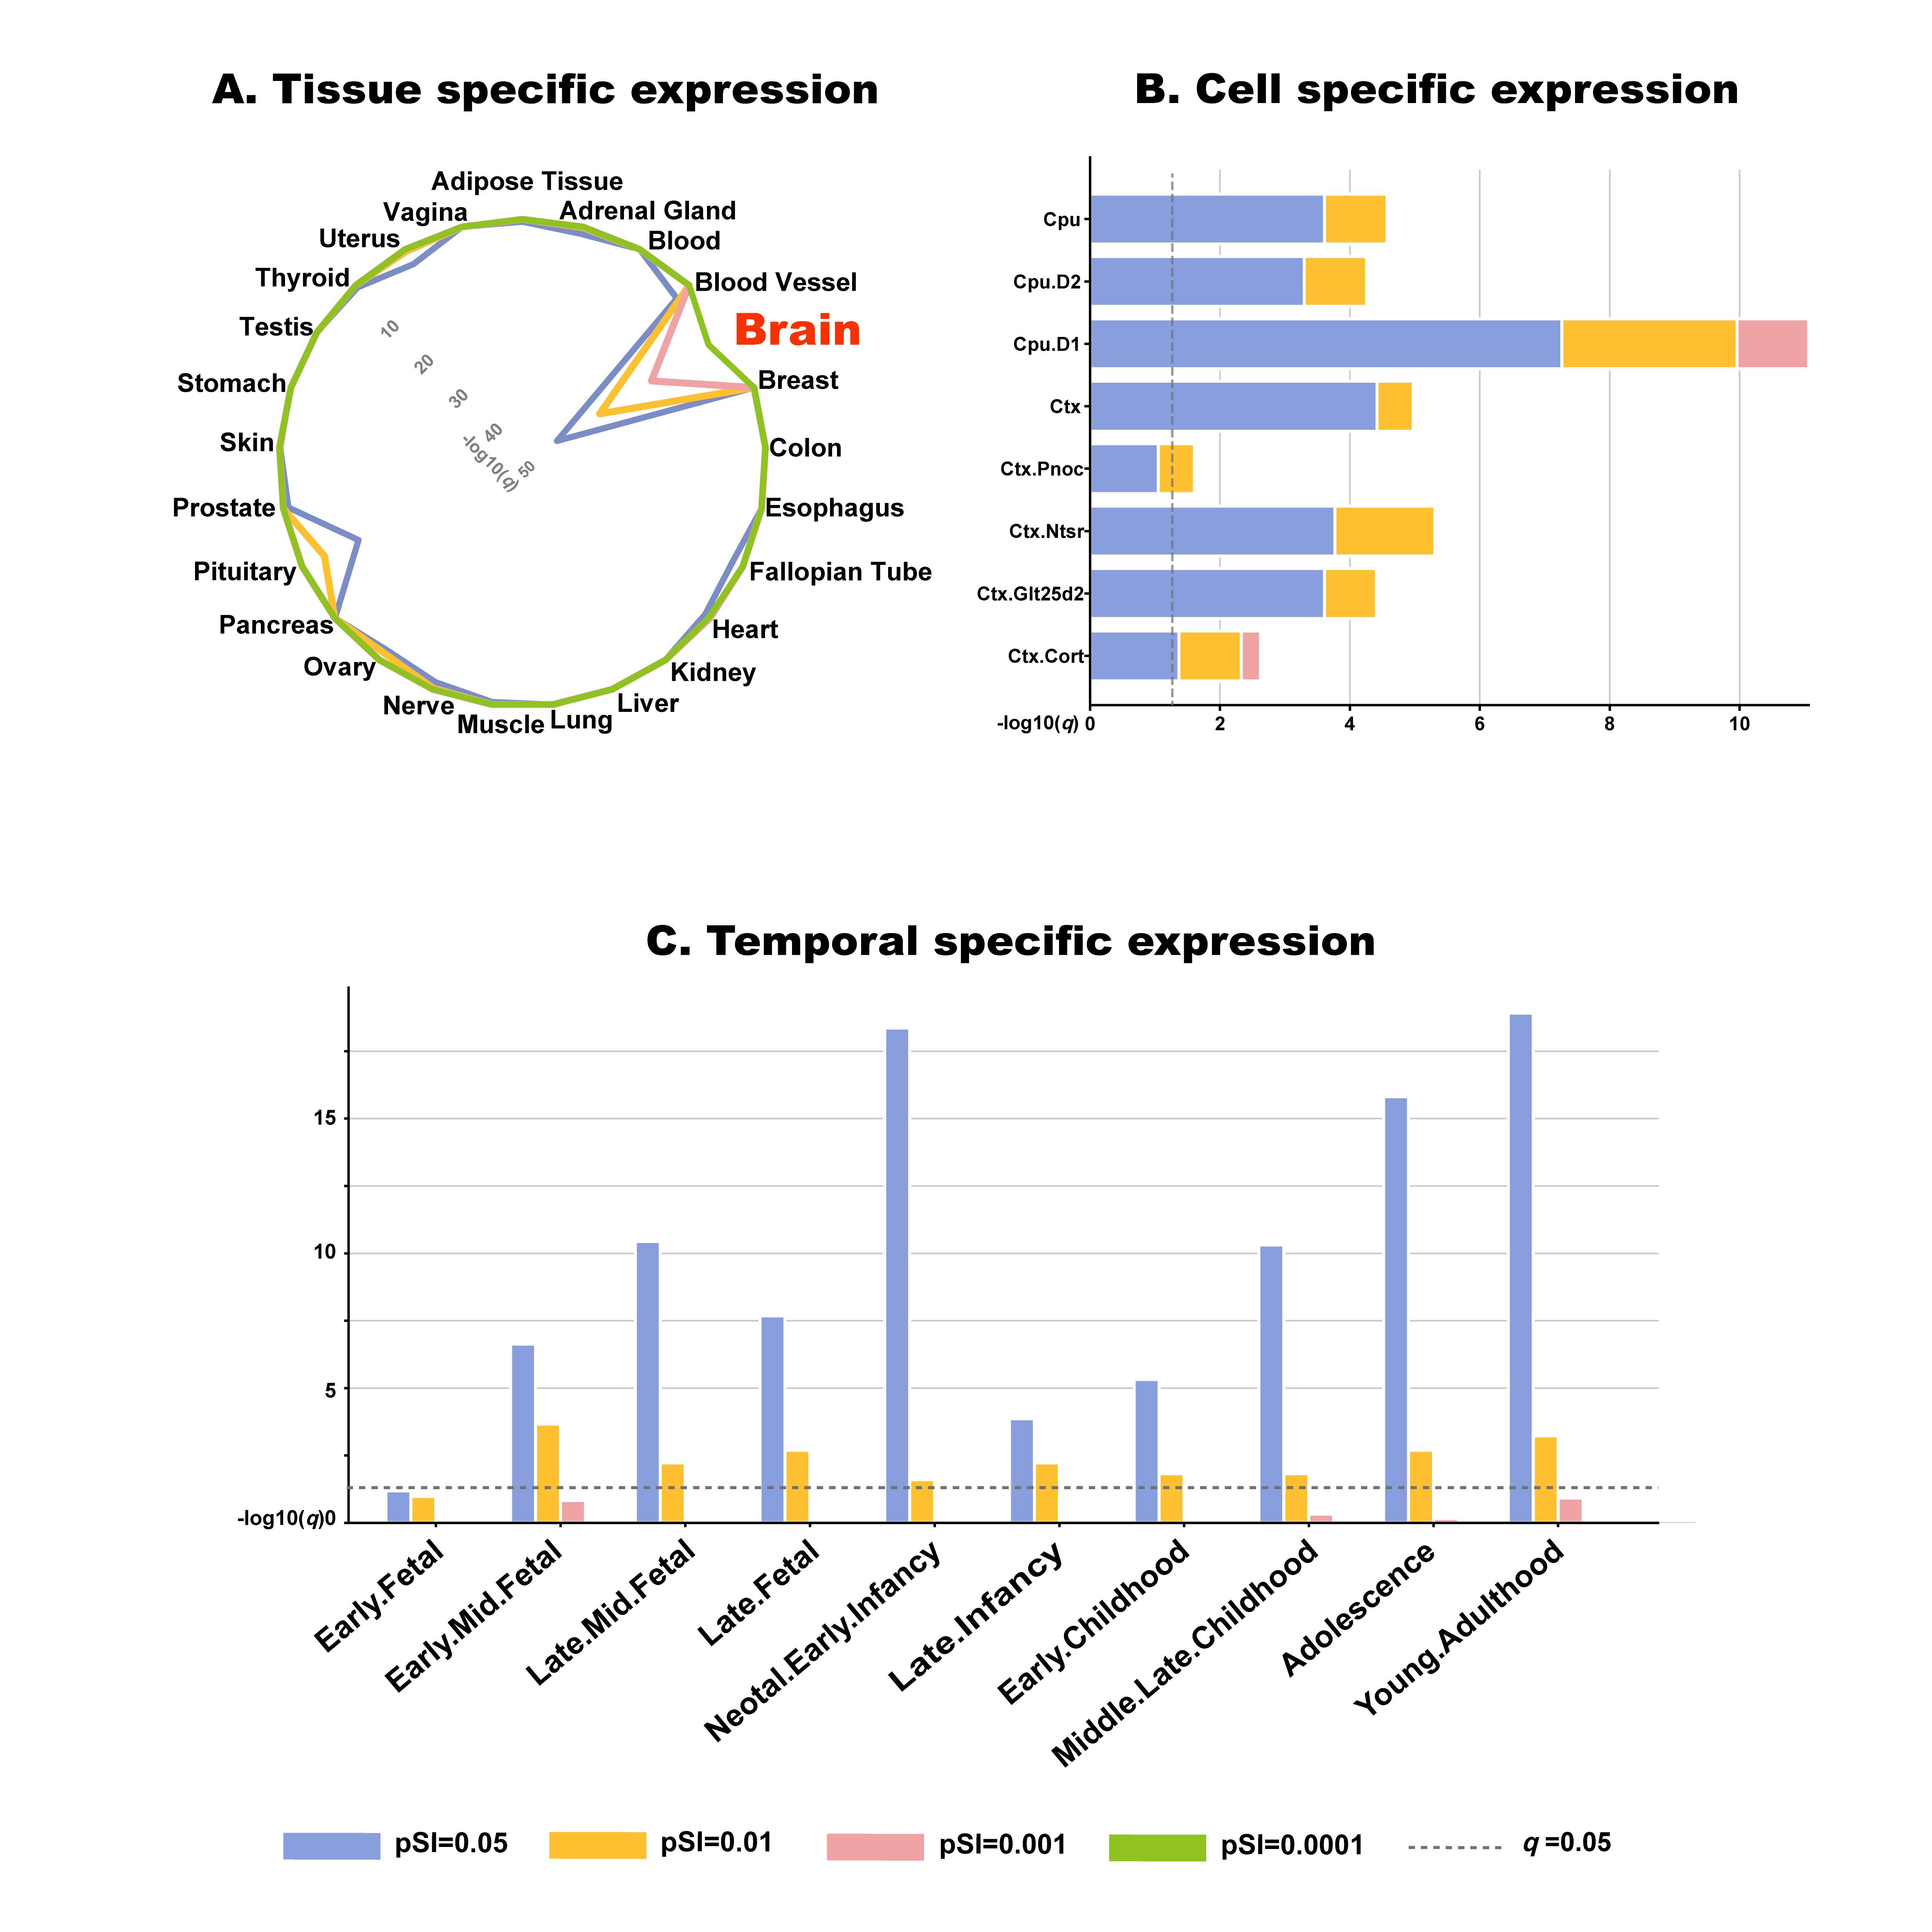
In addition, the genes exclusively expressed in the brain tissue (Fig. 3A), specifically among dopamine receptor cells (Fig. 3B), throughout almost the entire developmental stage (Fig. 3C).
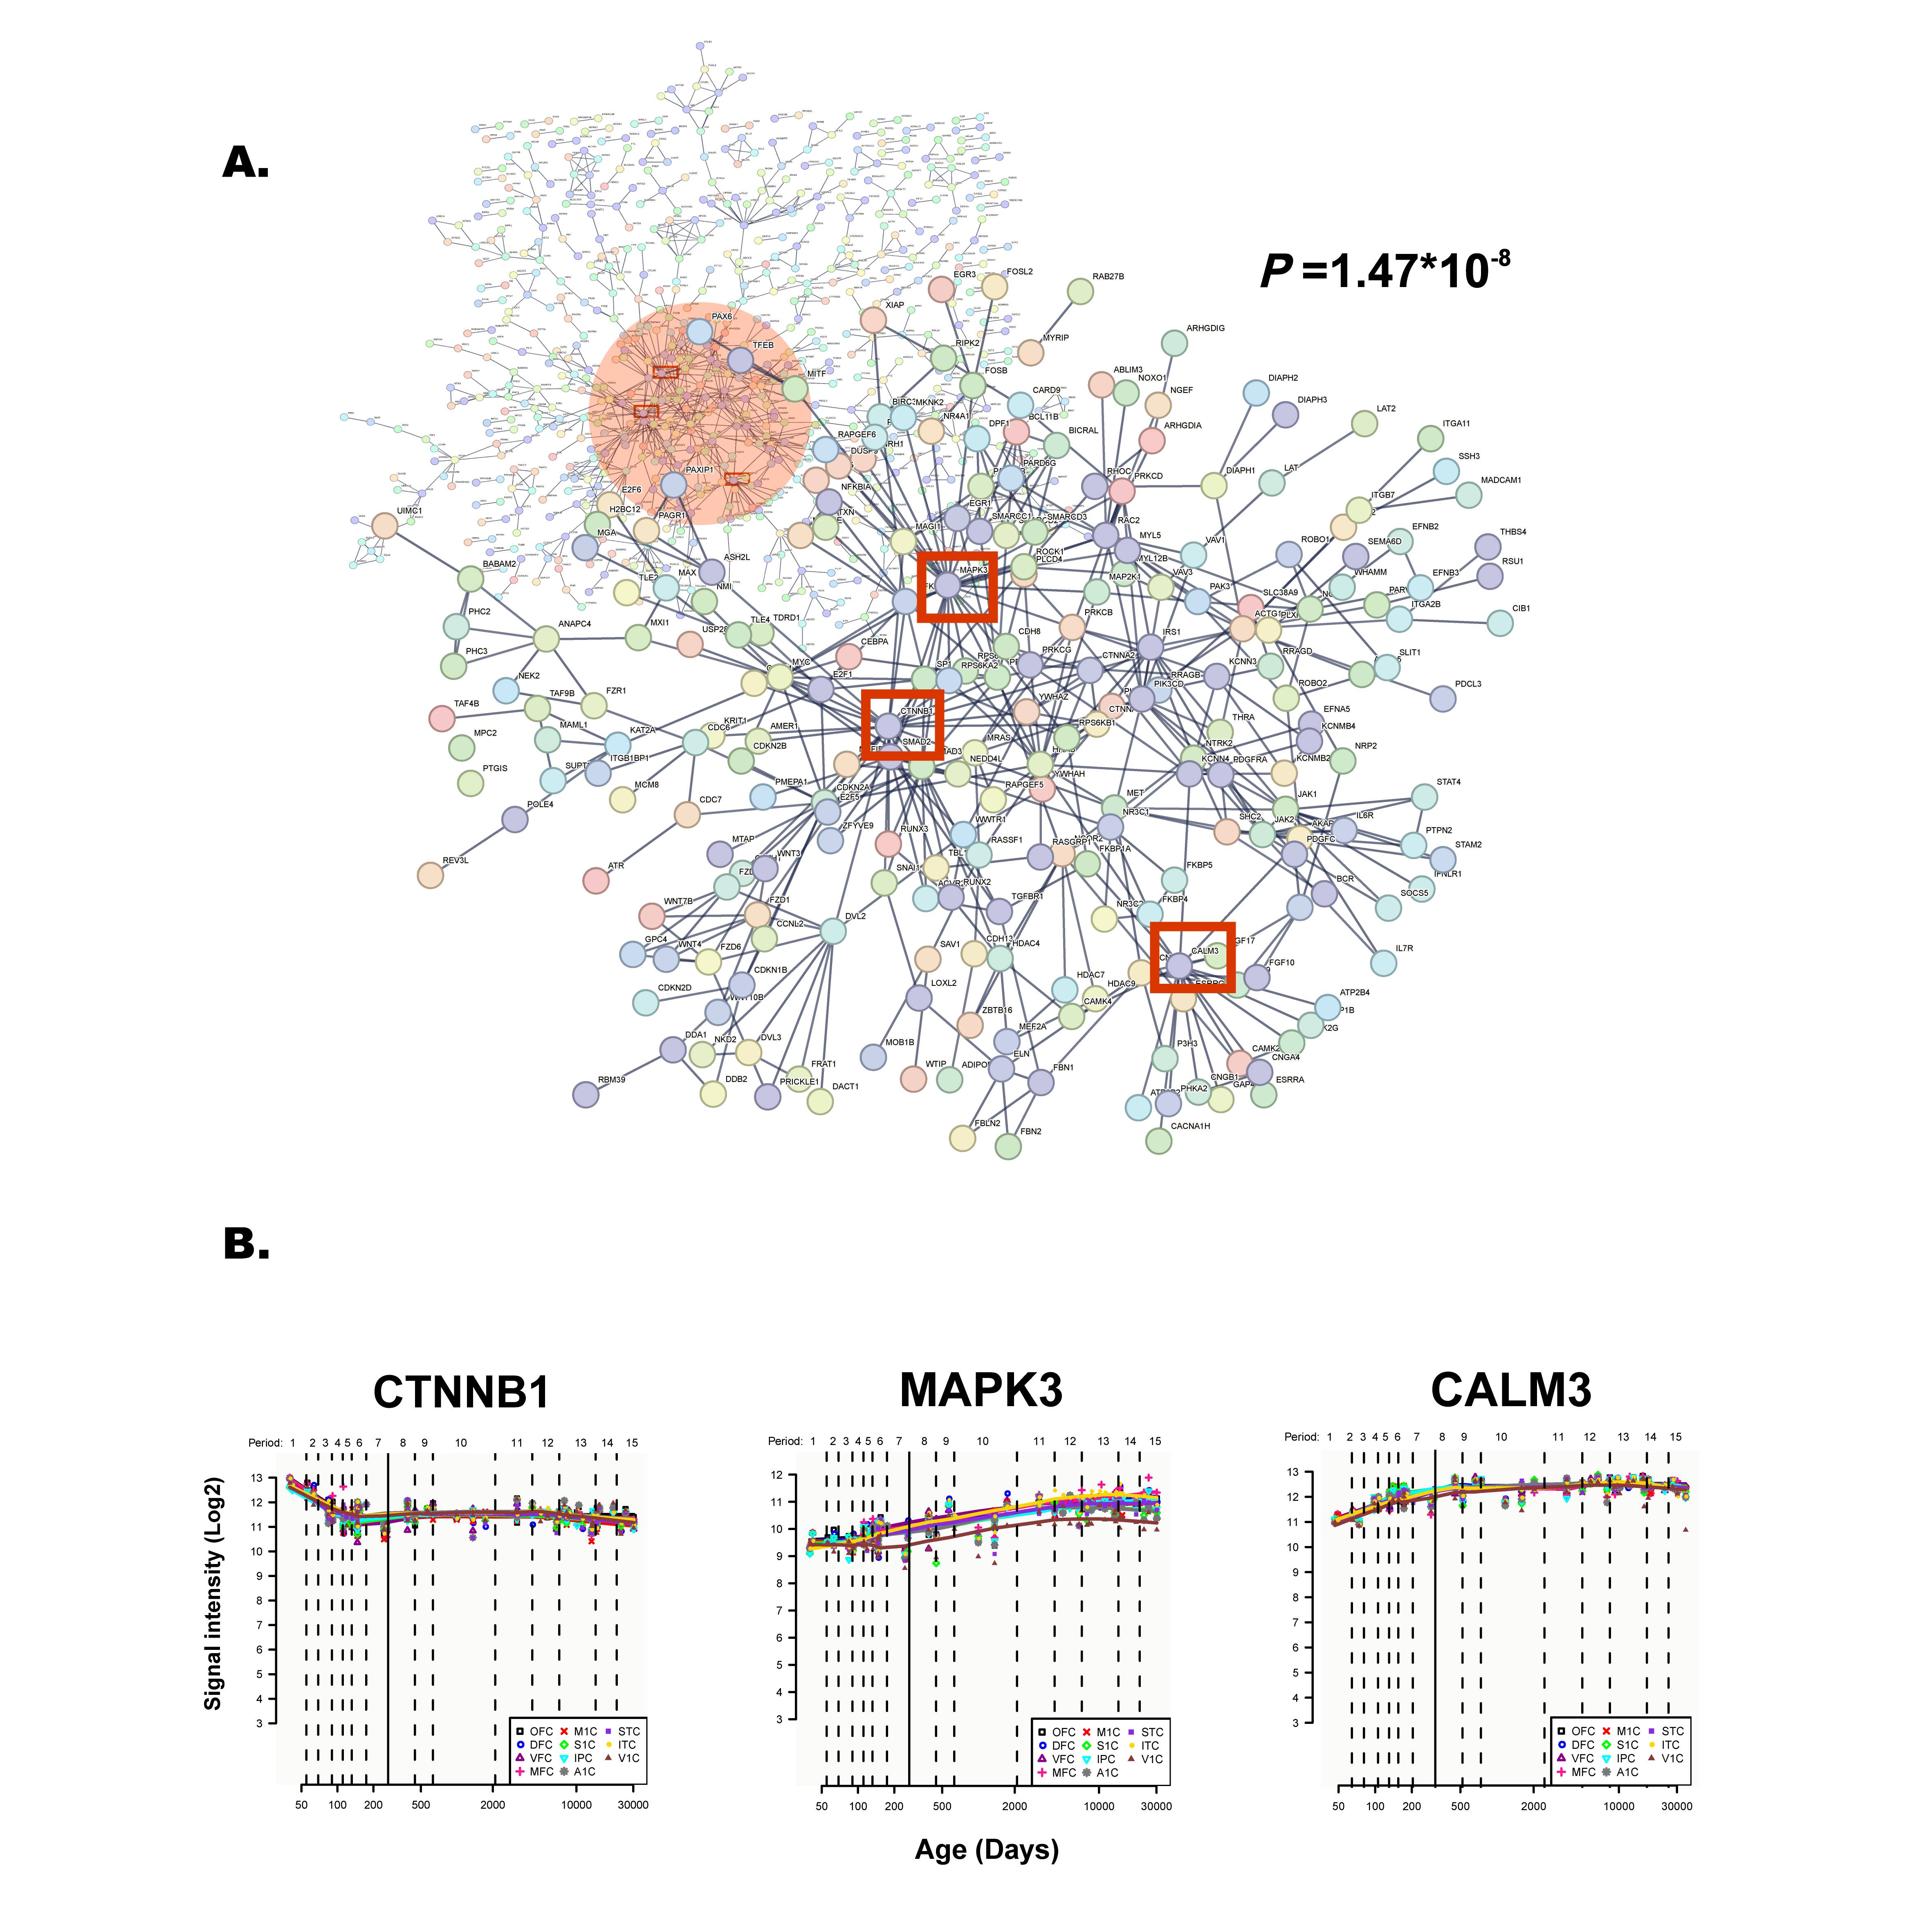
Likewise, these genes showed the potential for creating a PPI network supported by 16 putative hub genes of functional significance (Fig. 4A). In addition, we delineated the spatial-temporal expression trajectory of three hub genes with the highest degree values (i.e., CTNNB1, MAPK3, and CALM3) (Fig. 4B).
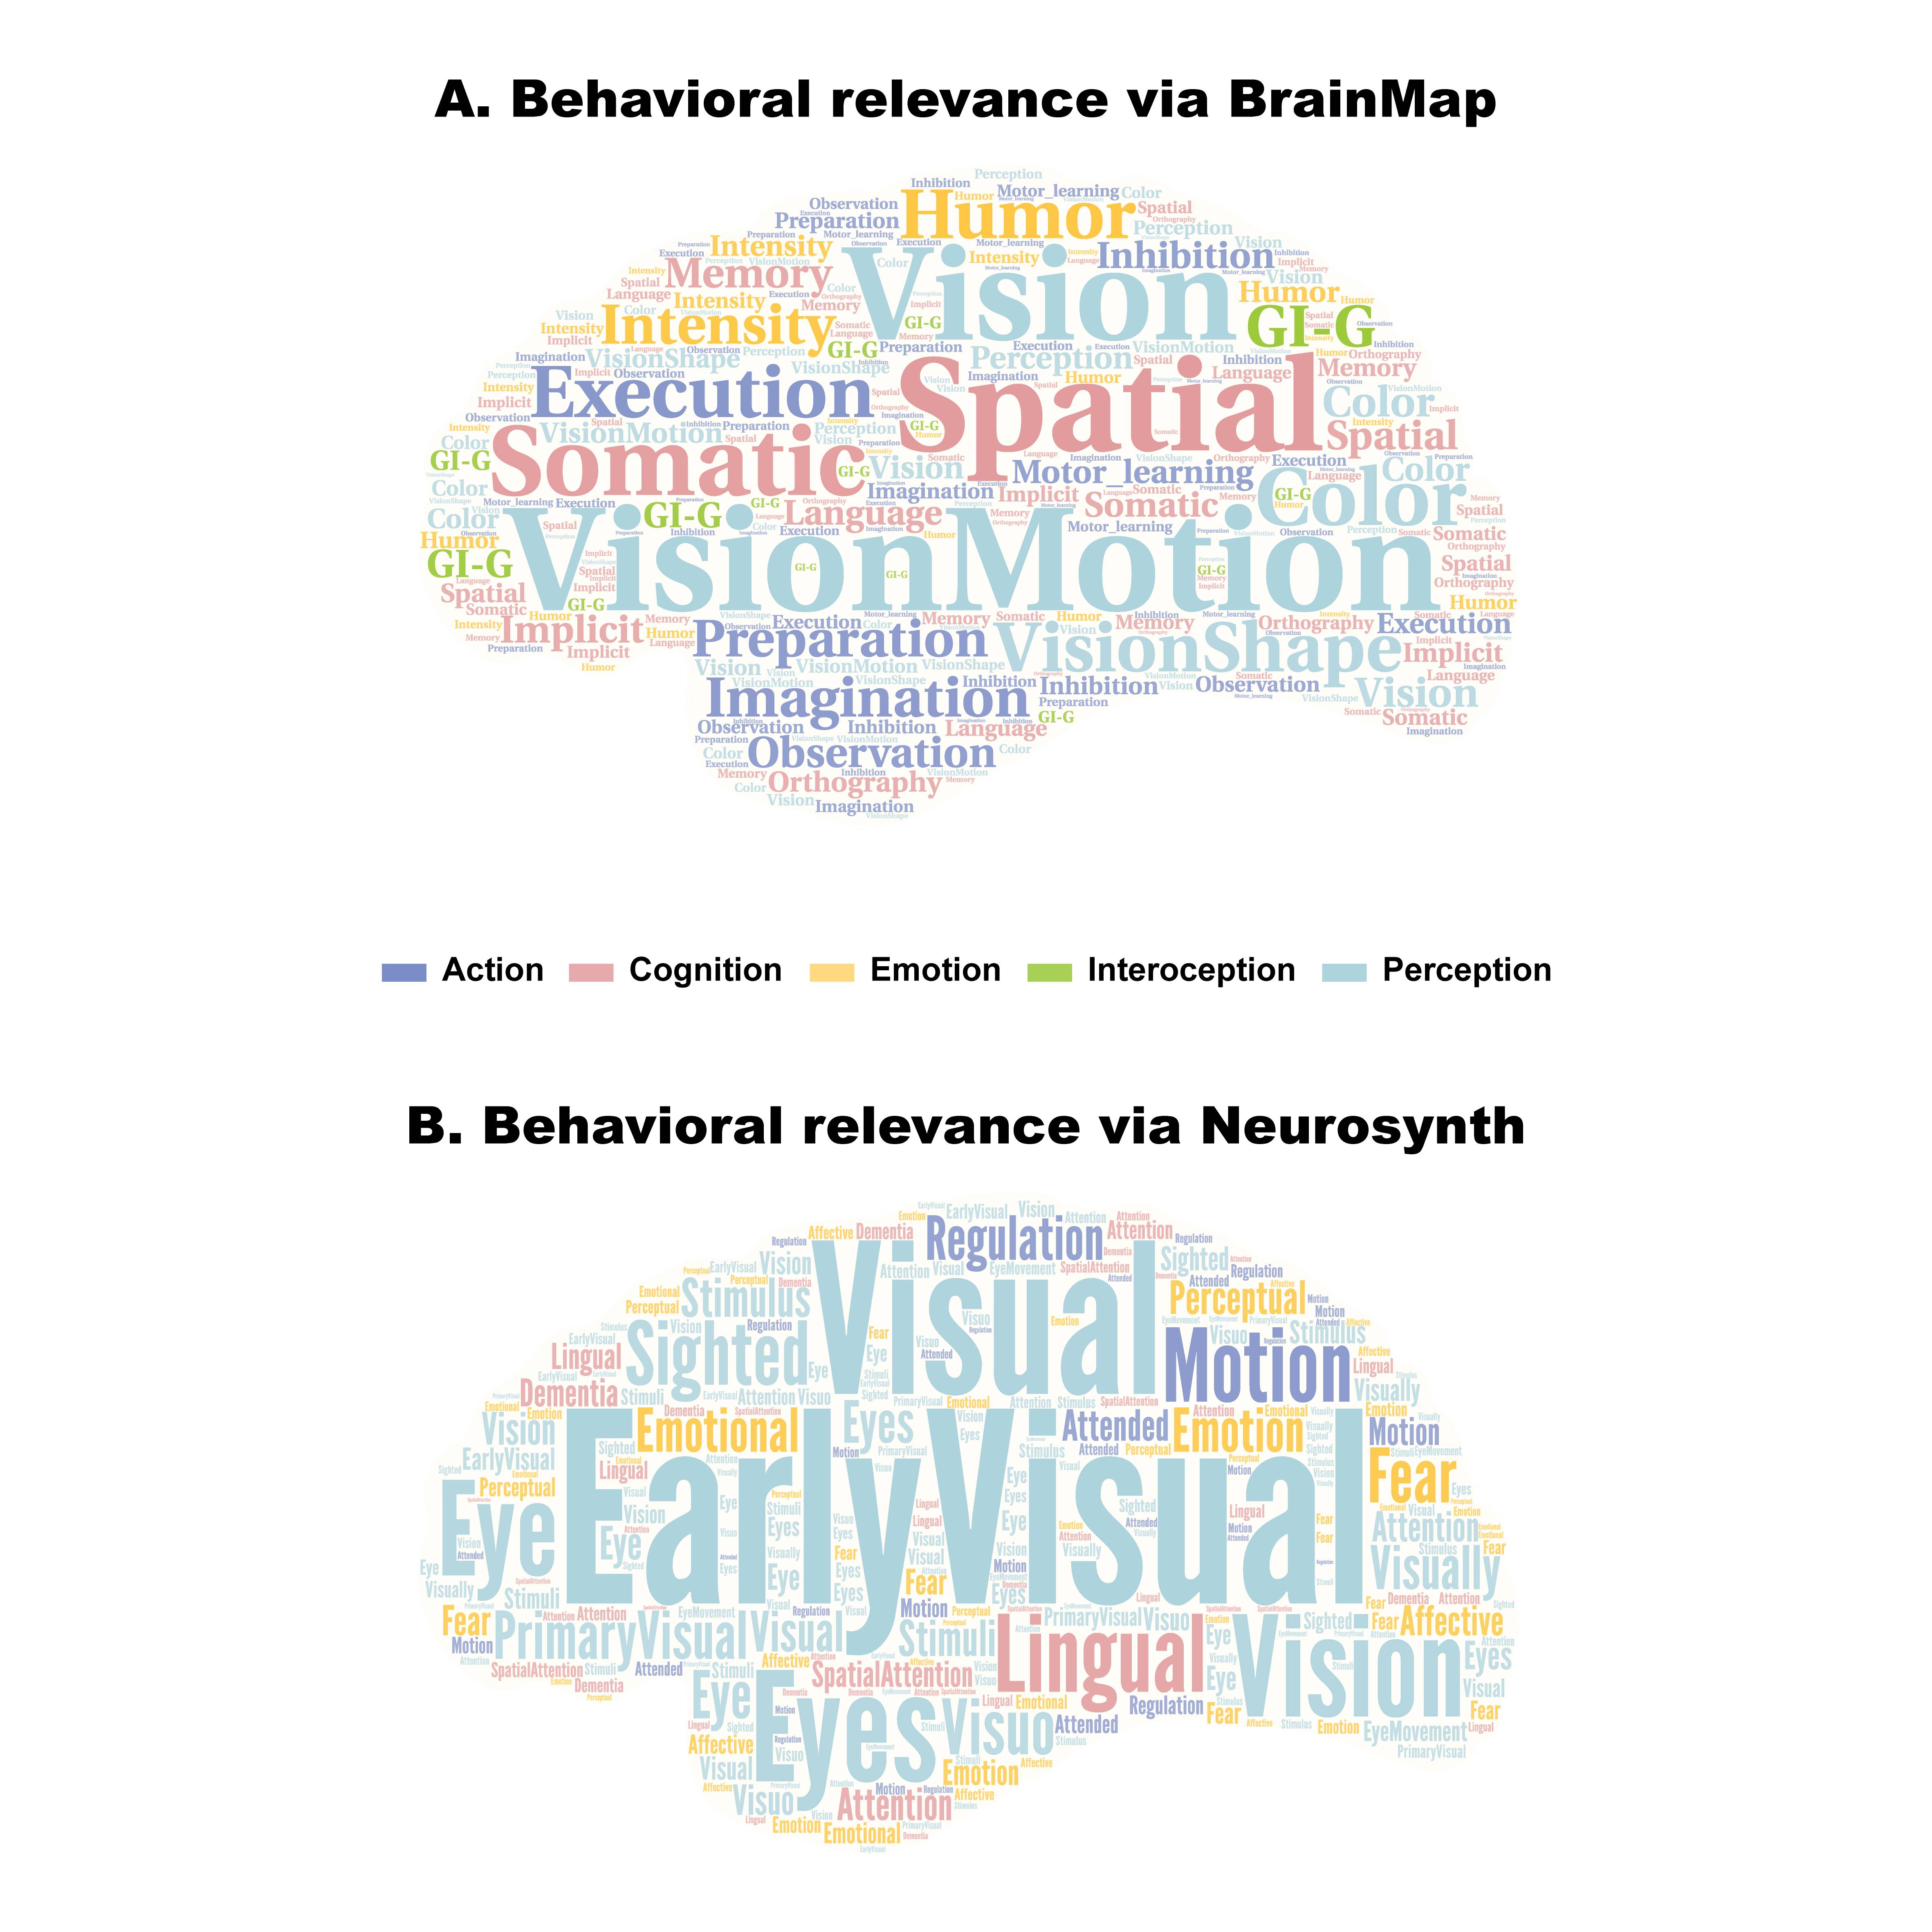
We discovered that the genes linked with gray matter atrophy in PD patients were correlated with an array of behavioral terms, including vision motion, spatial cognition, execution, and intensity emotion by correlating gene expression with behavioral domains using BrainMap (Fig. 5A) along with behavioral domains including early visual, lingual, motion, and regulation (Fig. 5B) via Neurosynth, which were largely consistent with those from the BrainMap.
Discussion
To our knowledge, this is the first study to conduct a combined analysis of brain imaging and gene expression data to shed light on the genetic mechanisms underlying the gray matter atrophy in PD. Overall, our findings indicate that gray matter atrophy in PD could potentially be a consequence of intricate interactions between a complex set of genes, confirming the polygenic nature of this neurological condition.Conclusion
In conclusion, our data revealed prominent gray matter atrophy in patients with Parkinson's disease via combining a comprehensive meta-analysis and an independent dataset analysis. Additionally, we discovered that these gray matter reductions were spatially associated with the expression levels of 1952 genes characterized by a variety of functional characteristics.Our findings may not only offer unique insight into the genetic mechanisms of gray matter atrophy in Parkinson's disease, but also inform novel treatment approaches targeting the molecular substrates underlying brain morphological abnormalities of this disorder.
Acknowledgements
We thank the Allen Institute for Brain Science founders and staff who supplied the brain expression data. We also thank all the subjects who contributed to this study. The authors declare that there are no conflicts of interest relevant to this work. This work was supported by Medical Expert Team Program of Wuxi Taihu Talent Plan (THRC-TD-YXYXK-2021), Wuxi Medical Innovation Team Program (CXTD2021002), Natural Science Foundation of Jiangsu Privence (No. BK20191143, X.M. Fang), National Natural Science Foundation of China (No. 81271629, X.M. Fang).References
1. Bloem BR, Okun MS, Klein C. Parkinson's disease. Lancet (London, England). 2021;397(10291):2284-303.
2. Dorsey ER, Sherer T, Okun MS, Bloem BR. The Emerging Evidence of the Parkinson Pandemic. Journal of Parkinson's Disease. 2018;8(s1):S3-S8.
3. Xu X, Han Q, Lin J, Wang L, Wu F, Shang H. Grey matter abnormalities in Parkinson's disease: a voxel-wise meta-analysis. European Journal of Neurology. 2020;27(4):653-9.
4. Moher D, Liberati A, Tetzlaff J, Altman DG. Preferred reporting items for systematic reviews and meta-analyses: the PRISMA statement. BMJ (Clinical Research ed.). 2009;339:b2535.
5. Arnatkeviciute A, Fulcher BD, Fornito A. A practical guide to linking brain-wide gene expression and neuroimaging data. NeuroImage. 2019;189:353-67.
Figures