4192
Radiomic features of substantia nigra based on multi-echo SWI susceptibility map can distinguish PD from atypical Parkinson syndrome1Department of Radiology, The First Affiliated Hospital, Nanchang University, Nanchang, China, 2MRI research, GE Healthcare, Beijing, China
Synopsis
Keywords: Parkinson's Disease, Parkinson's Disease, atypical Parkinson syndrome, substantia nigra, susceptibility weighted imaging,radiomics
Motivation: The ‘swallow tail’ sign (STS) of substantia nigra (SN) on SWI can distinguish PD from healthy subjects. However, it’s difficult to differentiate PD from APS by visually inspect the STS.
Goal(s): Discriminating PD from APS using the radiomic features of SN extracted from multi-echo SWI susceptibility map.
Approach: 63 PD, 38 APS and 89 healthy controls were enrolled. Five classification models using radiomic features of SN were used and compared.
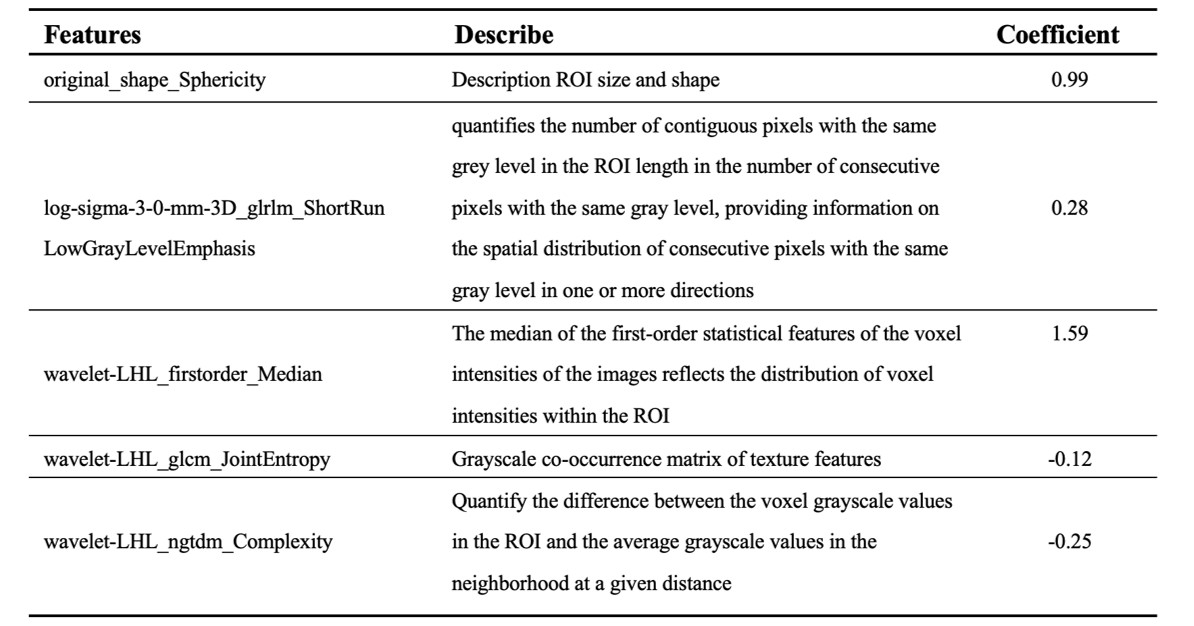
Results: The size, shape, and texture characteristics of SN are the most important features, and
the light gradient-boosting machine model (LGBM) had the best performance in identifying PD, APS, and healthy subjects.
Impact: PD and APS have similar clinical syndrome but were treated differently. Our finding suggested LGBM based on radiomic features of SN can differentiate PD from APS with high accuracy. It would help the treatment selection for PD and APS patients.
Introduction
Parkinsonism is a clinical syndrome characterized by bradykinesia, rigidity, quiescent tremor and postural instability[1]. Idiopathic Parkinson's disease (PD) and atypical Parkinson's syndrome (APS) are the two most common causes of parkinsonism [2]. Generally, APS responds poorly to levodopa therapy[3], and progresses and declines more quickly. In contrast, levodopa can effectively mitigate the symptoms of PD. Therefore, distinguishing APS from PD would be beneficial for treatment selection. The nigrosome-1 (NG1) is hyperintense on iron-sensitive susceptibility weighted imaging (SWI) making the dorsal substantia nigra (SN) resembles ‘swallow tail’ sign (STS) [4]. In PD, STS will become blurring or disappeared on SWI possibly because dopaminergic neuronal loss, neuromelanin loss, or a change in iron storage and oxidation. The STS can differentiate PD from healthy adults even in the early stages of the disease [5-7]. However, it’s difficult to distinguish PD from APS by visually inspect the STS on SWI. Radiomics is an emerging field that refers to the extraction and analysis of high-throughput features from medical images into minimal high-dimensional data [8]. Recently, several radiomic studies of neurodegenerative diseases had shown promising results in diagnosis, classification, and prognostic assessment [9-11]. We hypothesized that radiomic features of SN based on multi-echo SWI can distinguish PD from APS, thereby compensating for the difficulty of visually recognizing the subtle change.Materials and Methods
63 PD, 38 APS, and 89 healthy controls (HC) were enrolled. Multi-echo SWI was acquired using a 3T scanner (SIGNA Pioneer; GE Healthcare, USA). The multi-echo SWI was further processed to generate susceptibility map weighted images (SMWI). The radiomics features of SN were extracted from SMWI using the PyRadiomics package. 166 features passed the t-test. The max-min standardization method was used to standardize the features to eliminate the influence of units and magnitudes between different features and ensure the reliability of the results. To avoid feature overfitting, the least absolute shrinkage and selection operator (LASSO) algorithm was used to filter out the five features with the highest values to avoid feature overfitting. Five classification models, including SVM, SGD, KNN, LGBM and LR, were constructed to identify PD, APS, and HC. The subjects were randomly divided into training and testing groups at a ratio of 7:3.Results
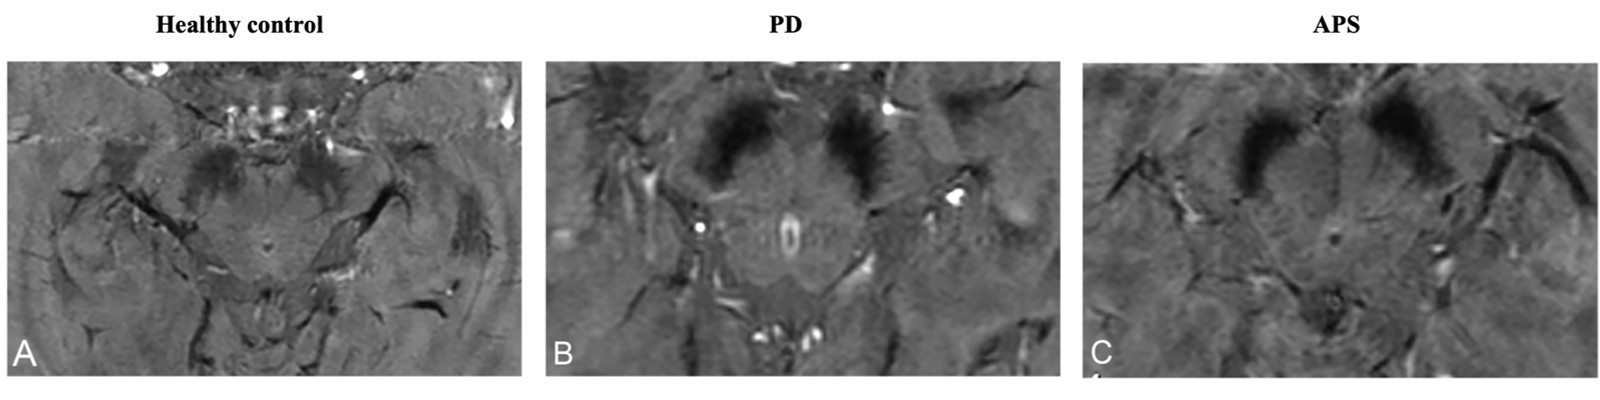
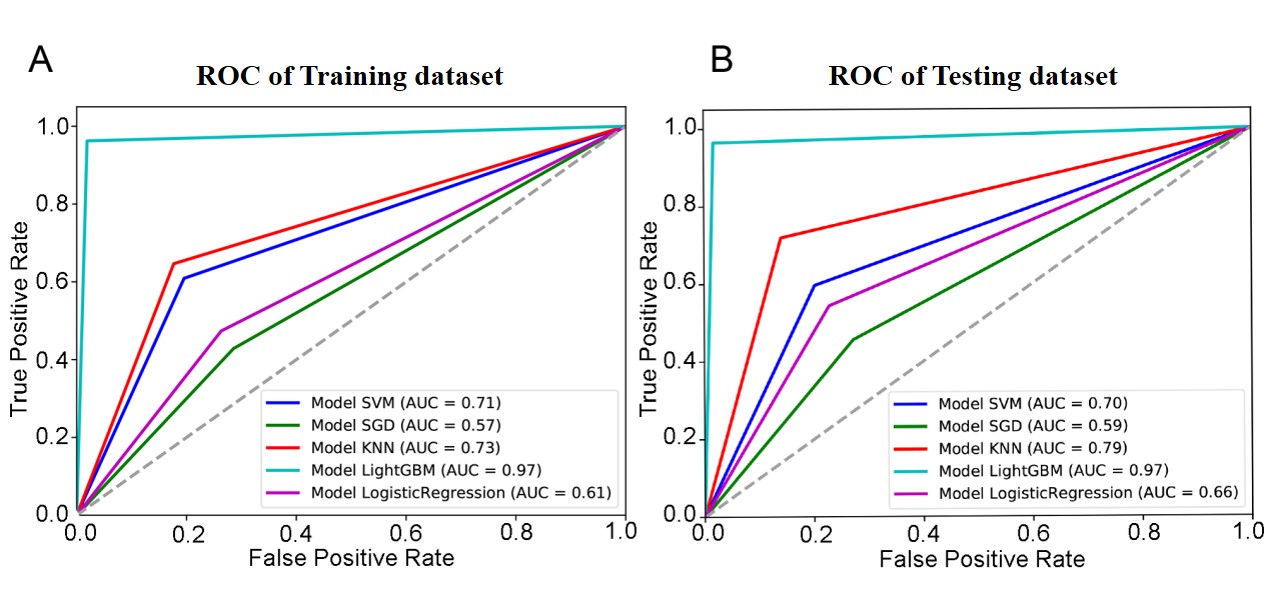
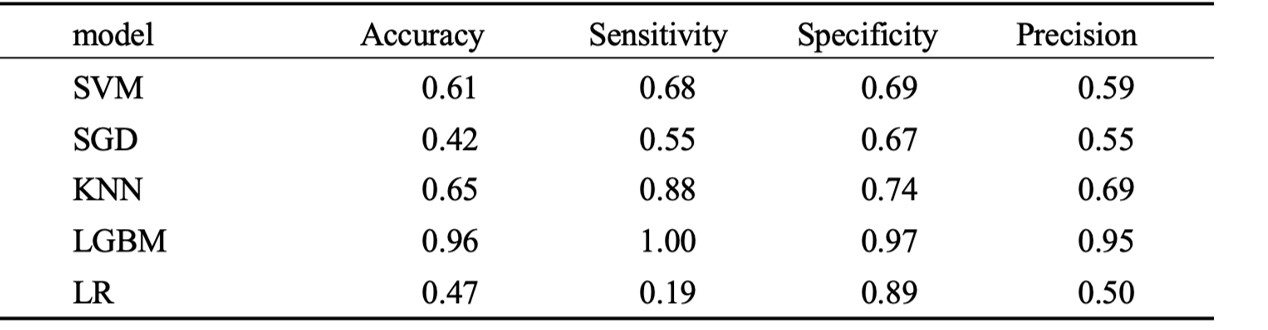
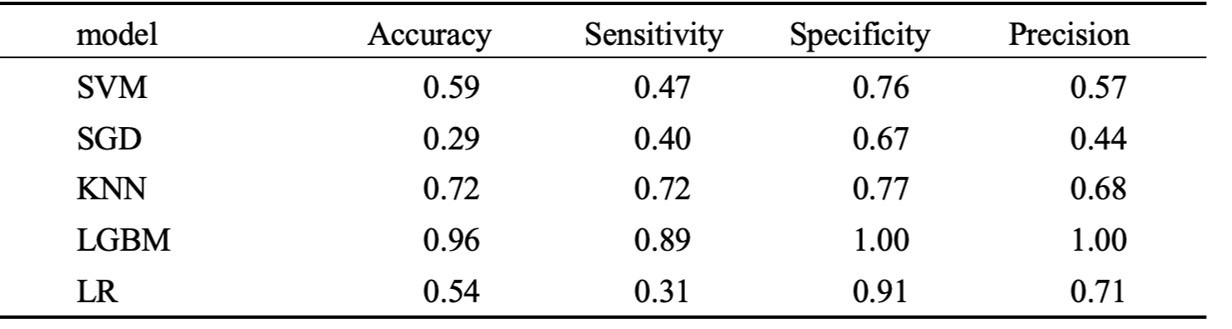
As shown in Figure 1, the STS can be clearly inspected on the SWMI of HC. But it’s difficult to detect on the SMWI of PD and APS. The LASSO results showed five radiomic features of SN can be used to identify PD, APS and HC. These features described the size, shape, and texture characteristics of SN (Table 1). Five models were used to classify AD, APS, and HC using the five features. The results showed the light gradient-boosting machine (LGBM) had the best performance (AUC=0.97) among the five classification models (Figure 2). For the training dataset, LGBM presented with the accuracy of 0.96, sensitivity of 1.00, specificity of 0.97, and precision of 0.95 (Table 2). LGBM also achieved excellent performance for the testing dataset (Table 3).Discussion and Conclusion
In this study, we investigate the role of radiomic features of SN extracted from multi-echo SWI for differentiating PD from APS. Our results show radiomics can detect microscopic differences between PD and APS. Furthermore, our study revealed that the LGBM classifier had best performance in identifying PD, APS, and HC among the five models. This indicates that the radiomic features of SN are different in HC, PD, and APS. The size, shape, and texture characteristics of SN are the most important features for the classification. further indicating that this study has high clinical application and practical value. In conclusion, our study showed the radiomic features of the substantia nigra based on multi-echo SWI can classify PD, APS, and HC. It would be beneficial for guiding PD and APS treatment selection.Acknowledgements
Thanks to all authors for the data collected.References
[1] Bordelon, Y. and A. Keener, Parkinsonism. Seminars in Neurology, 2016. 36(04): p. 330-334.
[2] Armstrong, M.J. and N. McFarland, Recognizing and treating atypical Parkinson disorders. Handb Clin Neurol, 2019. 167: p. 301-320.
[3] McFarland, N.R., Diagnostic Approach to Atypical Parkinsonian Syndromes. Continuum (Minneap Minn), 2016. 22(4 Movement Disorders): p.1117-42.
[4] Schwarz ST, et al. (2014) The “swallow tail” appearance of the healthy nigrosome – A new accurate test of Parkinson’s disease: A case-control and retrospective cross-sectional MRI study at 3T. PLOS ONE 9(4):e93814.
[5] Chau MT, et al. (2020) Diagnostic accuracy of the appearance of Nigrosome-1 on magnetic resonance imaging in Parkinson’s disease: A systematic review and meta-analysis. Parkinsonism Relat Disord 78:12–20.
[6] Kathuria H, et al. (2021) Utility of imaging of Nigrosome-1 on 3T MRI and its comparison with 18F-DOPA PET in the diagnosis of idiopathic Parkinson disease and atypical parkinsonism. Mov Disord Clin Pract 8(2):224–230.
[7] Reiter E, et al. (2015) Dorsolateral nigral hyperintensity on 3.0-T susceptibility-weighted imaging in neurodegenerative Parkinsonism. Mov Disord 30(8):1068–1076.
[8] Gillies RJ, Kinahan PE, Hricak H (2016) Radiomics: Images are more than pictures, they are data. Radiology 278(2):563–577.
[9] Jiang J, et al. (2022) Using radiomics-based modelling to predict individual progression from mild cognitive impairment to Alzheimer’s disease. Eur J Nucl Med Mol Imaging 49(7):2163–2173.
[10] Jiang J, et al. (2022) Using deep learning radiomics to distinguish cognitively normal adults at risk of Alzheimer’s disease from normal control: An exploratory study based on structural MRI. Front Med (Lausanne) 9:894726.
[11] Tang L, et al. (2021) Individualized prediction of Early Alzheimer’s disease based on magnetic resonance imaging radiomics, clinical, and laboratory examinations: A 60-month follow-up study. J Magn Reson Imaging 54(5):1647–1657.
Figures