4191
Quantitative N-Acetylaspartate and Creatine Metabolites in Cortical and Subcortical Regions in PD patients with cognitive impairment1Department of Radiology, Affiliated Hospital of Guizhou Medical University, Guiyang, China, 2Department of Clinical and Technical Support, Philips Healthcare, Xi'an, China, 3Department of Clinical and Technical Support, Philips Healthcare, Shanghai, China
Synopsis
Keywords: Parkinson's Disease, Metabolism
Motivation: N-acetylaspartate (NAA) and creatine (Cr) are two brain metabolites implicated in neuronal functions. The potential role of MRS as in vivo molecular imaging biomarker is controversial.
Goal(s): Quantitative the concentration of NAA and tCr of posterior cingulate gyrus (PCC) and Thalamus (Tha) in Parkinson’s disease patients with (PDCI) and without mild cognitive impairment (PDN).
Approach: Single voxel 1H-MRS technology combined with Lcmodel software were used.
Results: Patients with PDCI showed significantly reduced concentrations of NAA and tCr both in PCC and left Tha regions. Both in PCC and left Tha, the reduction of NAA accompanying with decreasing of tCr.
Impact: Comparison of PCC and Tha MRS profiles across cognitive impairment provides useful information for tracking cognitive decline in PD progress. Cortical (via PCC) and subcortical (via Tha) NAA and tCr are promising biomarkers in characterizing PD cognitive stage deficits.
Abstract
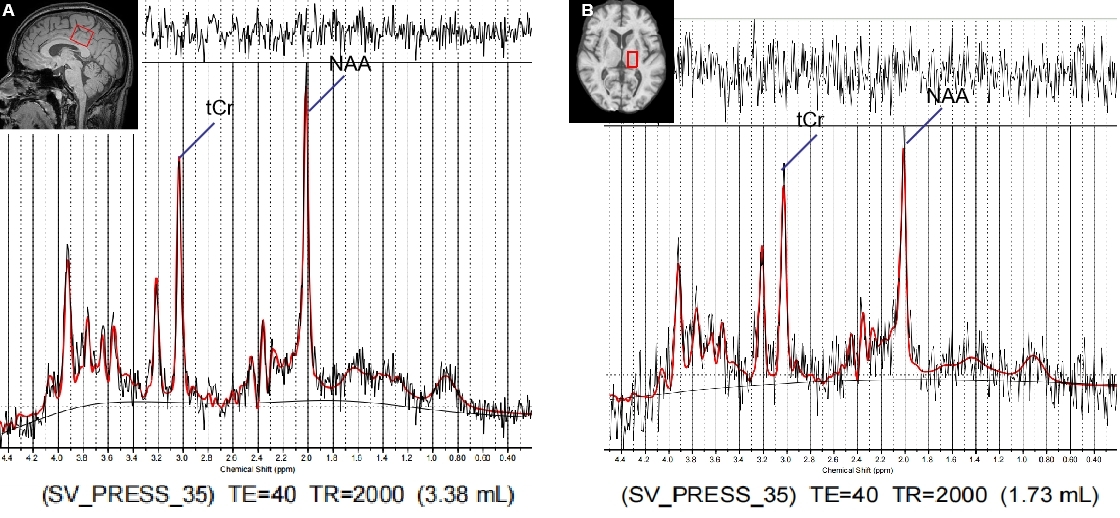
Introduction N-acetylaspartate (NAA) and creatine (Cr) are two brain metabolites involved in the energy metabolism of neurons within the brain[1,2]. Parkinson’s disease (PD) is a commonly diagnosed neurological disorder with a total of 60% dopaminergic neurons have died when the typical clinical manifestations occur[3,4]. Most Parkinson's disease (PD) patients often experience cognitive impairment, and eventually dementia[5,6]. Posterior cingulate cortex (PCC) and thalamus (Tha) are two regions that involved in multiple cognitive processes[7,8]. So, in this study, we were desired to detect the absolute concentration of metabolites of PCC and Tha regions in Parkinson’s disease patients with (PDCI) and without (PDN) mild cognitive impairment, to explore the potential role of MRS as in vivo molecular imaging biomarker for early diagnosis of PDCI and for monitoring the efficacy of therapeutic interventions.Materials and methods 18 PDN patients (7 females, age: 62.3 ±13.2), 20 PD patients with MCI (10 females, age: 64.6 ± 12.3) and 25 healthy older controls (18 females, age: 54.3 ± 10.3) underwent two regions single voxel 1H-MRS. The 1H-MRS protocol was performed at 3 T using a Philips Achieva MRI system. Data were collected from 3.83 /1.73ml voxels of interest (VOI) located in a portion of the PCC and left Tha. Data acquisition used PRESS sequences with 2048 samples, spectral band width of 2000 Hz, and 128 acquisitions, using TR/TE = 2000/40 ms for total creatine (tCr), N-acetylaspartate (NAA) (Fig. 1). These two metabolites were quantified using LCModel (Version 6.3, Steven Provencher, Oakville, ON, Canada). Te concentrations of neurometabolites were estimated by fitting the obtained spectrum to a linear combination of the ’basic spectrum’ of each neurometabolite, Signals within the chemical shift range of 0.0–4.4 ppm were obtained. Only the fitting results of Cramér–Rao lower bound<15% were considered.
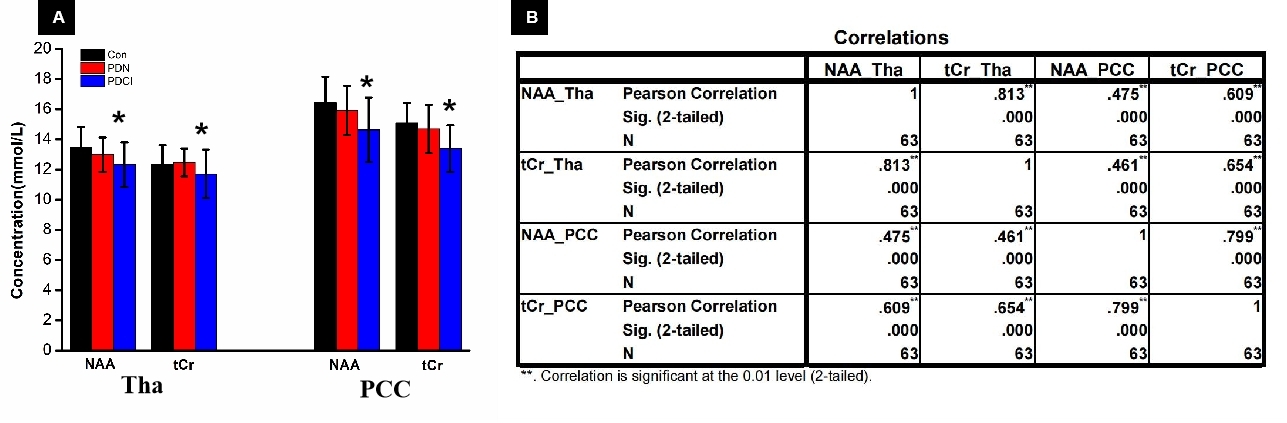
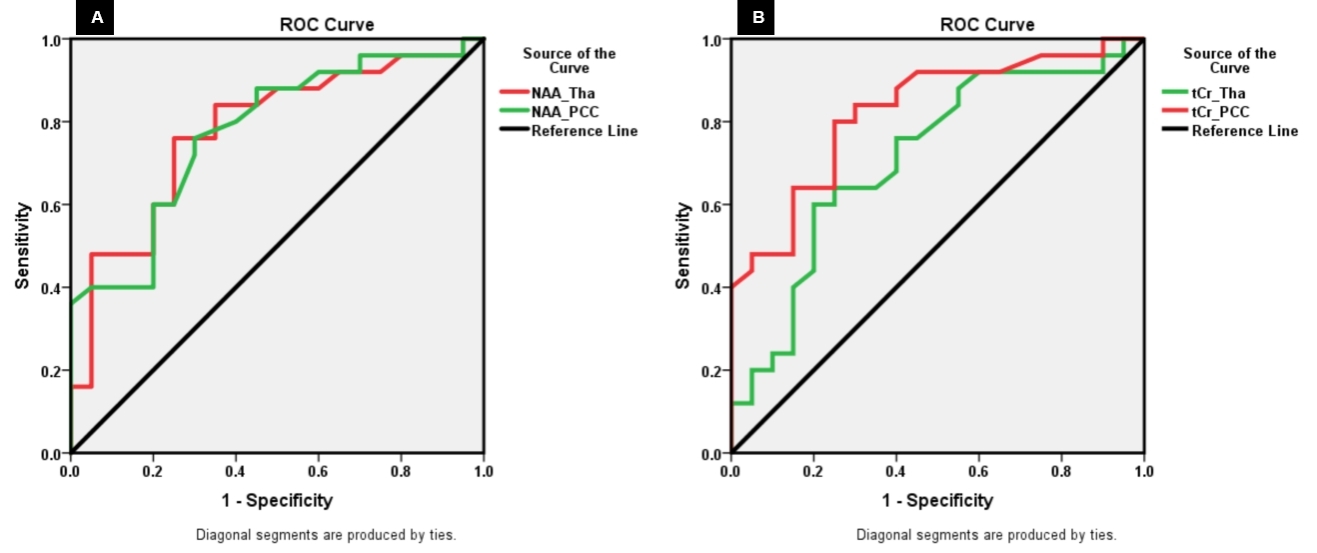
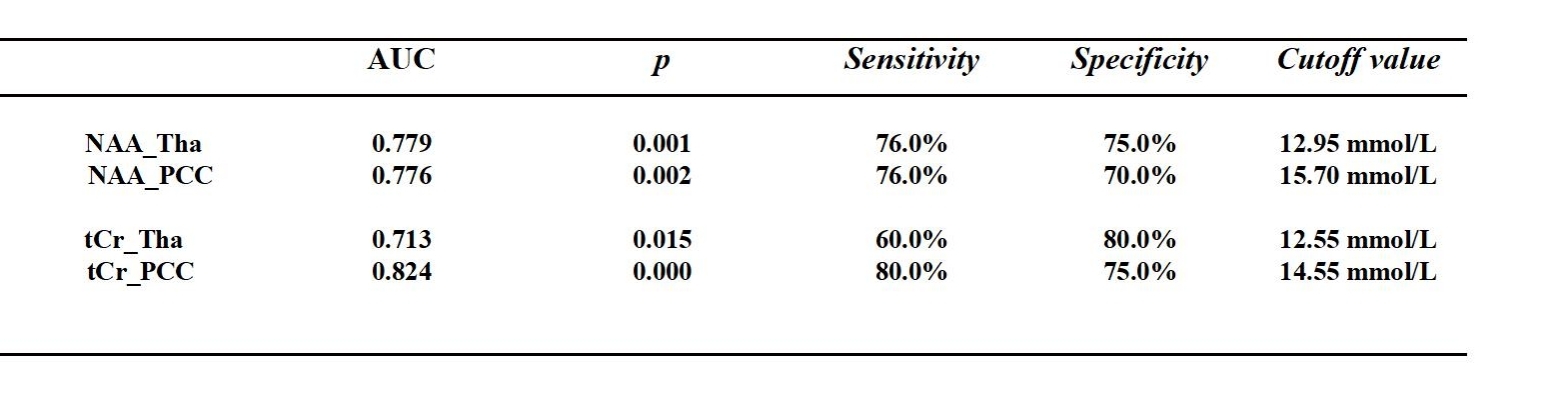
Results Compared with HCs, patients with PDCI showed significantly reduced concentrations of NAA and tCr both in PCC and left Tha regions. No signifcant metabolic alteration was found in PDN cases (Fig. 2A). Moreover, the concentration of NAA in PCC is significantly correlate with NAA in left Tha (r=0.475, p=0.000), the concentration of tCr in PCC is significantly correlate with tCr in left Tha (r=0.654, p=0.000). Both in PCC and left Tha, the reduction of NAA accompanying with decreasing of tCr (Fig. 2B). From ROC analysis, In left Tha, NAA could diferentiate between PDCI and HCs with an AUC of 0.779, a sensitivity of 76.0%, and a specifcity of 75.0%, with a cutoff<12.95 mM/L, tCr could diferentiate between PDCI and HCs with an AUC of 0.713, a sensitivity of 60.0%, and a specifcity of 80.0%, with a cutoff<12.55 mM/L. In PCC, NAA could diferentiate between PDCI and HCs with an AUC of 0.776, a sensitivity of 76.0%, and a specifcity of 70.0%, with a cutoff<15.70 mM/L, tCr could diferentiate between PDCI and HCs with an AUC of 0.824, a sensitivity of 80.0%, and a specifcity of 75.0%, with a cutoff<14.55 mM/L (Fig. 2B) and (Table 1).
Discussion NAA and Cr are two brain metabolites involved in the energy metabolism of neurons within the brain. In this study, PDCI and PDN patients showed distinct PCC and Tha metabolic MRS profiles, reduced concentrations of NAA and tCr were detected both in PCC and left Tha regions, but no changes were found in PDN. These results maybe suggest loss of neurons and/or glia exist in these two regions. The PCC is a highly connected and metabolically active brain region, and it has an important cognitive role. So energy metabolism dysfunction in PCC maybe result in cognitive impairment in PDCI patients, With the concentration of NAA and tCr , we can differentiate PDCI patients from HCs with a good sensitivity and specificity. The metabolism of the Tha is the same as that of the PCC. According to Kamagata’s study, the metabolic abnormalities in PCC maybe due to the lower regional cerebral blood flow in this region than normal controls[9]. So, comparison of PCC and Tha MRS profiles across mild cognitive impairment provides useful information for tracking cognitive decline in Parkinson's disease in a clinical setting. Cortical (via PCC) and subcortical (via Tha) NAA and tCr are promising biomarkers in characterizing PD cognitive stage deficits.
Acknowledgements
This work is supported by grants from the Natural Science Foundation of China (8156028, 181871333, 82260340). Guizhou Province Science & Technology Innovation Talent Team (CXTD[2022]006).References
[1] Inglese, M. et al. Neuroimage. 41, 270-276 (2008).
[2] Pan, J.W. et al. Am J Physiol Regul Integr Comp Physiol. 292, R1745-R1750 (2007).
[3] Kordower, J. H. et al. Brain. 136, 2419–2431 (2013).
[4] Martijn L, T. M. et al. Brain. 136, 3282–3289 (2013).
[5] Chaudhary, S. et al. Neurol Sci. 42,1053-1064 (2021).
[6] Caviness, J. N et al. Mov. Disord. 22, 1272-1277 (2007).
[7] Leech, R. et al. Brain. 137, 12-32 (2014). [8] Ciurleo, R. et al. Biomed. Res. Int. 519816 (2014).
[9] Kamagata, K. et al. J Magn Reson Imaging. 33, 803-807 (2011).
Figures