4190
Loss of Neuromelanin in Parkinson’s Disease Correlates with Increased Iron Content within the Substantia Nigra1Radiology, Ruijin Hospital, Shanghai Jiao Tong University School of Medicine, Shanghai, China, 2Radiology, Wayne State University, Detroit, MI, United States, 3Shanghai Key Laboratory of Magnetic Resonance, East China Normal University, Shanghai, China, 4Philips Healthcare, Shanghai, China, 5Faculty of Medical Imaging Technology, College of Health Science and Technology, Shanghai Jiao Tong University School of Medicine, Shanghai, China, 6Department of Biomedical Engineering, Wayne State University, Detroit, MI, United States
Synopsis
Keywords: Parkinson's Disease, Parkinson's Disease, Neuromelanin MRI
Motivation: Neuromelanin (NM) changes with iron content in the substantia nigra (SN) could provide a better understanding of the pathophysiology of PD.
Goal(s): To evaluate changes in NM volume in the SN versus iron as a means of understanding NM degeneration and iron deposition in PD.
Approach: We evaluated 342 healthy controls (HCs) and 558 PD patients with two different resolution datasets (Cohort 1 and 2) using magnetization transfer contrast imaging.
Results: Both datasets show HCs with reasonable stable NM volumes in SN while the PD patients show a significant iron increase in the SN with loss of NM volume.
Impact: A loss of NM volume with an increase of iron within SN demonstrates the association between NM depigmentation and iron elevation in PD, which provides insight into the role of NM and iron underlying PD pathophysiology.
Introduction
During the last decade a large effort has gone into understanding the role of neuromelanin (NM) and iron in the diagnosis and progression of Parkinson’s disease (PD). Mapping NM is important as it may prove to be a in vivo marker for pre-development of PD motor symptoms, because by the time symptoms appear there is already a greater than 50% loss of dopaminergic melanized neurons in the SNpc. [1] MRI offers unique contrasts and structural information that can be used to map both NM and iron in vivo. [2] These methods include 3D gradient echo imaging with magnetization transfer contrast radiofrequency pulses often used to enhance the visibility of NM. Measures of iron content can be obtained with either R2* or quantitative susceptibility mapping (QSM). This loss is usually manifested first in the nigrosome-1 (N1) territory, a region located in the caudal and mediolateral portions of the SNpc. [3] NM is a metal chelator and when it depigments after neuronal death it is believed to release its iron load so that it becomes visible in QSM. This iron is in the form of ferritin. [4] Although there are numerous recent papers discussing mapping NM and iron, the number of cases is often small or usually with only a single modality (either iron or NM) and often provide mixed results. In this work, 2 large PD and HC cohorts with both relatively low or high- resolution data were analyzed for iron and NM content in the SN.Methods
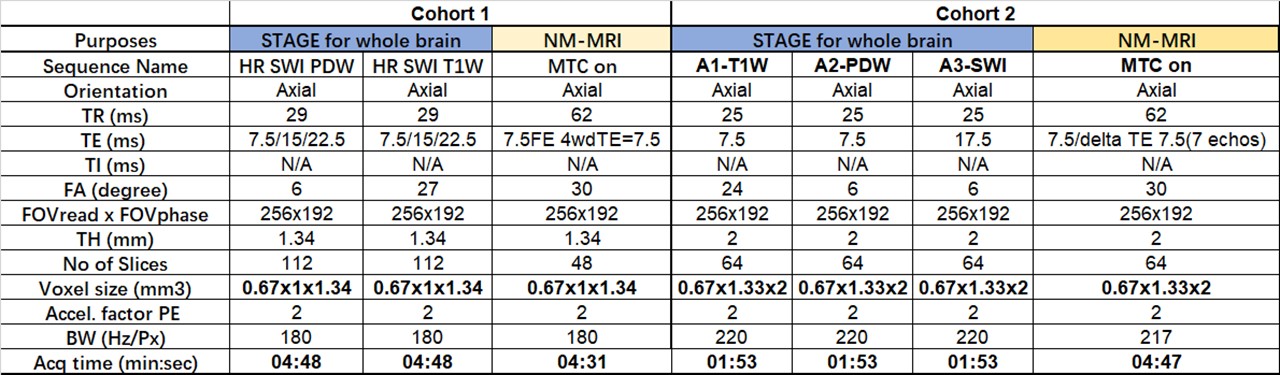
Two large cohorts of PD patients and controls were recruited. All subjects were scanned on a 3T scanner (Ingenia, Philips Healthcare) using a 15-channel head array coil. Cohort 1 (the high-resolution data) consisted of 128 HCs (M/F 52/76; age 58±10yr) and 401 PD patients (M/F 227/174; age 63±10yr) and Cohort 2 (the low-resolution data) consisted of 214 HCs (M/F 74/140; age 63±9yr) and 157 PD patients (M/F 93/64; age 63±9yr). The scanning protocol included: STrategically Acquired Gradient Echo (STAGE) and a 3D gradient echo sequence with an activated magnetization transfer contrast (MTC) pulse (3D MTC-GRE). The specific parameters for each protocol are given in Table 1. The first echo of the MTC-GRE magnitude image (TE = 7.5 ms) was used to delineate NM. The STAGE data were used for QSM reconstruction. A template-based approach was used to determine the boundaries for the DGM using the QSM data except for the PUT and CN where the T1W images were used [5]. Both susceptibility and volume were extracted from the final boundaries overlaid onto the QSM data while the NM volume was calculated from either 5% or 10% thresholding above the background using the 30o MTC GRE data. Group comparison and correlation analyses were performed using SPSS (version 24.0; IBM Corp). Alpha was set to 0.05 for all tests.Results
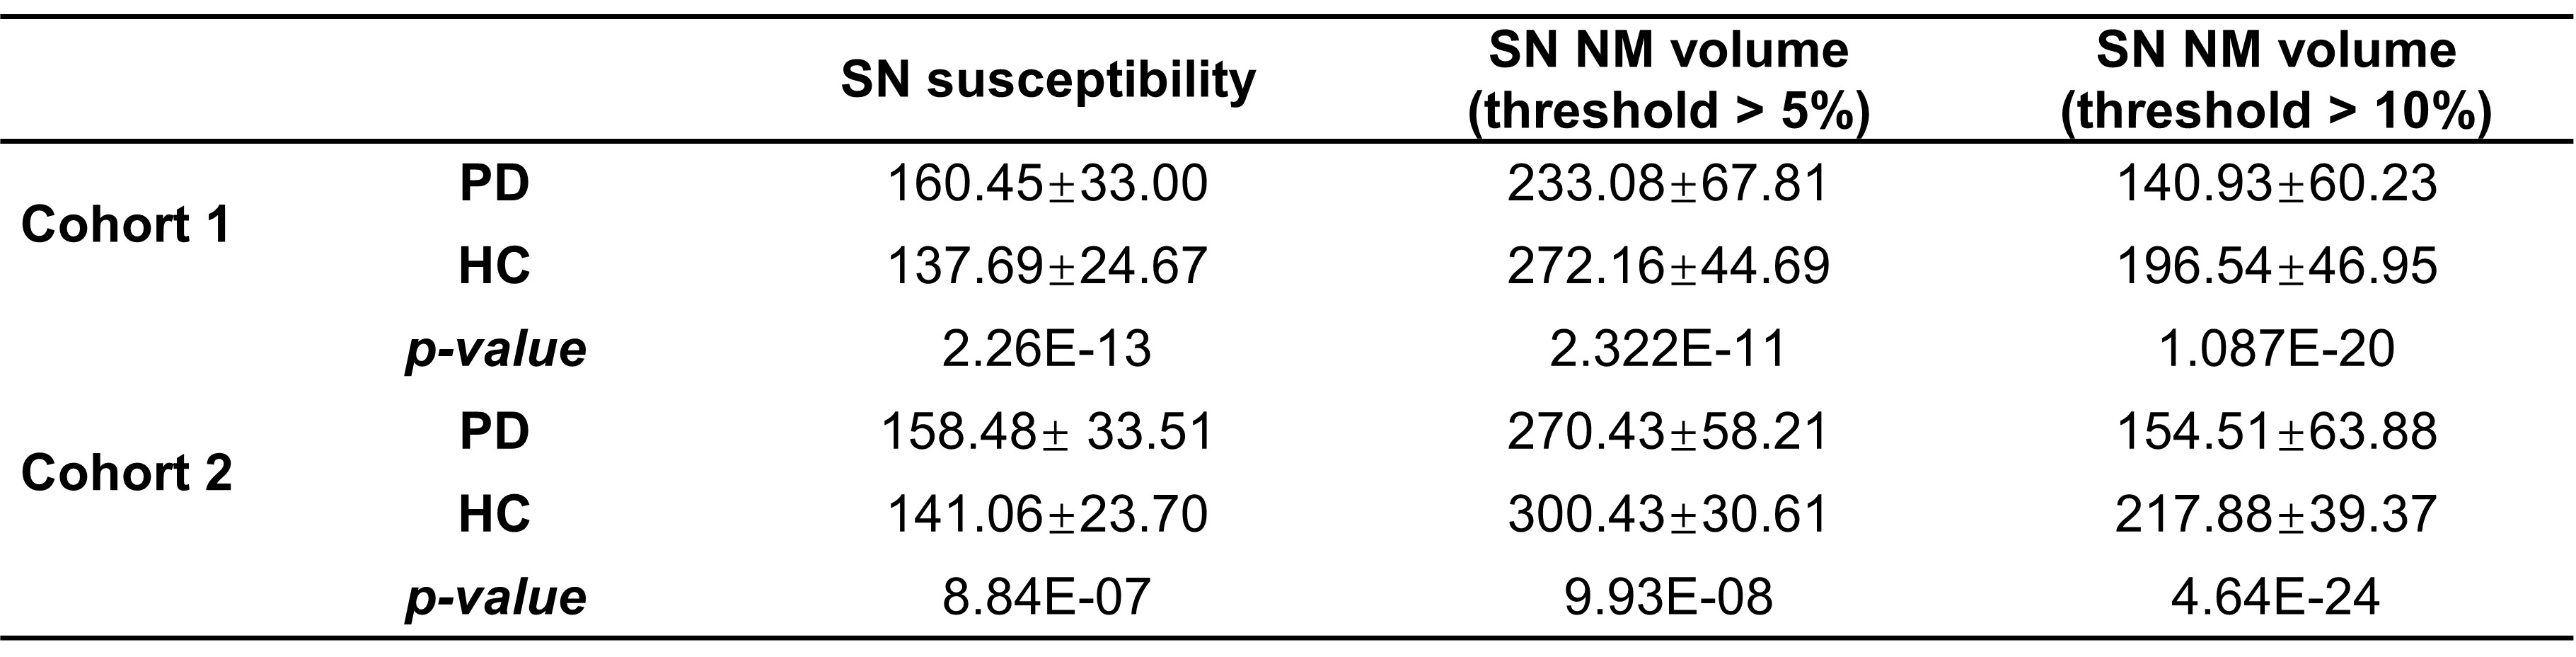
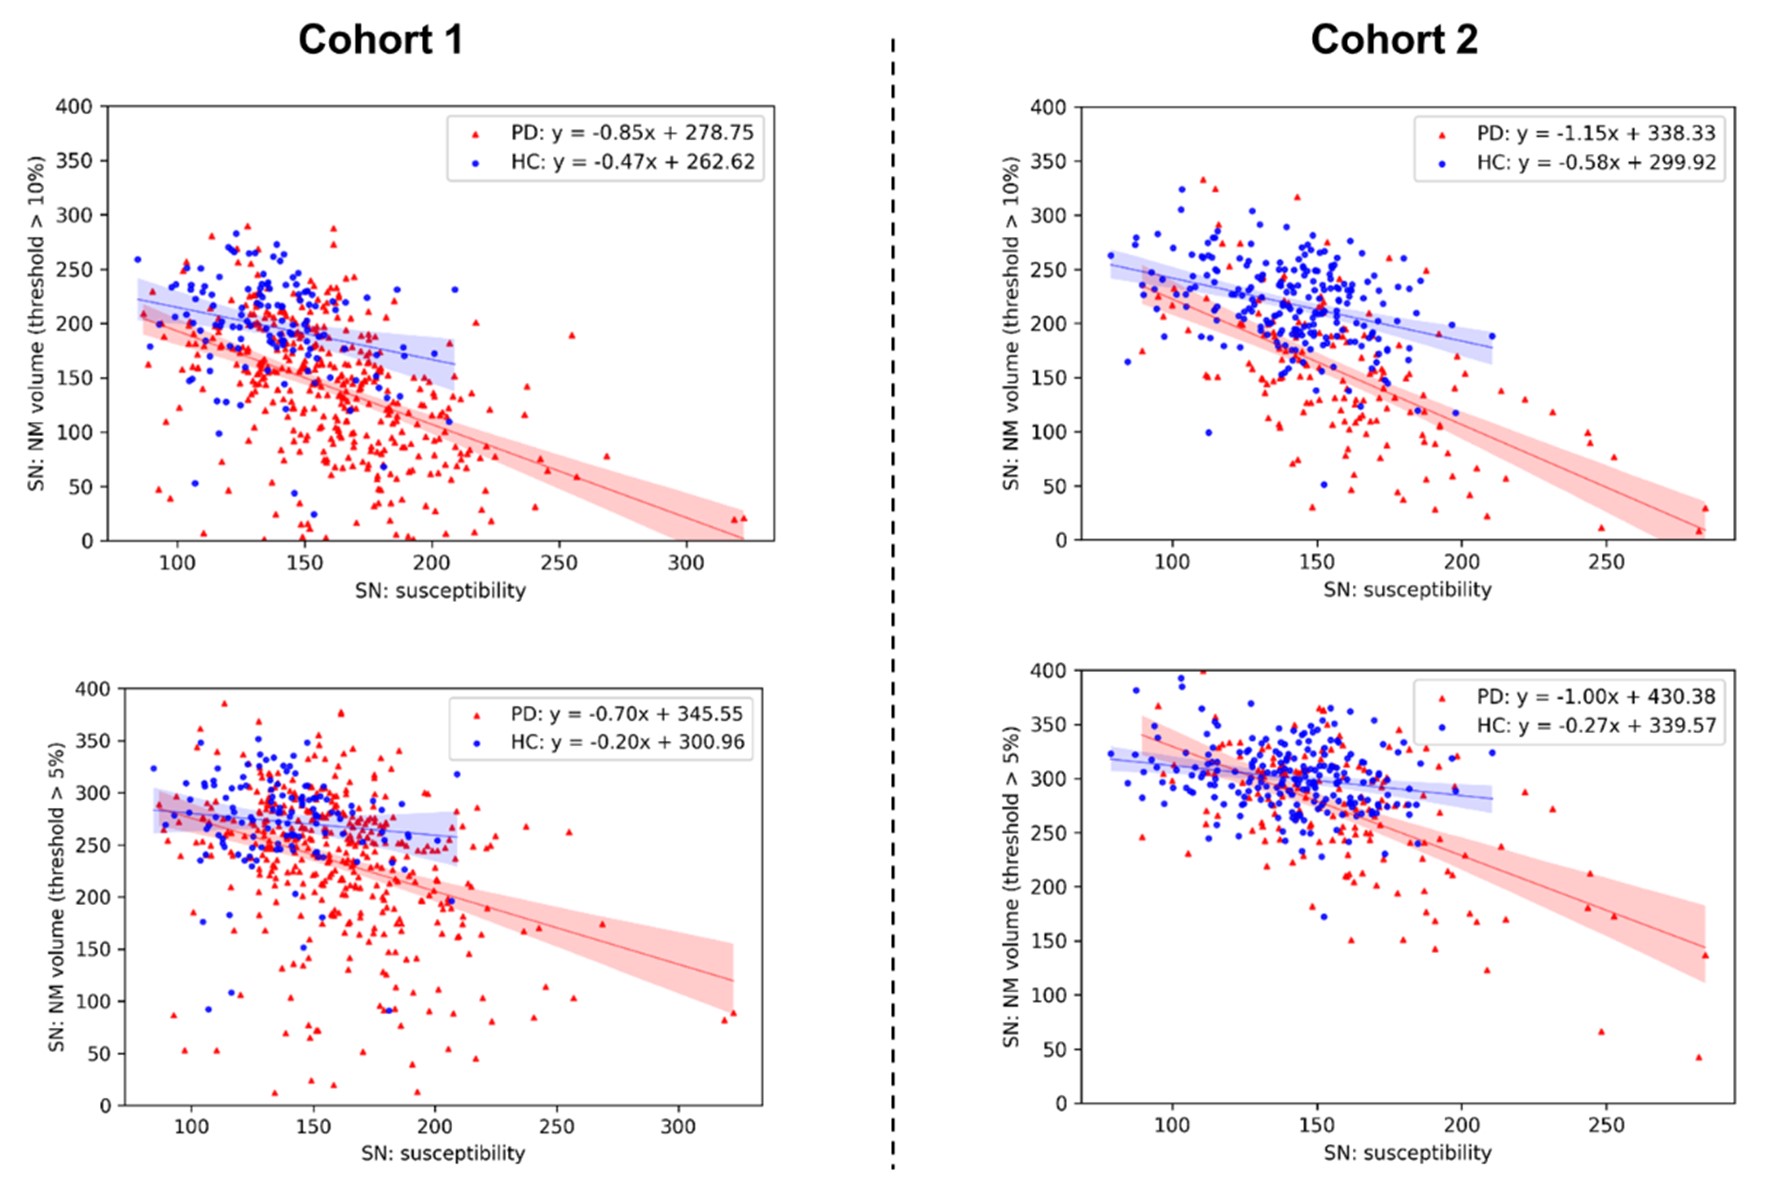
Mean susceptibility for iron and the 5% or 10% thresholding NM volume for the two cohorts were summarized in Table2. All of the measures were significantly different between the PD patients and HCs from both of the cohorts. All the neuromelanin volume was found to correlate negatively with changes in iron content for both cohorts and for both 5% and 10% neuromelanin contrast thresholds for PD patients (P < 0.001) (Figure 1). HCs had a mild increase in iron content with NM loss while PD patients had a much more rapid change with significantly reduced NM volume and increases in iron content.Discussion and Conclusion
To our knowledge, no one has shown the overall increases of iron with decreasing NM volumes for a large cohort of PD patients. The implications are very important in understanding the relationship between NM depigmentation and iron deposition, and even interpreting the N1 sign. The fact that overall iron content correlates with NM loss suggests a more global involvement of iron changes in the SN with PD. However, we did not specifically break the SN into the SN pars reticulata and the SN pars compacta. Had we done so, we might have found that the major increase in iron with NM loss was predominantly in the SNpc. To our knowledge, this is one of the largest population studies evaluating the using NM and iron in studying PD, the results of which were validated using two independent cohorts with different resolutions. This approach can be used at most imaging sites along with the automatic analysis we used.Acknowledgements
This work was supported, in part, by the National Natural Science Foundation of China (grant number: 82271954, 81971576); Chinese National Science & Technology Pillar Program (grant number: 2022YFC2009900/2022YFC2009905) and the Innovative Research Team of High-level Local Universities in Shanghai.References
Figures