4189
Imaging α-synuclein protein aggregation by CEST-MRI for monitoring of synucleinopathies1Université Paris-Saclay, CEA, CNRS, MIRCen, Laboratoire des Maladies Neurodégénératives, Fontenay-aux-Roses, France, Fontenay-aux-Roses, France
Synopsis
Keywords: Parkinson's Disease, CEST & MT
Motivation: Misfolded proteins that aggregate in the brain are at the root of many neurodegenerative diseases.
Goal(s): Our aim was to demonstrate that CEST can distinguish between soluble and aggregated forms, and that it is possible to monitor them in vivo.
Approach: We optimized a CEST sequence in vitro on purified forms of α-synuclein and then injected them into the brain of mice to follow their propagation.
Results: The CEST signal differ strongly depending on the protein conformation, and longitudinal tracking has enabled us to show that protein aggregates propagate in the brain on a scale of several months.
Impact: CEST imaging can distinguish proteins in soluble or aggregated form that are at the root of many neurodegenerative diseases, making it possible to envisage CEST imaging as a non-invasive diagnostic tool for these diseases.
Introduction
Several neurodegenerative diseases such as Parkinson or synucleinopathies are due to the aggregation of misfolded proteins. In addition to their initial loss of function due to misfolding, proteins acquire toxic functions, in particular that of recruiting and aggregating soluble proteins, thereby amplifying the phenomenon similarly to prion-like diseases [1]. CEST imaging offers the advantage of combining biological information with good spatial resolution. Following the selective saturation of amide protons, the saturation is transferred via chemical exchange to free water (APT, Amide Proton Transfer). Polarization can also be transferred between aliphatic protons by dipolar coupling (rNOE, relayed nuclear overhauser effect). APT and rNOE have already been used to monitor in vitro the aggregation of several proteins [2]. Here, we demonstrated that CEST can be used to identify soluble and aggregated forms of α-synuclein and to monitor in vivo the appearance of aggregates non-invasively in the mouse brain.Methods
MRI acquisitions: CEST data were acquired on a horizontal 11.7T Bruker magnet using TSE sequence preceded by a continuous wave saturation pulse (Tsat=10s, B1=0.4 to 1µT).In vitro experiments: Soluble and aggregated (fibrils, Fig.1.a) forms of purified α-synuclein were used at a concentration of 5µg/µL.
In vivo experiments: 2µL of α-synuclein fibrils were injected in the striatum of 6 mice. Contralateral striatum was injected with 2µL of PBS. Animals were imaged at 0, 1 and 2 months post-injection.
Post-mortem analysis: Brains were extracted and the total α-synuclein and the phosphorylated form were dosed using filter trapp.
Results
Soluble and aggregated (Fig.1.b, red and blue curves respectively) forms of α-synuclein exhibited very different CEST signatures with strong differences in APT and rNOE signals. The soluble protein exhibited a more intense APT signal than the aggregated form for the same total protein concentration. The opposite effect was observed for the rNOE signal. The dependency of APT and rNOE signals on B1 intensity were very different, suggesting different exchange rates regimes (Fig.1.c and .d).One example of in vivo CEST images acquired at 0, 1 and 2 months post-injection is shown on Fig.2. The APT signal remains stable over time, while the rNOE signal increased. Moreover, the area with an intense rNOE signal was larger at 2 months.
After in vivo experiments, total α-synuclein and phosphorylated forms were dosed from each hemisphere of mice brains (Fig.3). Total α-synuclein was present in both hemispheres of the brains (Fig.3.a). Interestingly, phosphorylated form was found while the injected protein was not, indicating that it acquired this property in brain tissues (Fig.3.b).
Discussion and conclusion
The strong differences observed in vitro on soluble and aggregated α-synuclein can be explained by the 3D conformation of each form of the protein (Fig.1.b). The APT effect was more intense for the soluble form because the total surface and therefore the quantity of labile protons accessible to free water was greater as compared to aggregated protein. On the contrary, the rNOE effect of the fibrillar form of α-synuclein was more intense as dipolar couplings were stronger in a large and poorly mobile molecule. As both APT and rNOE exhibited very different dependency on B1 (Fig.1.c and .d), one can expect that discrimination between both forms is feasible based on APT and rNOE signals.In vivo images acquired after α-synuclein injection showed significant increase of both APT and rNOE signals (Fig.2). Interestingly, if the APT remained relatively stable, rNOE signal was higher at 2 months post-injection. Moreover, increase of rNOE effect was also observed in a larger area than injected site and especially in the contralateral hemisphere. As rNOE was mostly sensitive to aggregated form, one can hypothesize that the NOE image reflected the spread of aggregated protein over a large area of the brain.
This was confirmed by post-mortem analysis. Indeed, the injected protein was not phosphorylated meaning that finding the phosphorylated form indicated that α-synuclein acquired a deleterious appearance. Moreover, the phosphorylated form was also present in the contralateral side, confirming the observations on the CEST images and confirming the spread of aggregates throughout the brain.
This study demonstrates that differentiation of soluble and aggregated forms of α-synuclein was feasible and suggests that CEST can be a valuable tool to monitor in vivo spreading of misfolded proteins involved in neurodegenerative disorders with a good spatial resolution.
Acknowledgements
This work was supported by a grant from Fondation de France (“synImaging”, 00096648).
The 11.7 T scanner was funded by a grant from NeurATRIS (“Investissements d'Avenir”, ANR-11-INBS-0011).
References
1. Jucker, M. and L.C. Walker, Self-propagation of pathogenic protein aggregates in neurodegenerative diseases. Nature, 2013. 501(7465): p. 45-51.
2. Goerke, S., et al., Aggregation-induced changes in the chemical exchange saturation transfer (CEST) signals of proteins. NMR Biomed, 2017. 30(1).
Figures
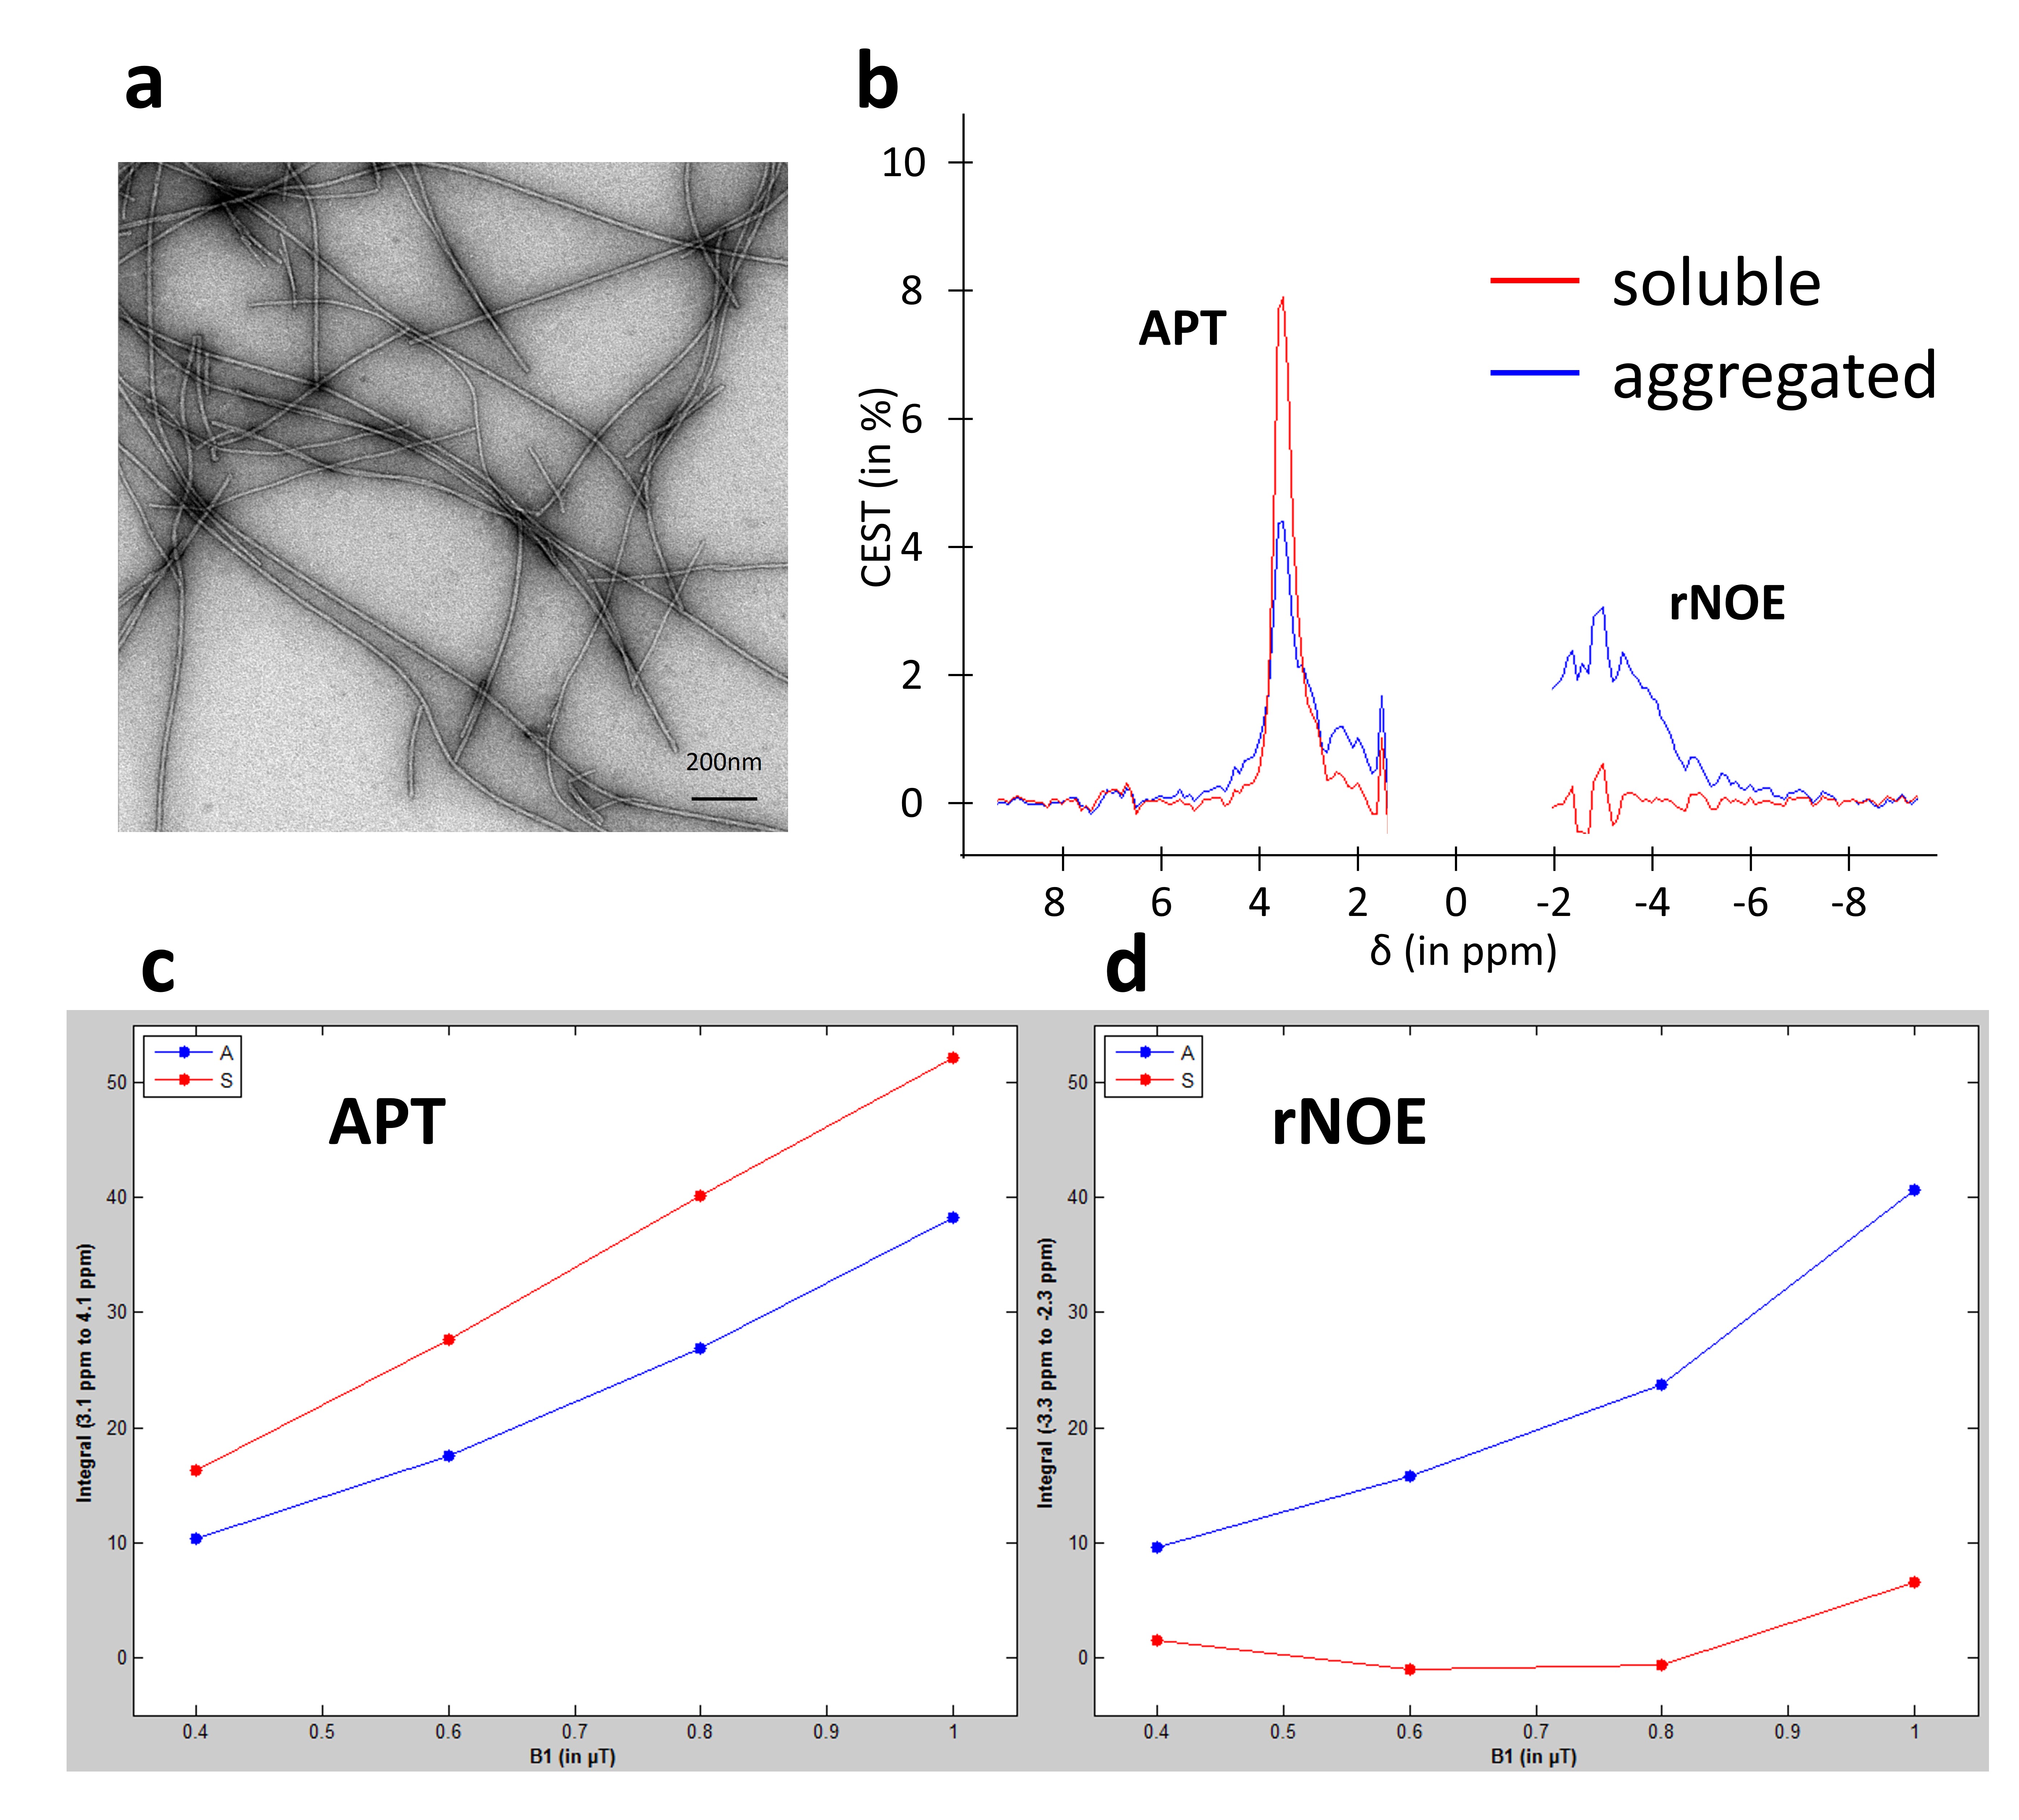
Figure 1: in vitro characterization of CEST signatures
Aggregated forms (fibrils) of α-synuclein was used at a concentration of 5µg/µL (a). CEST signatures (APT and rNOE signals) were measured in soluble (red curve) and aggregated (blue curve) forms of α-synuclein (b). Dependency of APT (c) and rNOE (d) signals on B1 intensity measured in soluble (red) and aggregated (blue) α-synuclein.
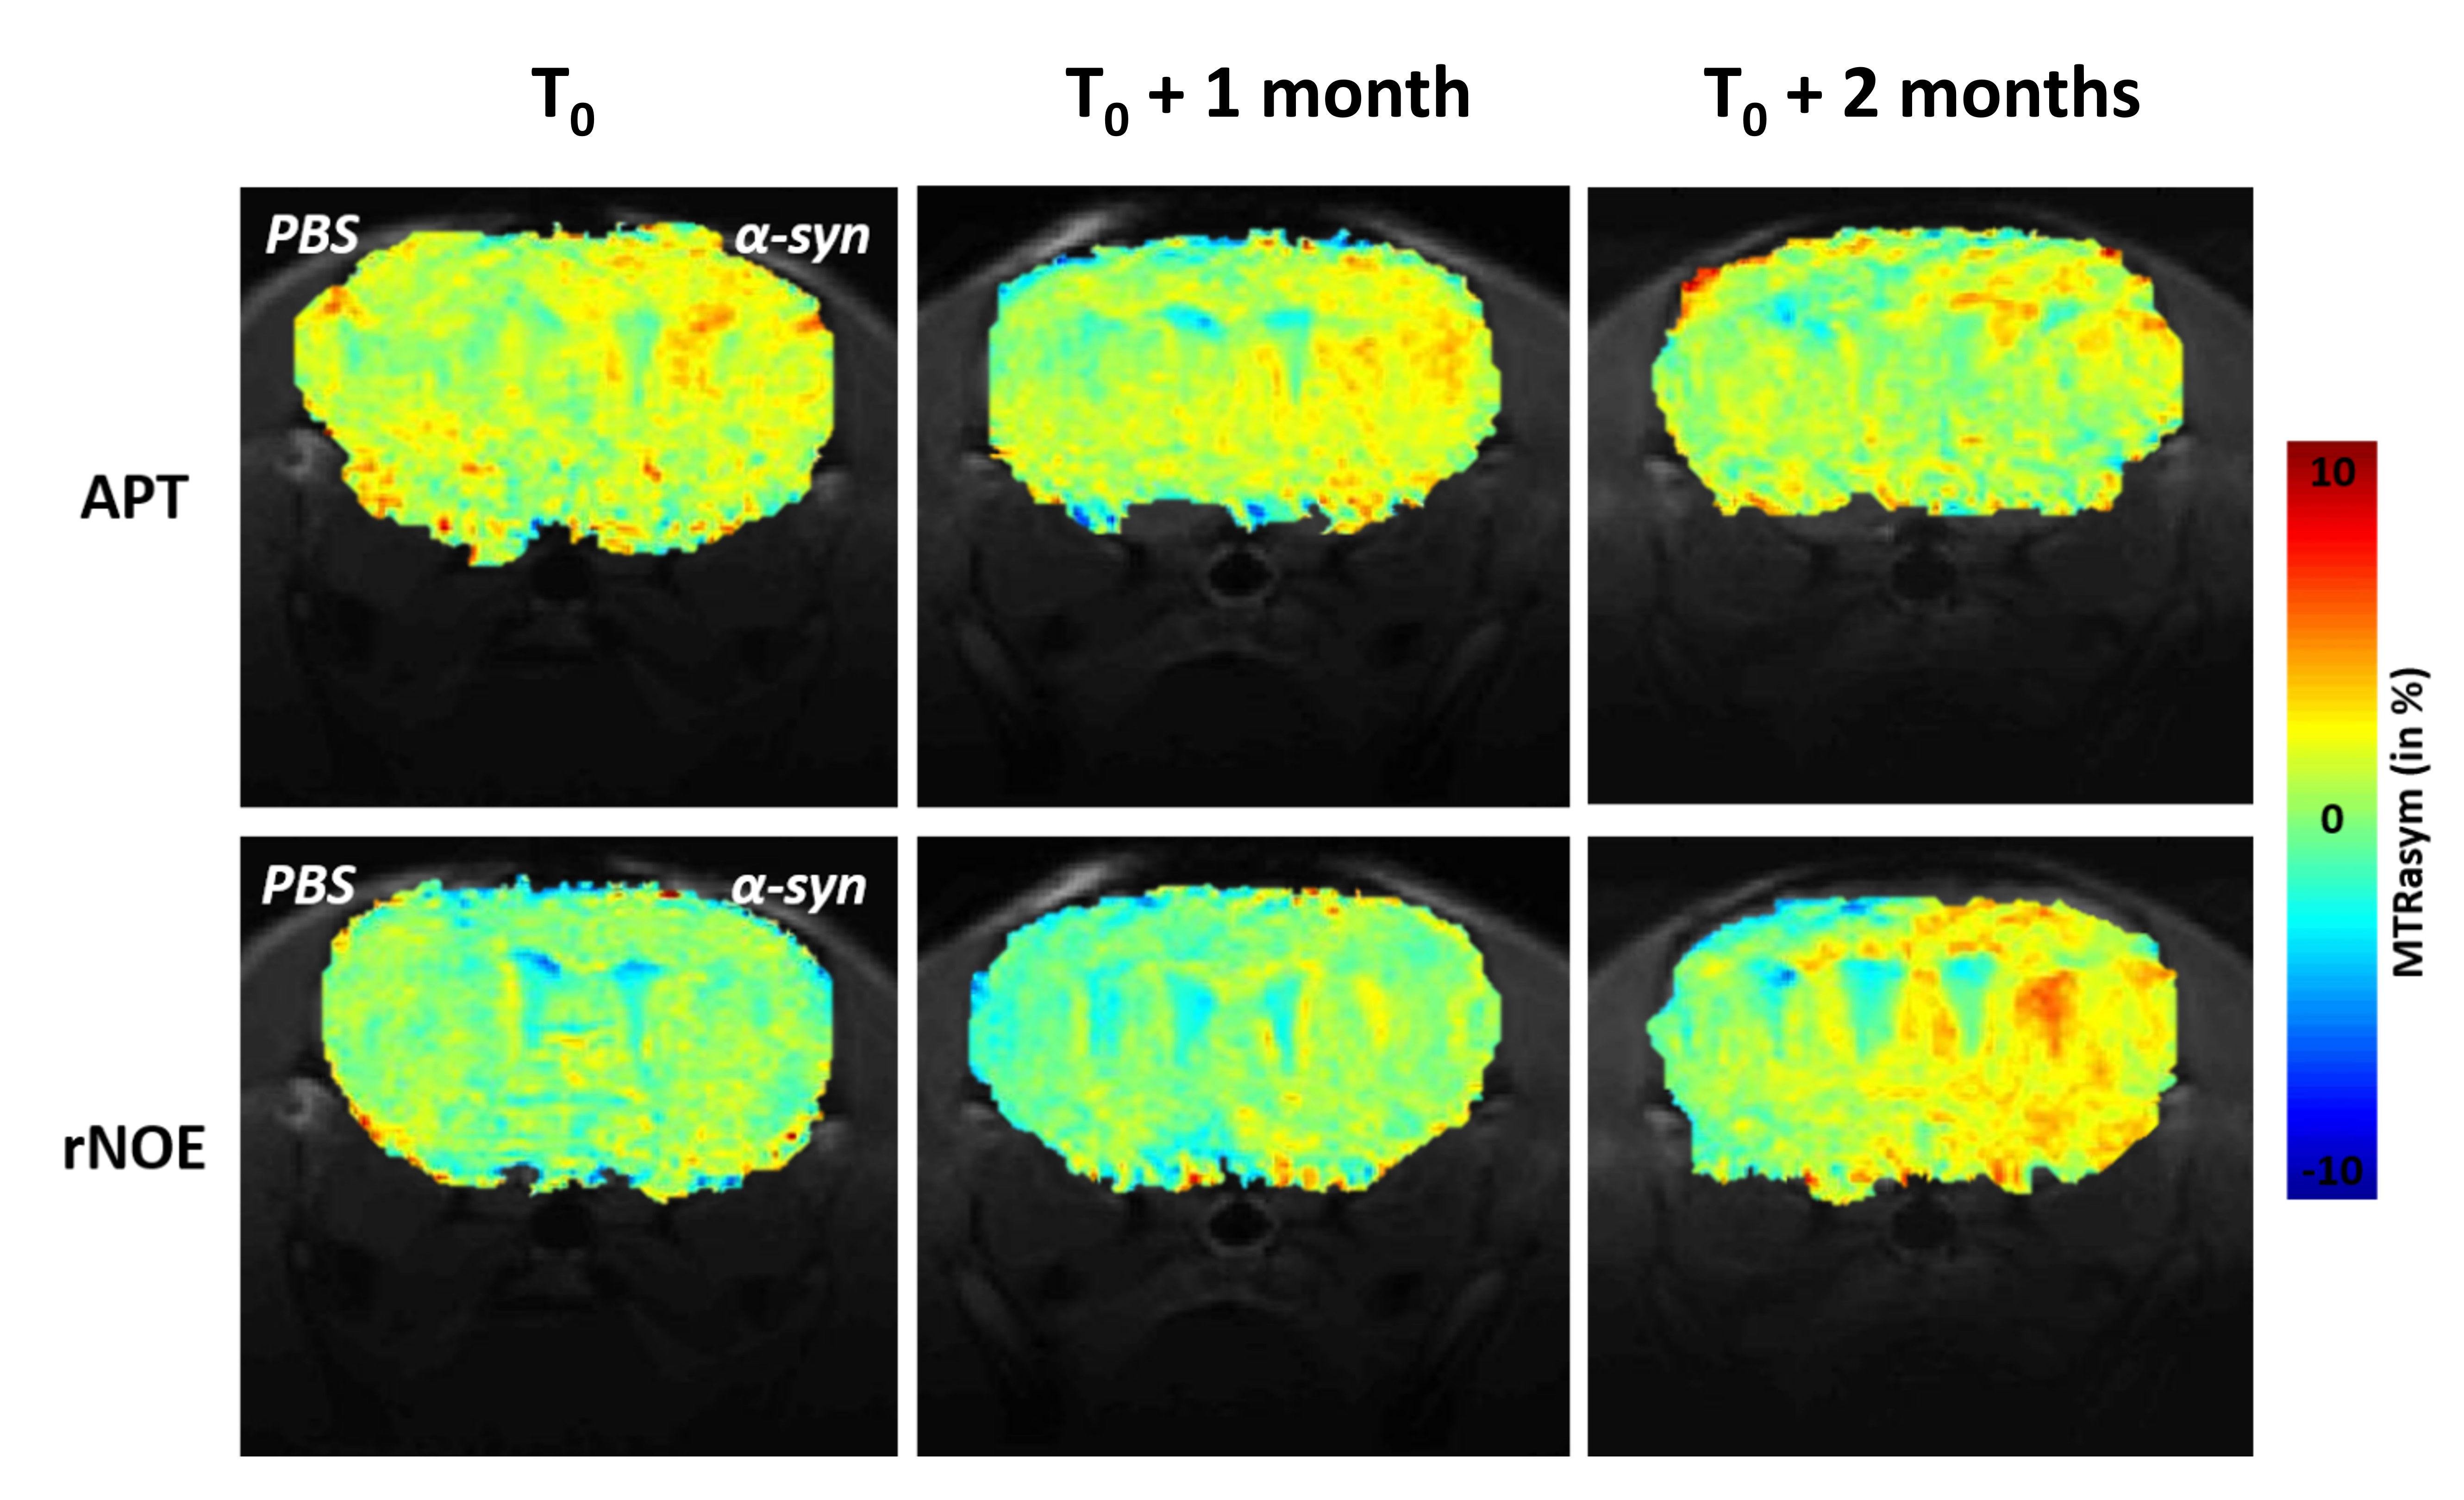
Figure 2: in vivo monitoring of APT and rNOE
Example of APT and rNOE images were acquired at 0, 1 and 2 months after injection of 10 µg of fibrilar form of α-synuclein in the striatum of mouse brain.
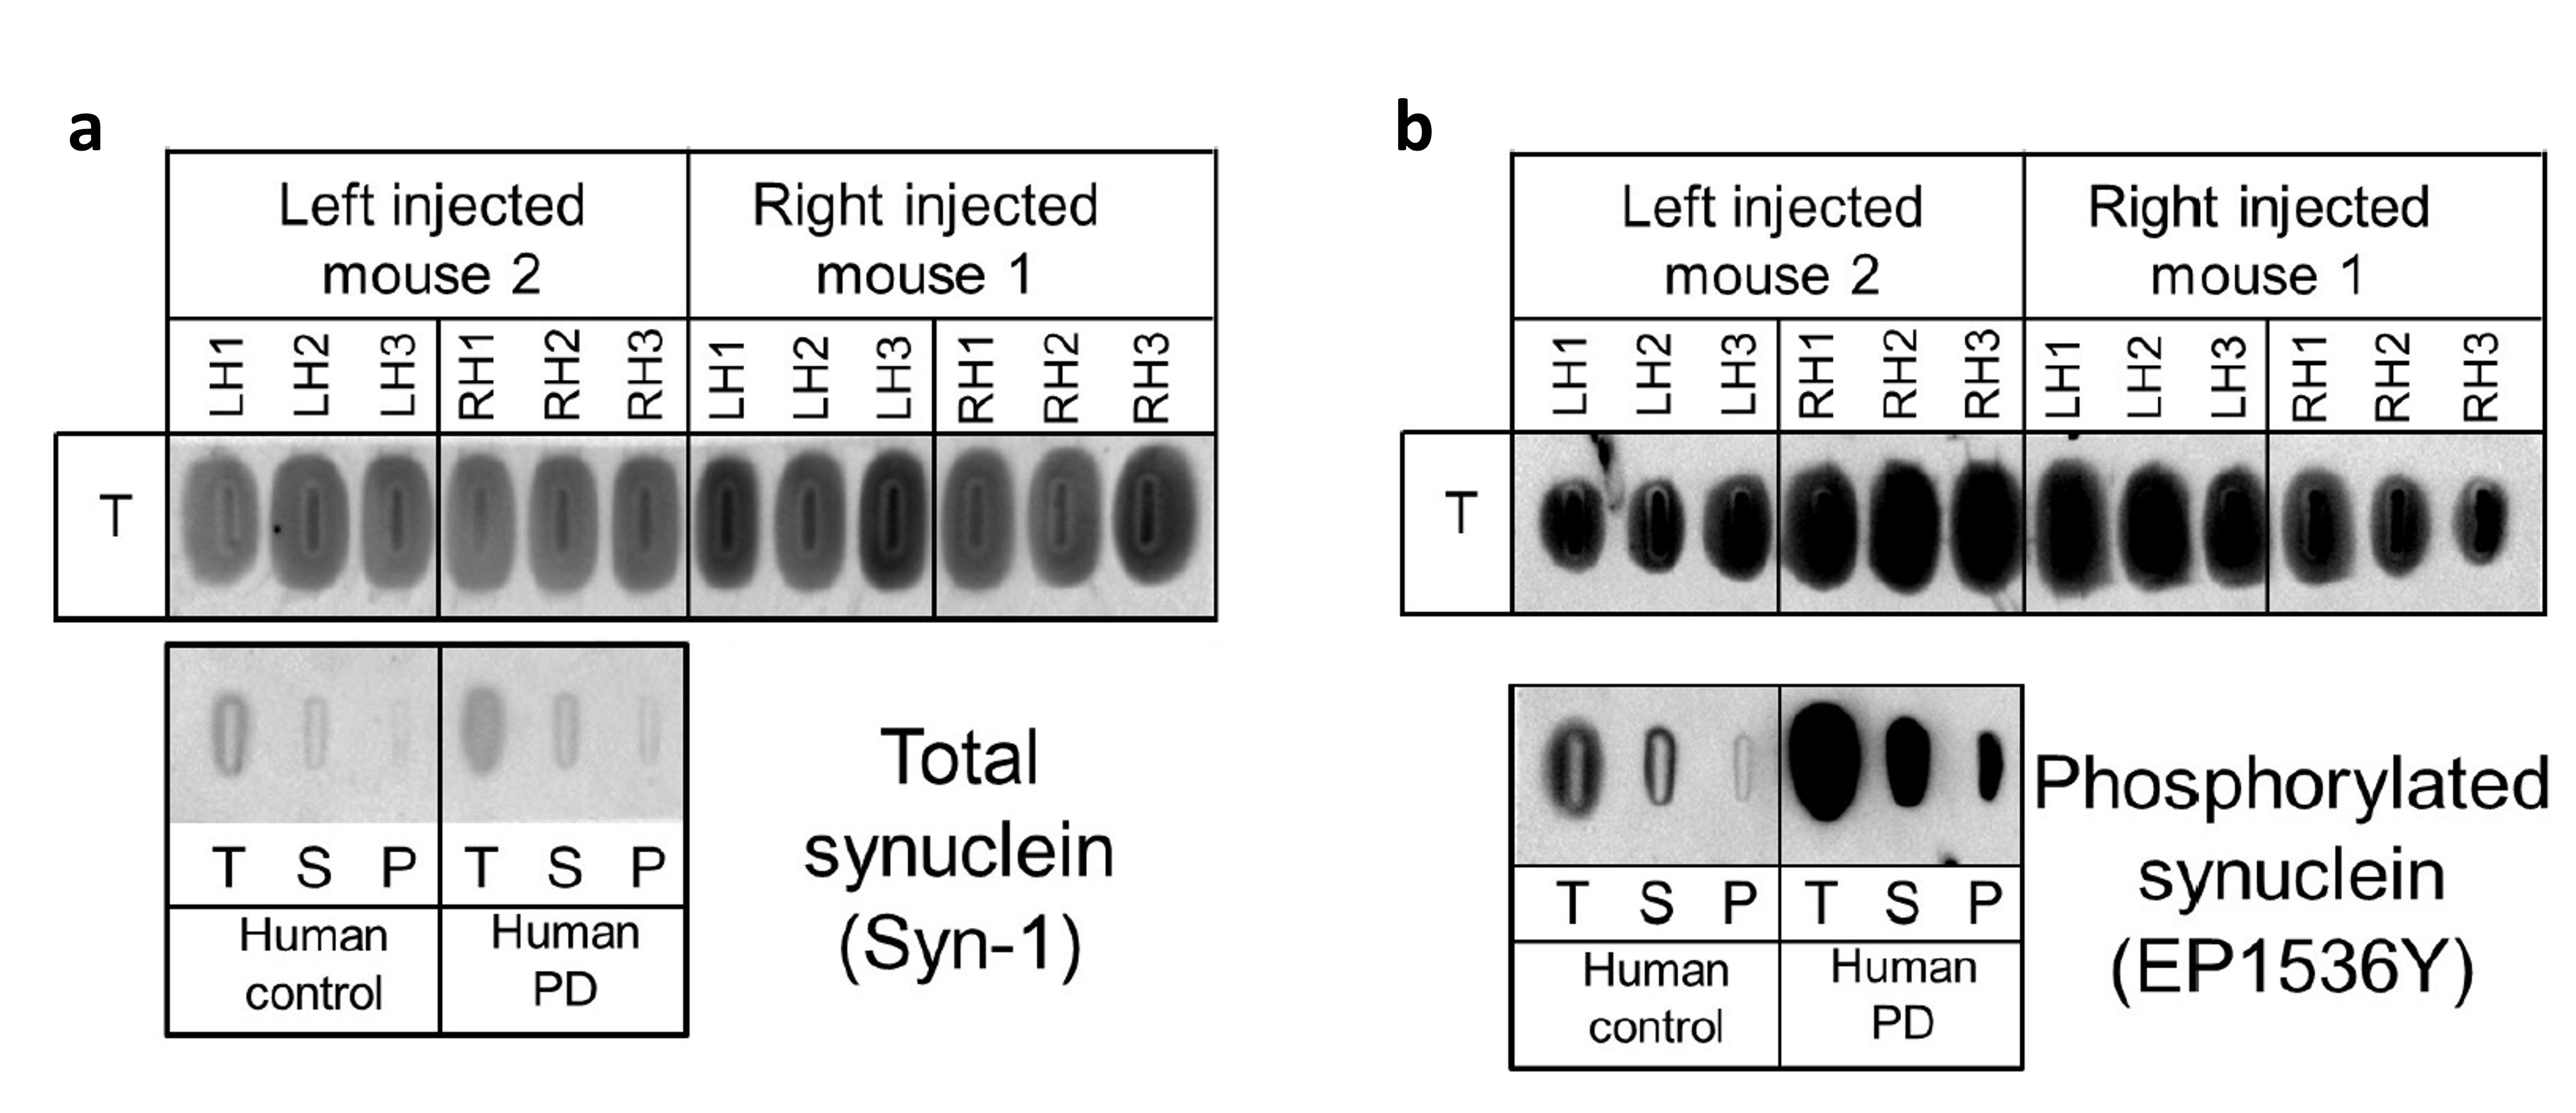
Figure 3: post-mortem analysis
After longitudinal follow-up, mice were sacrificed and their brains extracted in order to dose the total α-synuclein (a) and the phosphorylated form (b) using filter trapp.