4184
Superior cerebellar peduncle diffusivity differentiates progressive supranuclear palsy from other parkinsonian syndromes1Center for Advanced Neuroimaging, University of California Riverside, Riverside, CA, United States, 2Long Beach VA, Long Beach, CA, United States, 3Department of Neurology, Emory University, Atlanta, GA, United States, 4Department of Bioengineering, University of California Riverside, Riverside, CA, United States
Synopsis
Keywords: Parkinson's Disease, Parkinson's Disease, cerebellum
Motivation: Overlapping clinical symptoms make differential diagnosis of typical and atypical parkinsonian syndromes difficult in the early stages of these diseases.
Goal(s): Our goal was to assess atrophy in the superior cerebellar peduncle in progressive supranuclear palsy.
Approach: A high-resolution DTI (voxel size=1.1×1.1×1.1 mm3) was used to derive diffusion metrics in the super cerebellar peduncle in a population of typical and atypical parkinsonian syndromes.
Results: Application of this protocol found measures consistent with superior cerebellar peduncle atrophy (increased MD, decreased FA) in the progressive supranuclear palsy relative to the Parkinson’s disease and multiple systems atrophy- with predominant parkinsonian features groups.
Impact: Overlapping clinical features makes differential diagnosis of progressive supranuclear palsy from other parkinsonian syndromes difficult in the early stages of these diseases. Our demonstration of superior cerebellar peduncle atrophy in progressive supranuclear palsy suggests imaging markers may aid differential diagnosis.
Introduction
Progressive supranuclear palsy (PSP) is an atypical parkinsonian syndrome characterized by progressive vertical gaze palsy, postural instability, akinesia, dysphagia, and dementia.1 PSP shares clinical features with Parkinson’s disease (PD) and multiple system atrophy with predominant parkinsonian features (MSA-P). Given this overlap, differential diagnosis of parkinsonian syndromes in the early stages is a major challenge for clinicians and imaging markers derived from morphological changes due to disease pathology may aid in diagnosis of PSP.The superior cerebellar peduncle (SCP) mainly consists of efferent projections from the dentate nucleus (DN) and SCP has been shown to undergo atrophy in PSP.2,3 Atrophy of SCP in PSP has been corroborated in several imaging studies that found reduced width of SCP in T1-weighted images.4-7 This atrophy should present in diffusion-weighted MRI images as increased diffusivity, and increases in apparent diffusion coefficient of the SCP have been observed in PSP relative to MSA-P and PD.8 However, the small size of SCP, low resolution of diffusion-weighted images, and manual placement of SCP regions of interest (ROIs) lead to poor interrater reliability.8 These limitations can be removed by using standard space atlases to define ROIs in conjunction with a high resolution diffusion-weighted imaging protocol, whichare employed here to examine changes in SCP from PSP.
Methods
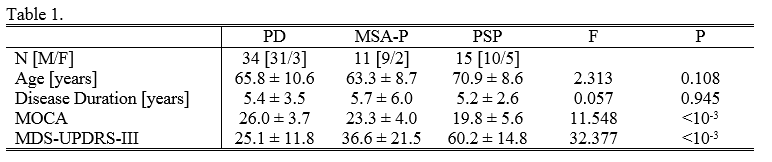
A cohort consisting of 60 subjects (34 PD, 11 MSA-P, and 15 PSP) were scanned in this study. All subjects gave written, informed consent. Subject demographic data is summarized in Table 1.Imaging data were acquired on a 3 T MRI scanner (Prisma, Siemens Healthineers) using a 64-channel receive only coil. Images from a MP-RAGE sequence (echo time (TE)/repetition time (TR)/inversion time=3.02/2600/800 ms, flip angle=8°, voxel size=0.8×0.8×0.8 mm3) were used for registration from subject space to common space.
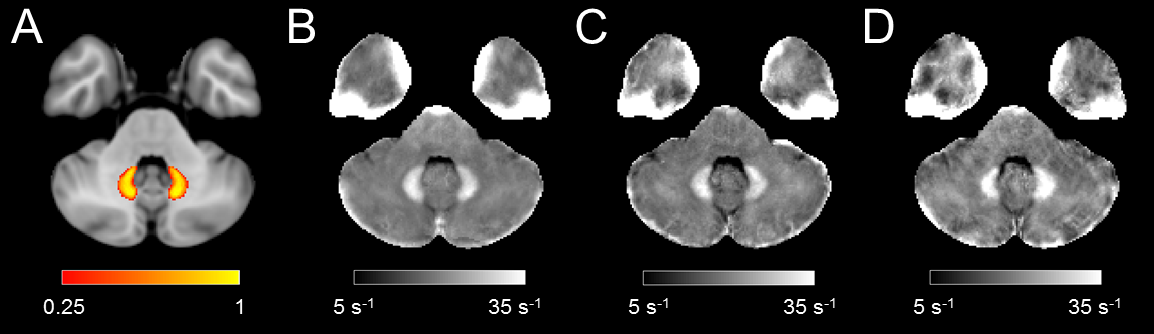
An eight-echo 3D gradient recalled echo (GRE) sequence was acquired (parameters: TE1/TE/TR=4.92/4.92/50 ms, voxel size=0.47×0.47×1 mm3, GRAPPA=2). R2* values were calculated from the multi-echo GRE acquisition in MATLAB by fitting the magnitude data to a monoexponential model. Mean R2* was measured in a standard space DN ROI.9
High-resolution diffusion MRI data were collected with a diffusion-weighted single-shot spin-echo, echo planar imaging sequence (parameters:TE/TR=68/4500 ms, voxel size=1.1×1.1×1.1 mm3, 64 slices with multiband factor=2, 5 averages). Diffusion-weighting gradients were applied in 30 directions with b=500 s/mm2. A set of b=0 images with phase-encoding directions of opposite polarity were acquired to correct for susceptibility distortion. DTI data were denoised, then eddy was used to corrected for eddy current and susceptibility distortions. Mean diffusivity (MD) and fractional anisotropy (FA) maps were calculated and free water (FW) maps were calculated using a bi-compartment model, as implemented in DIPY.
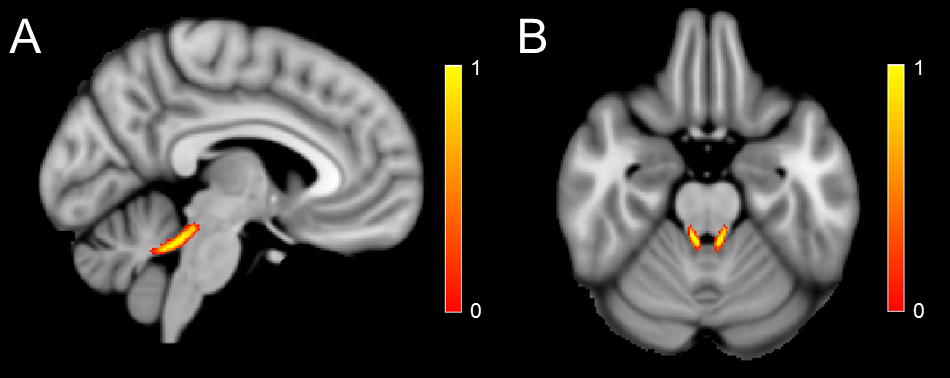
A SCP atlas, shown in Figure 1, was created using high-resolution diffusion-weighted data (voxel size=0.95×0.95×1 mm3) from a cohort of 22 healthy older adults (mean age=73.0 ± 6.7 years). For each subject, mean FA, MD, and FW was estimated in the atlas.
Results
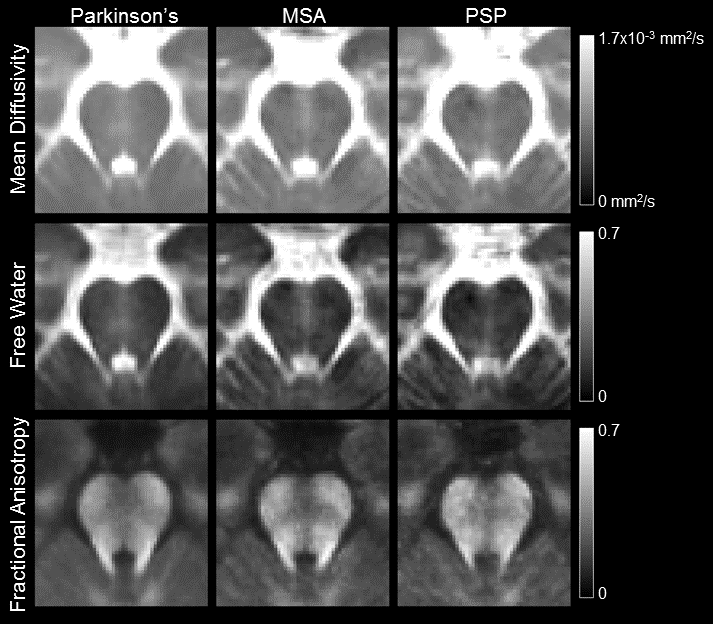
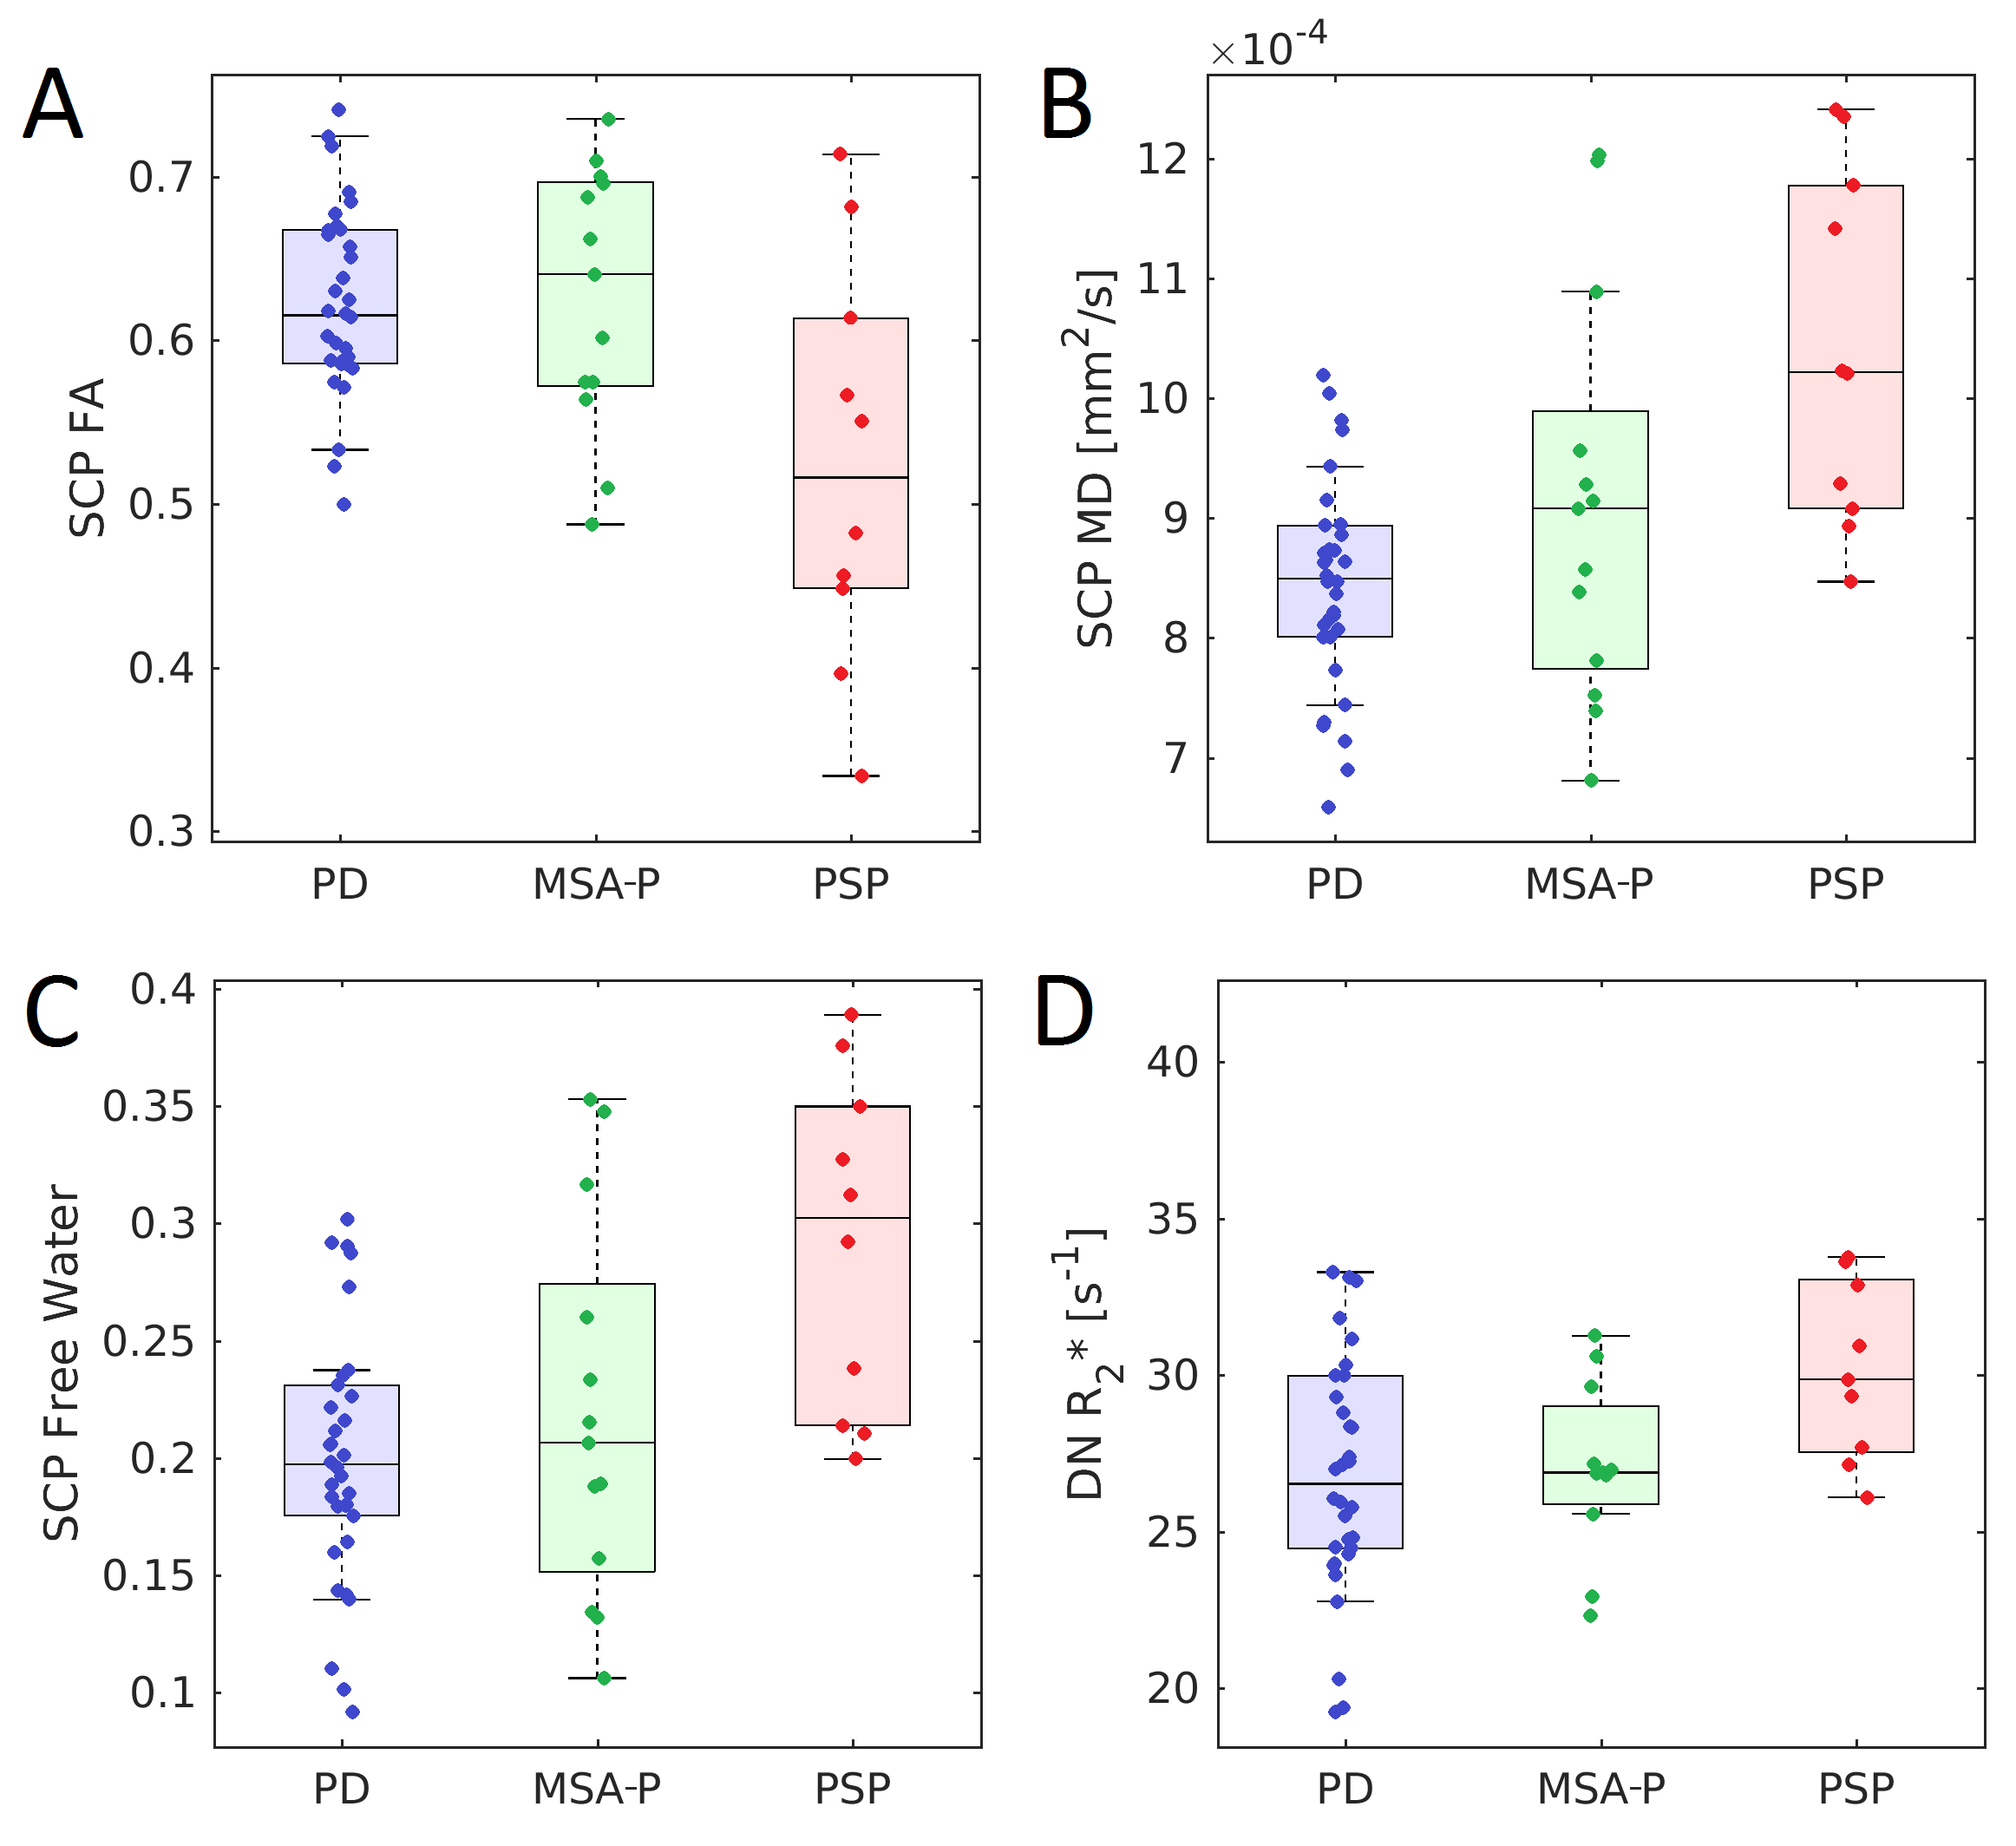
A comparison of mean diffusion measures in each group is shown in Figure 2. The effect of group (PD, MSA-P, PSP) on each diffusion measure (FA, MD, FW) was assessed with a Kruskal-Wallis H test. A significant main effect of group was seen for all diffusion measures (FA:Kruskal-Wallis H=6.052,P=0.049; MD:Kruskal-Wallis H=12.259,P=0.002; FW:Kruskal-Wallis H=10.955,P=0.004). Pairwise comparisons revealed reduced FA (PPSP-PD=0.023; PPSP-MSA=0.036), increased MD (PPSP-PD<10-3; PPSP-MSA=0.049), and increased FW (PPSP-PD<10-3; PPSP-MSA=0.029) in the PSP group relative to the PD and MSA-P groups.Figure 3 shows a comparison of mean DN R2* in each group. The effect of group (PD, MSA-P, PSP) on each DN R2* was assessed with a Kruskal-Wallis H test. A significant main effect of group was seen for DN R2* (Kruskal-Wallis H=9.395,P=0.009). Pairwise comparisons revealed increased R2* in the PSP group relative to the PD (PPSP-PD=0.005) and MSA-P groups (PPSP-MSA=0.008). No difference was seen between MSA-P and PD groups for any measure. Group comparisons of SCP diffusion metrics and DN R2* are shown in Figure 4.
Discussion
Mean SCP width is approximately 3.5 mm in controls and 1.5 mm in PSP patients.3 The small size of SCP can lead to substantial partial volume effects in DTI protocols (voxel sizes>2×2×2mm3) and may corrupt estimation of SCP tissue properties. Here, we used a high-resolution DTI protocol to minimize partial volume effects within SCP. Application of this protocol found measures consistent with SCP atrophy (increased MD and FW, decreased FA) and DN neurodegeneration (increased R2*) in the PSP group relative to the PD and MSA-P groups. The results agree with histological studies2,3 and prior imaging studies5-8 that found SCP undergoes atrophy in PSP.Acknowledgements
This work was supported by NIH-NINDS 1K23NS105944 (Huddleston) and NIH-NINDS 1U19AG071754 from the National Institutes of Health/National Institute of Neurological Diseases and Stroke, Michael J. Fox Foundation for Parkinson’s Research grants (MJFF-010556 and MJFF-010854),References
1. Richardson, et al. Supranuclear ophthalmoplegia, pseudobulbar palsy, nuchal dystonia and dementia. A clinical report on eight cases of "heterogenous system degeneration". Trans. Am. Neurol. Assoc., 88:25-9.
2. Steele, et al. Progressive supranuclear palsy, Arch. Neurol. 17:337-343.
3. Tsuboi, et al. Atrophy of superior cerebellar peduncle in progressive supranuclear palsy. Neurology. 60:1766-9.
4. Warmuth-Metz, et al. Measurement of the midbrain diameter on routine magnetic resonance imaging: a simple and accurate method of differentiating between Parkinson disease and progressive supranuclear palsy. Arch. Neurol. 58:1076-1079.
5. Paviour, et al. Regional brain volumes distinguish PSP, MSA-P, and PD: MRI-based clinico-radiological correlations. Mov. Disord. 21:989-996.
6. Hara, et al. Potential of a new MRI for visualizing cerebellar involvement in progressive supranuclear palsy Parkinsonism Relat. Disord. 20:157-161.
7. Paviour, et al. Quantitative MRI measurement of superior cerebellar peduncle in progressive supranuclear palsy. Neurology. 64:675-9.
8. Blane, et al. Measuring brain stem and cerebellar damage in parkinsonian syndromes using diffusion tensor MRI. Neurology. 67:2199–2205.
9. He, et al. Improved Neuroimaging Atlas of the Dentate Nucleus. Cerebellum 6:951-956.
10. Focke, et al. Differentiation of typical and atypical parkinson syndromes by quantitative MR imaging. Am. J. Neuroradiol. 32:2087-2092.
Figures