4183
Motor and Cognitive Deficits Accompanied by Progressive Microstructural and Metabolic Deterioration in a Mouse Model of Parkinson’s Disease1Department of Biomedical Engineering, National Yang Ming Chiao Tung University, Taipei, Taiwan, 2PhD Program in Medical Neuroscience, College of Medical Science and Technology, Taipei Medical University, Taipei, Taiwan, 3School of Medicine, College of Medicine, National Yang Ming Chiao Tung University, Taipei, Taiwan
Synopsis
Keywords: Parkinson's Disease, Parkinson's Disease
Motivation: The MitoPark mouse model, induced by mitochondrial dysfunction, has been confirmed to exhibit both motor and cognitive impairments resembling Parkinson's disease. However, further research is needed to delve into the mechanisms underlying these changes.
Goal(s): We aimed to explore age-related changes in behavioral performances, brain microstructure, and metabolic functions in MitoPark mice.
Approach: Every four weeks, a battery of tests including behavioral assessments, DTI scanning, and respiratory assays were performed on 8-week-old experimental mice.
Results: MitoPark mice showed progressive degeneration in both motor and cognitive functions and impairments of microstructure and energy metabolism in dopaminergic pathways with increasing age.
Impact: Progressively deteriorating mitochondrial respiration and glycolysis, impaired neural integrity, and demyelination in dopaminergic pathways in MitoPark mice may provide potential mechanisms underlying motor and non-motor deficits during the aging process of Parkinson's disease.
Introduction
Mitochondrial dysfunction is a critical factor in the pathophysiology of Parkinson's disease (PD), a neurodegenerative disorder associated with aging, marked by the progressive degeneration of the dopaminergic (DA) pathways1,2. MitoPark, a transgenic mouse model, was created to induce mitochondrial dysfunction in DA neurons by specifically inactivating mitochondrial transcription factor A3,4. This model demonstrates progressive DA neurodegeneration, motor deficits, and nonmotor symptoms resembling Parkinson's disease symptoms5. However, the mechanisms underlying these alterations, particularly the non-motor symptoms, still remain explored. In this study, we explored age-related changes in motor and cognitive functions as well as the structural and metabolic changes in brain regions regulating relevant functions in MitoPark mice. 8-week-old experimental mice underwent a series of tests every four weeks, including behavioral tests, diffusion tensor images (DTI) scanning, and a respiratory assay.Methods
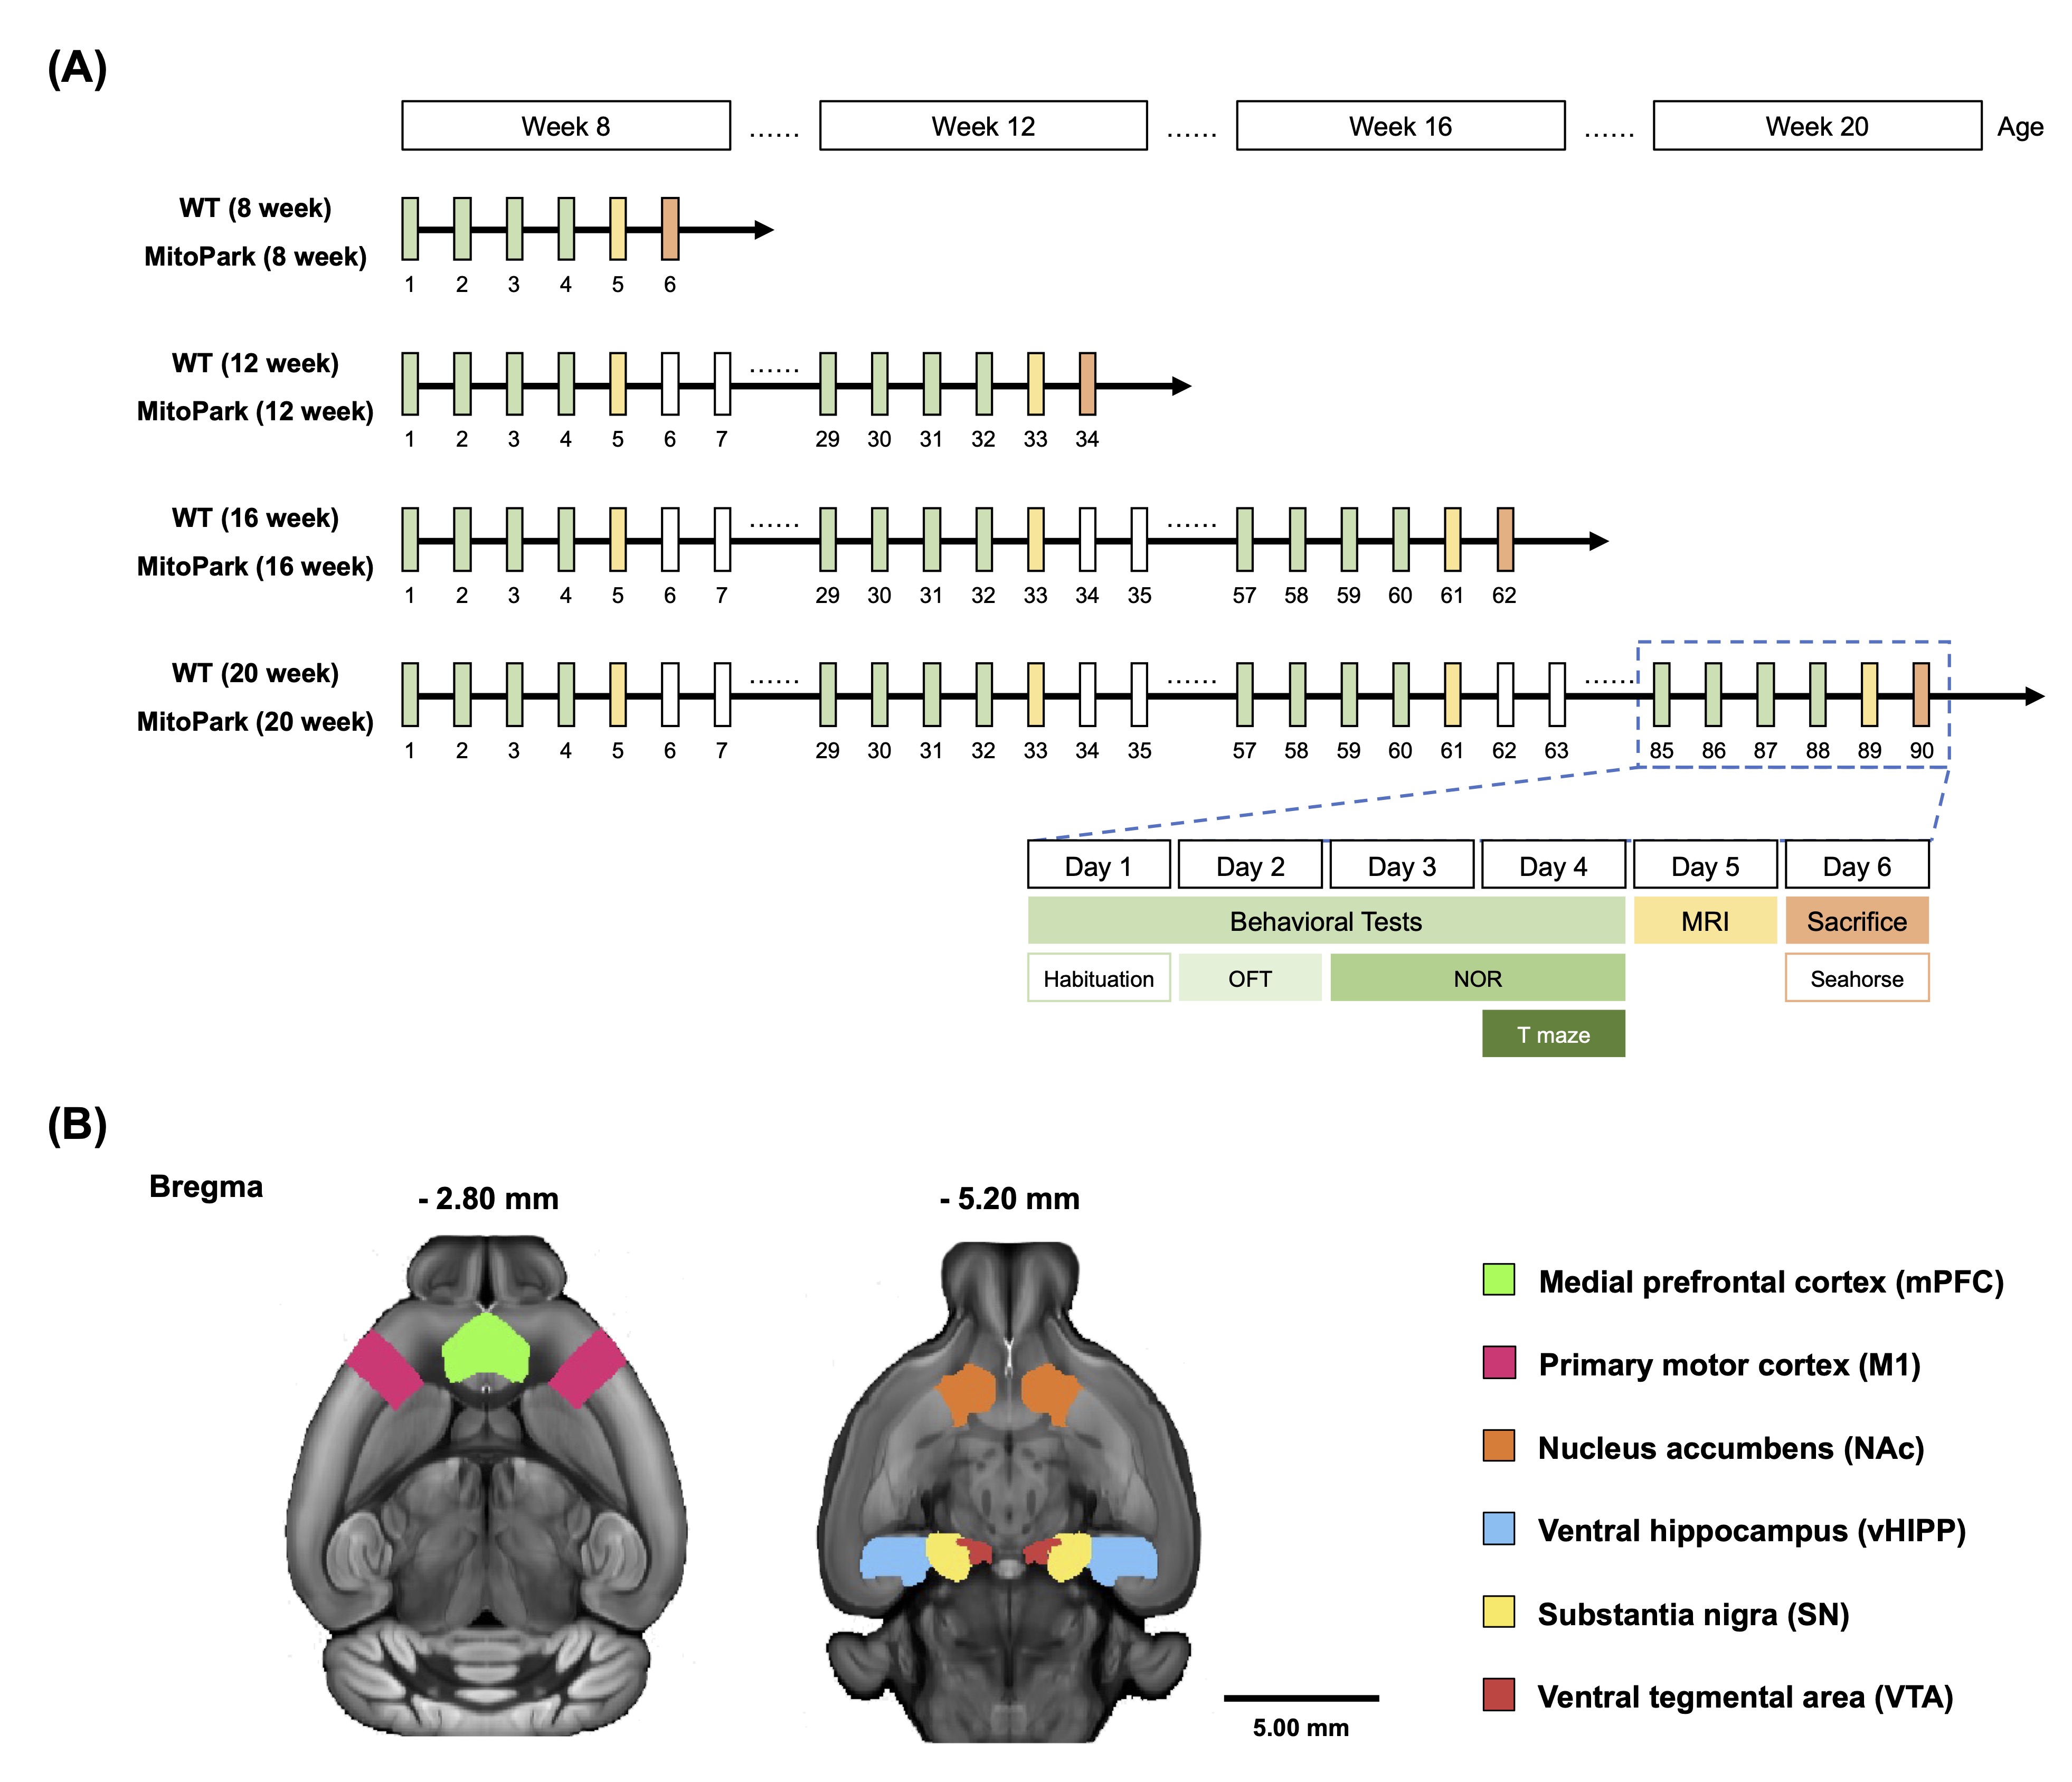
MitoPark mice were provided by Prof. Kai-Yun Chen at Taipei Medical University, and all mice for this study were bred and maintained at National Laboratory Animal Center6. This animal study was approved by Institutional Animal Care and Use Committees (IACUC) of Taipei Medical University. All mice were housed with water and standard food ad libitum at 25 °C in a 12 h/12 h light/dark cycle. In this study, MitoPark mice and wild-type controls (C57BL/6 mice) were subjected to MRI scanning and behavioral tests every four weeks. Respiratory assay was performed following sacrifice at ages 8, 12, 16, and 20 weeks (N = 5, each specified age per group). The experimental design and timeline are depicted in Figure 1A.For locomotor assessment, mice were conducted with open field test (OFT) and recorded for 10 mins7. Locomotor activities were measured by the OptiMouse program8. Novel object recognition task (NOR) was performed to evaluate long-term recognition memory9. Mice explored two identical objects on training day, while on testing day, one familiar object was replaced with a novel object. The time spent exploring each object was recorded. A preference index (PI) was calculated using the formula: PI = (novel object exploration time (n))/(novel object exploration time (n) + familiar object exploration time (f))×100%. T-maze task assessed spontaneous alternation in mice after an 8-hour water deprivation, involving 5 trials with 1-minute test and choice phases10. A successful trial was recorded when mice selected the opposite arm during the choice phase compared to the test phase.
During MRI session, 7 Tesla Bruker MRI scanner (Bruker Biospec 70/30 USR, Ettlingen, Germany) was used to obtain whole-brain MR images. The DtiEpi SpinEcho sequence was applied to acquire DTI. TR = 3,750 ms and TE = 40.28 ms, matrix size = 50 × 50, FOV = 20 × 20 mm2, thickness of slice = 0.4 mm, 15 horizontal slices, 20 ms in diffusion time. The encoding duration of diffusion was 6 ms while obtaining 12 diffusion sampling directions in total. Regions of interest (ROIs) were selected according to the Allen mouse brain atlas11, including the medial prefrontal cortex (mPFC), primary motor cortex (M1), neucleus accumbens (NAc), ventral hippocampus (vHIPP), substantia nigra (SN), and ventral tegmental area (VTA) related to the limbic and motor circuits (Figure 1B). DTI analysis was performed by DSI Studio (http://dsi-studio.labsolver.org) to obtain diffusion indices of fractional anisotropy (FA) and radial diffusivity (RD) values.
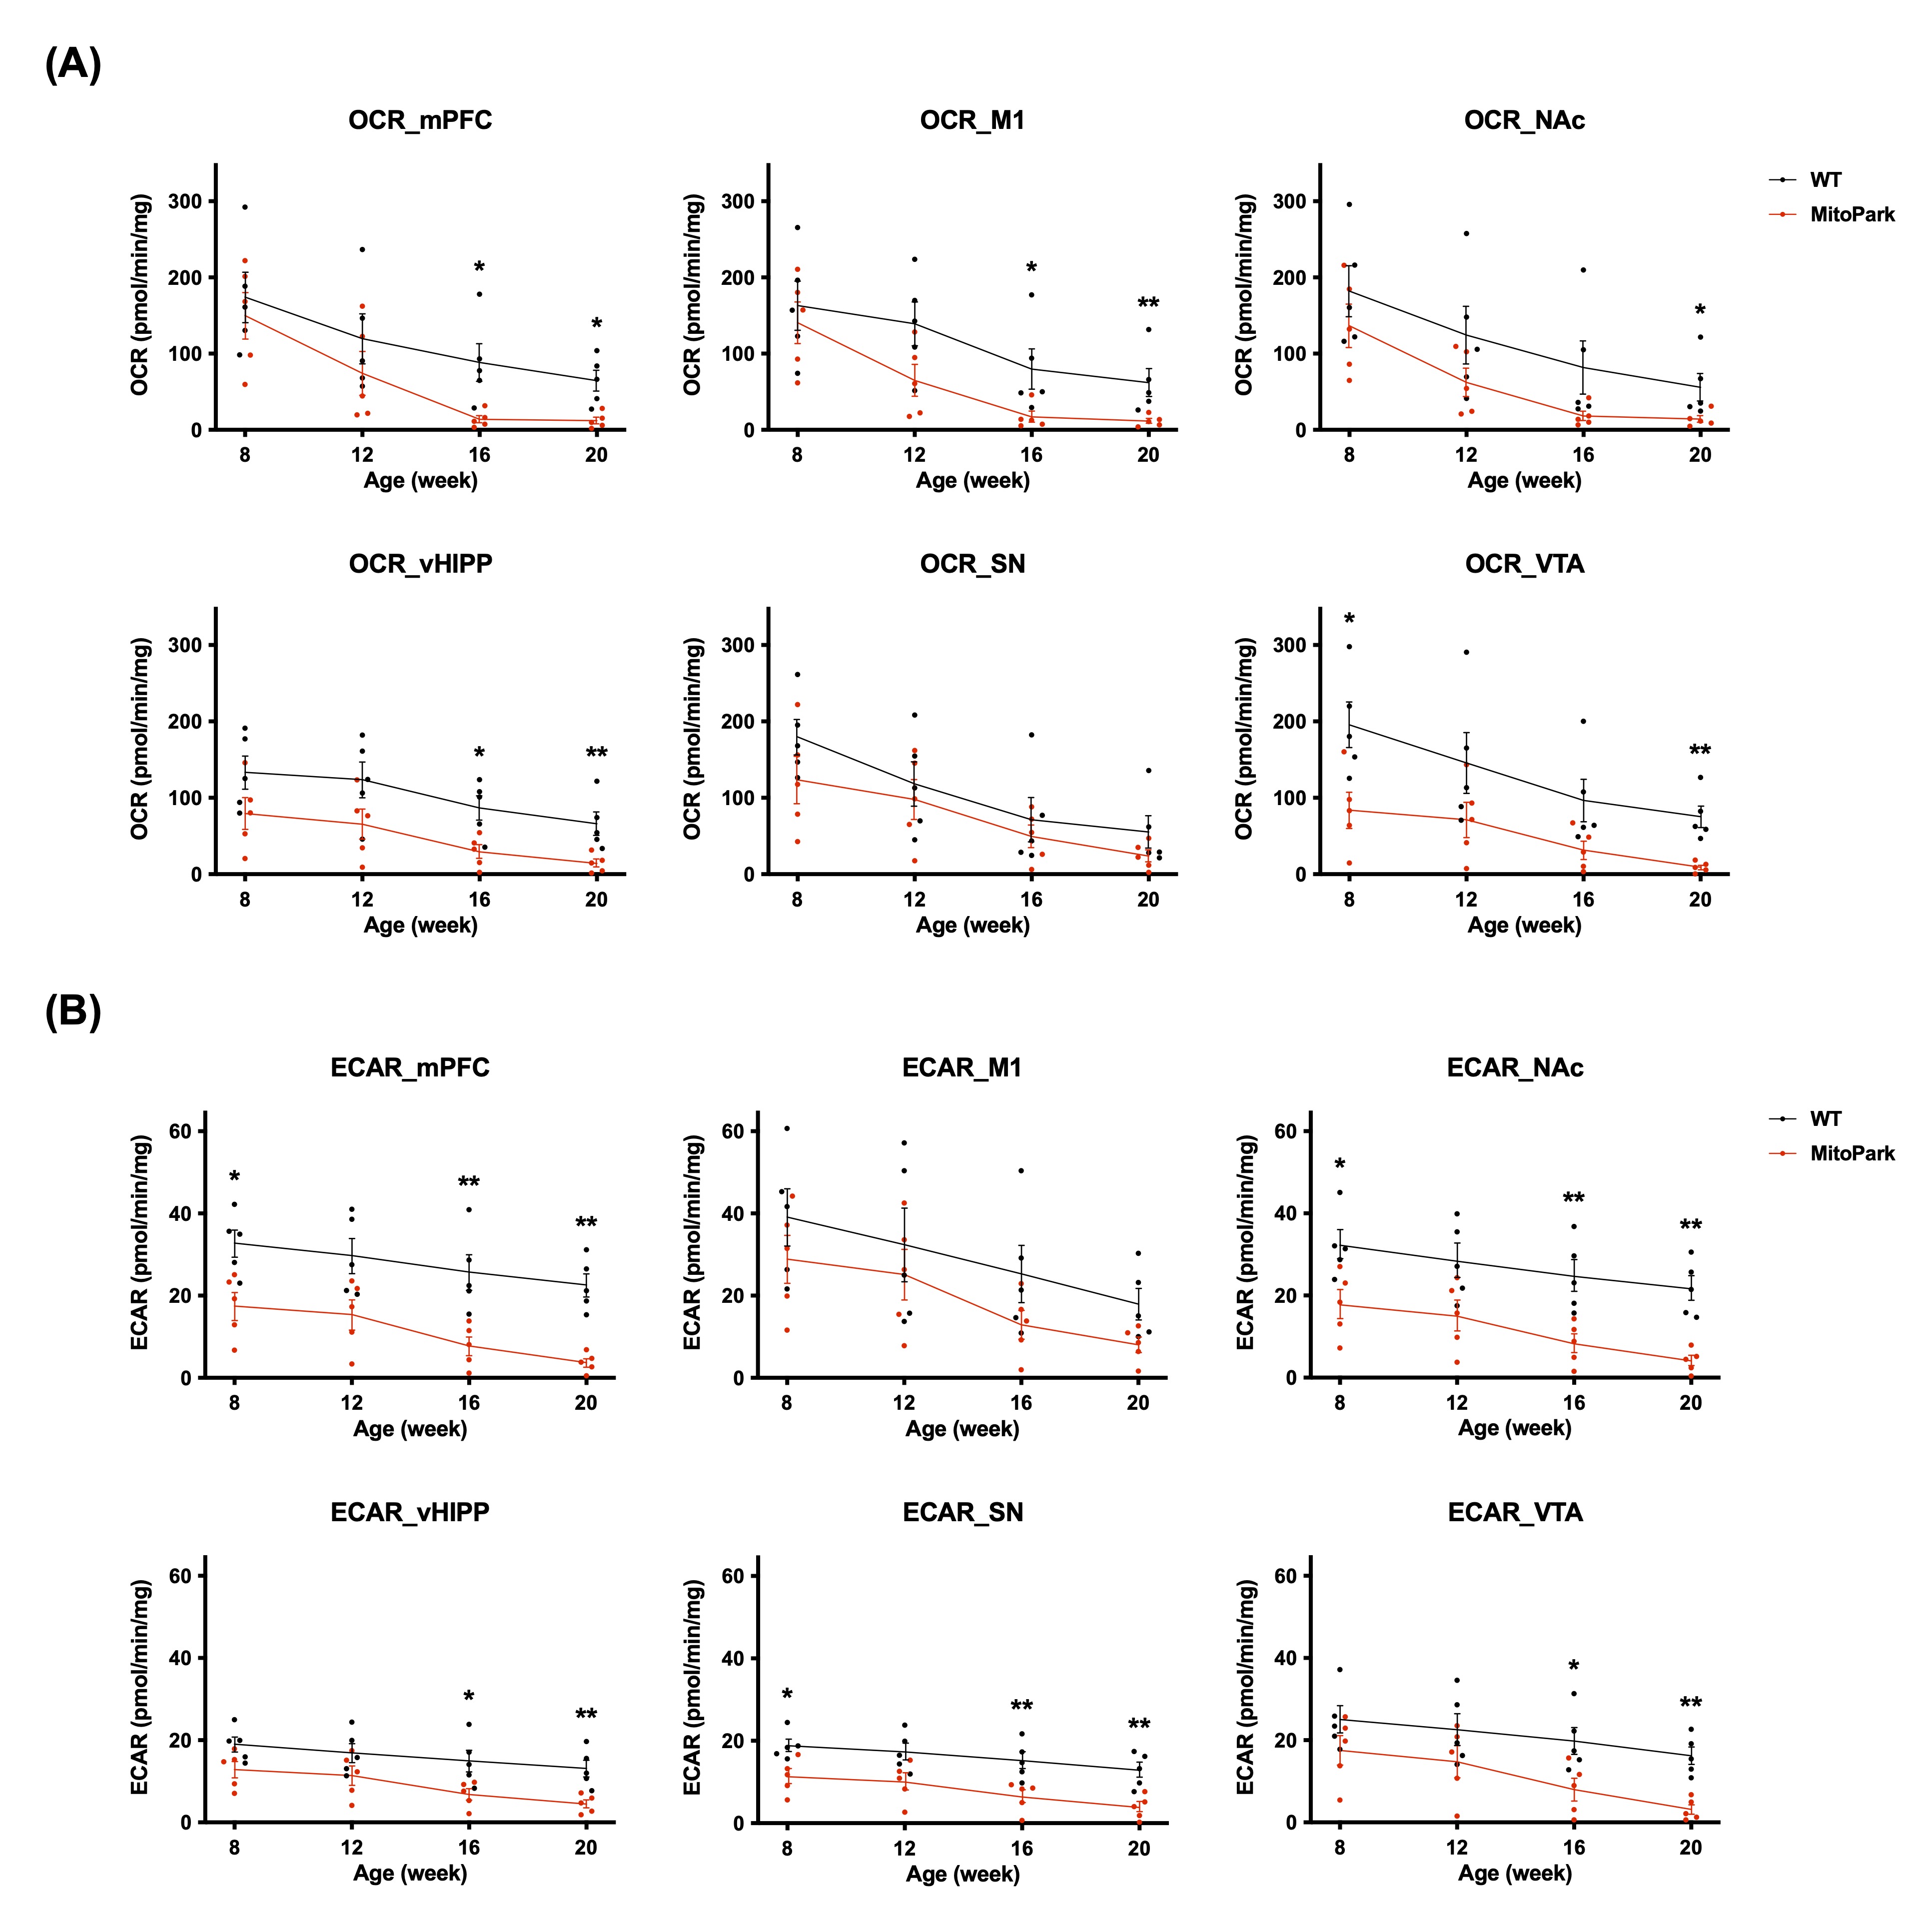
After sacrificing the mice, their brain tissues were dissected and subjected to a respiratory assay (Seahorse XF Analyzer, Agilent) to measure oxygen consumption rate (OCR) and extracellular acidification rate (ECAR)12.
Group comparisons between the WT and MitoPark groups were done using the Mann-Whitney U test. Significance was inferred at a p-value < 0.05. The data were represented as the mean and the standard error of the mean (SEM).
Results
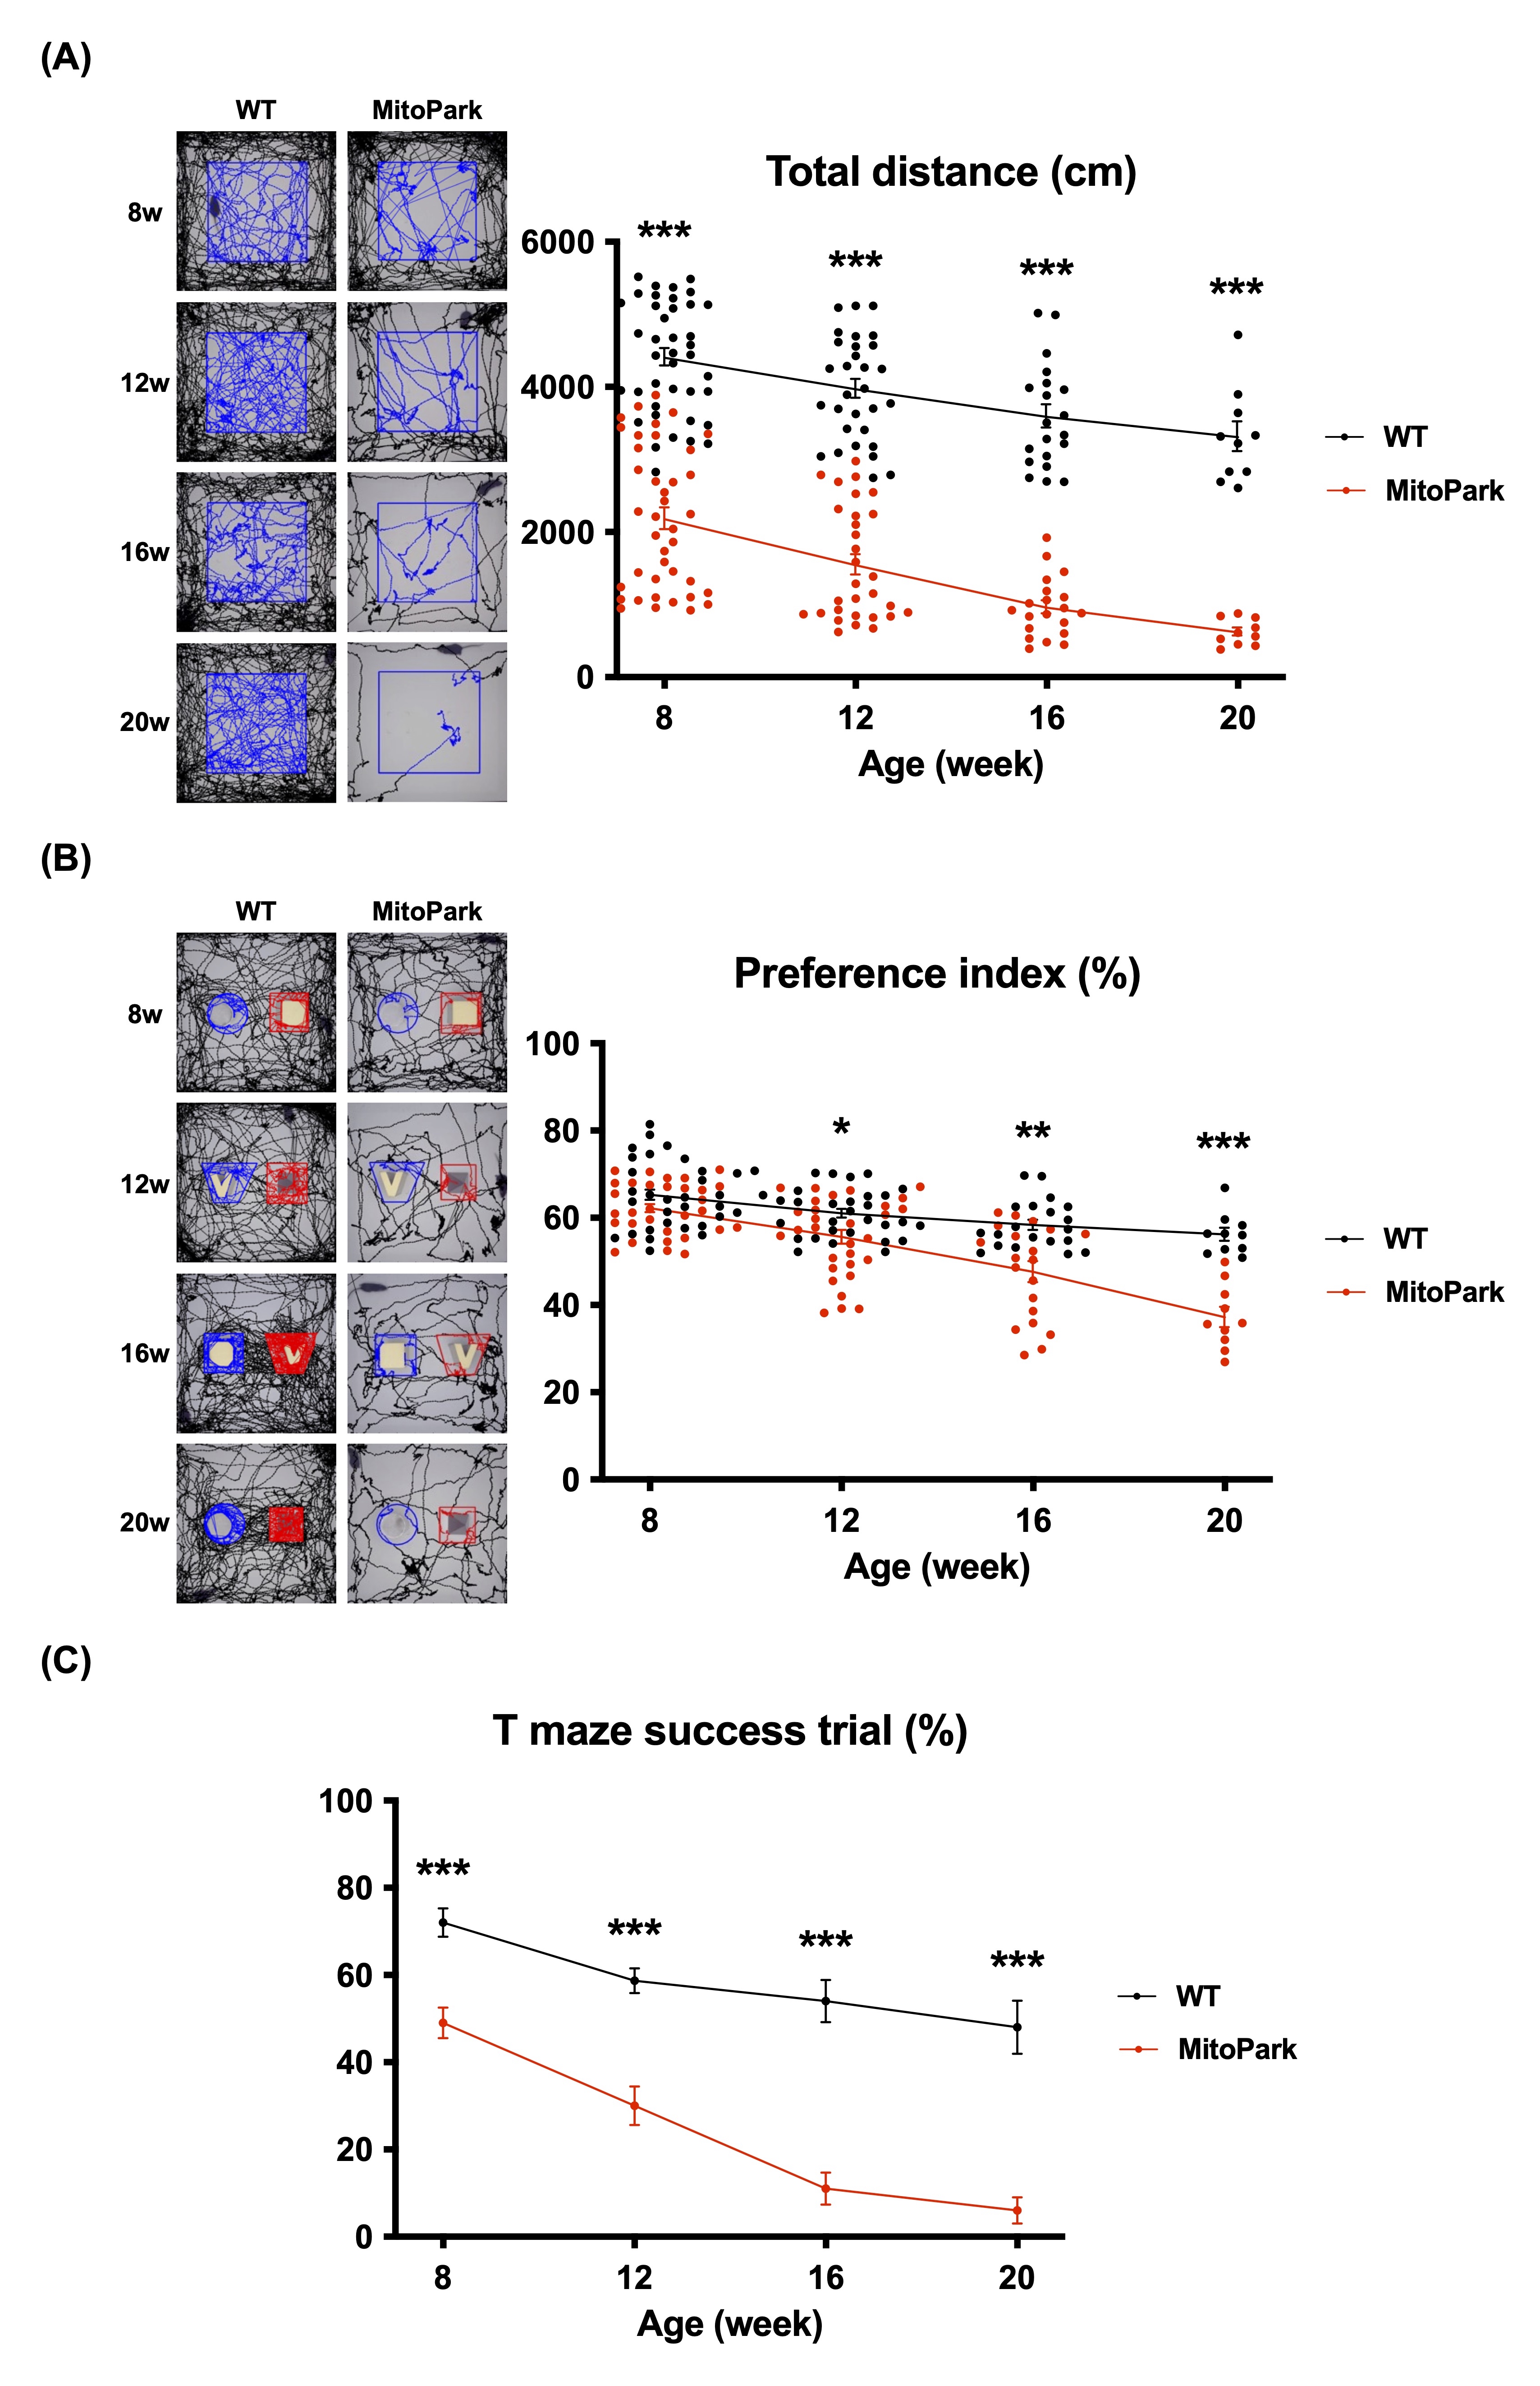
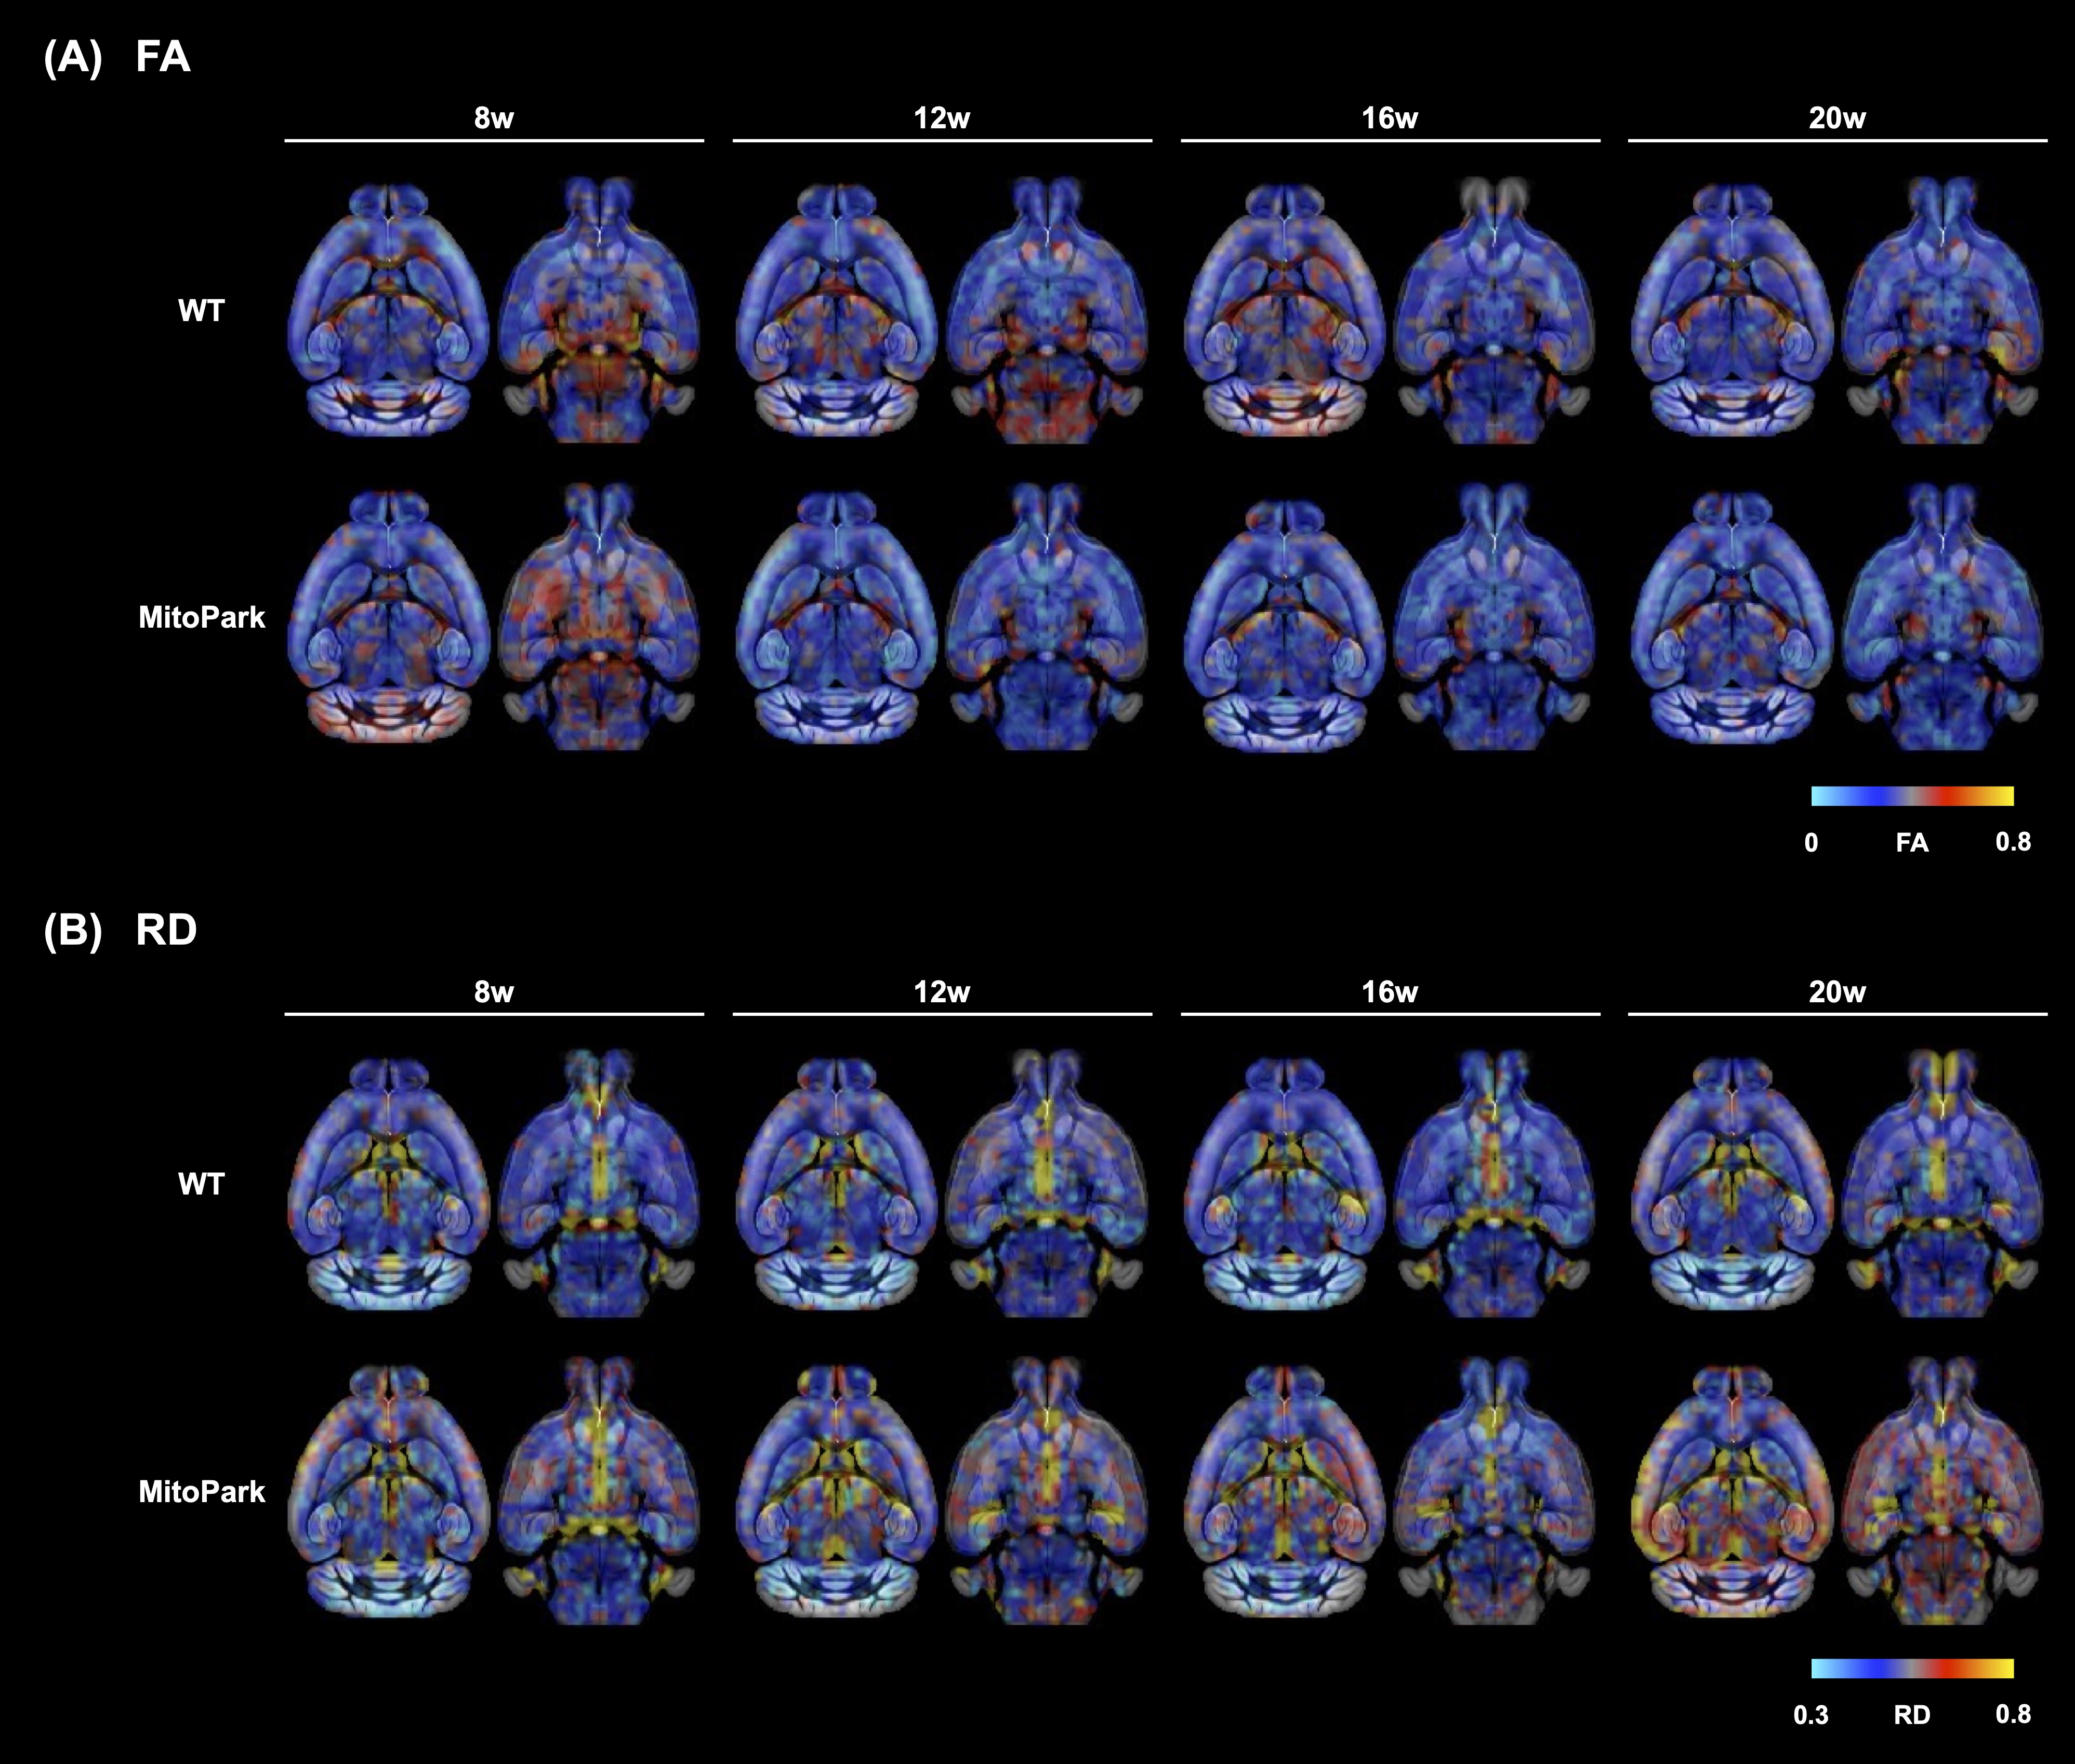
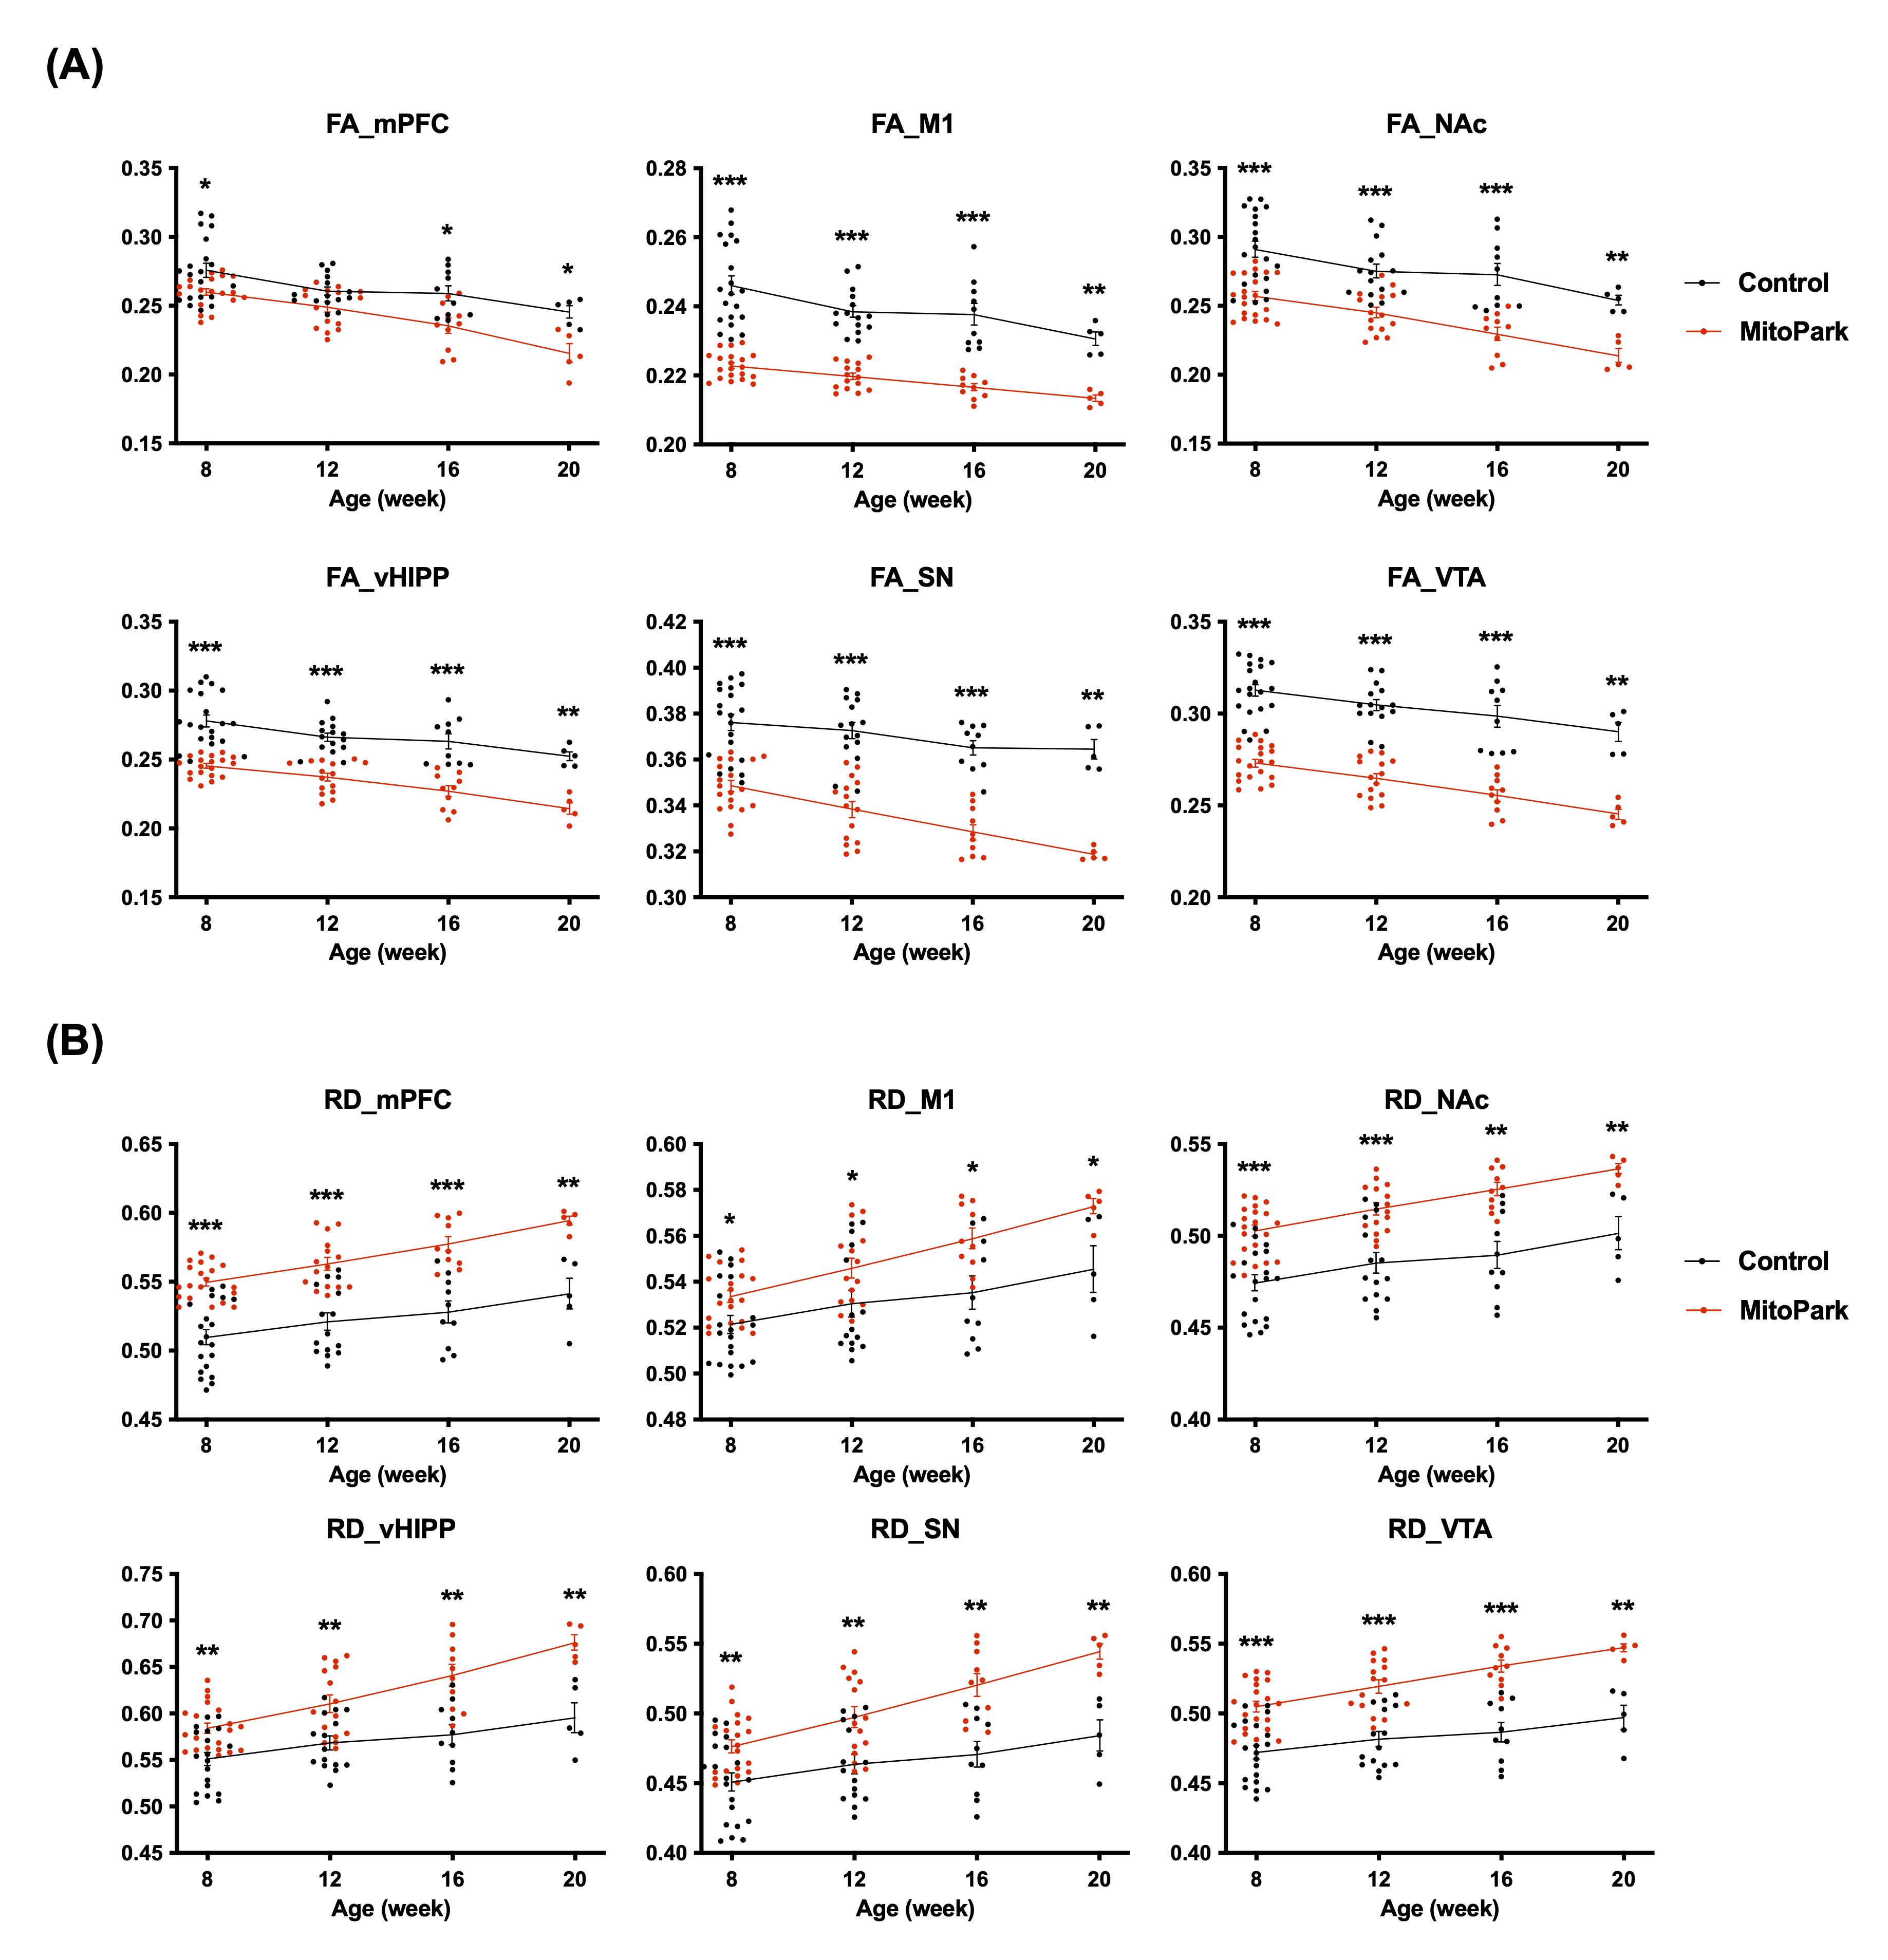
MitoPark mice revealed decreased locomotor activities, long-term recognition memory, and working memory progressively worsening over time (Figure 2). ROI-based DTI analyses were performed to assess the microstructural changes between the WT and MitoPark groups (Figure 3). As shown in Figure 4, significantly lower FA and higher RD values were found when comparing MitoPark to WT, indicating impaired neural integrity and demyelination among brain regions as the age of MitoPark transgenic mice increased. There were less OCR and ECAR in MitoPark group than the WT group, showing the brain cells in MitoPark mice are not very energetic via either mitochondrial respiration or glycolysis pathways (Figure 5).Conclusion
This study presented a progressive degeneration in both motor and cognitive functions with increasing age in MitoPark mice. Furthermore, the microstructural damages revealed by MRI and declines in energy metabolism functions may be associated with the observed motor and cognitive deficits during the aging process of PD.Acknowledgements
This work is financially supported by the National Science and Technology Council under Contract numbers of NSTC 112-2622-8-A49 -010 -TE2, 111-2221-E-A49 -049 -MY2, 112-2314-B-303 -016 -, 112-2321-B-A49 -009 -.References
- Norat P, Soldozy S, Sokolowski JD, et al. Mitochondrial dysfunction in neurological disorders: Exploring mitochondrial transplantation. NPJ Regenerative Medicine. 2020;5(1):1-9.
- Kalyanaraman B. Teaching the basics of repurposing mitochondria-targeted drugs: from Parkinson's disease to cancer and back to Parkinson's disease. Redox Biology. 2020;36:101665.
- Ekstrand MI, Terzioglu M, Galter D, et al. Progressive parkinsonism in mice with respiratory-chain-deficient dopamine neurons. Proceedings of the National Academy of Sciences. 2007;104(4):1325-1330.
- Ekstrand MI, Galter D. The MitoPark Mouse - An animal model of Parkinson's disease with impaired respiratory chain function in dopamine neurons. Parkinsonism & Related Disorders. 2009;15:S185-S188.
- Beckstead MJ, Howell RD. Progressive parkinsonism due to mitochondrial impairment: Lessons from the MitoPark mouse model. Experimental neurology. 2021;341:113707.
- Hsieh TH, Kuo CW, Hsieh KH, et al. Probiotics alleviate the progressive deterioration of motor functions in a mouse model of Parkinson’s disease. Brain Sci. 2020;10(4):206.
- Seibenhener ML, Wooten MC. Use of the open field maze to measure locomotor and anxiety-like behavior in mice. Journal of visualized experiments: JoVE. 2015(96).
- Ben-Shaul Y. OptiMouse: a comprehensive open source program for reliable detection and analysis of mouse body and nose positions. BMC biology. 2017;15(1):1-22.
- Leger M, Quiedeville A, Bouet V, et al. Object recognition test in mice. Nature Protocols. 2013;8(12):2531-2537.
- Deacon RM, Rawlins JNP. T-maze alternation in the rodent. Nature protocols. 2006;1(1):7-12.
- Lein ES, Hawrylycz MJ, Ao N, et al. Genome-wide atlas of gene expression in the adult mouse brain. Nature. 2007;445(7124):168.
- Lai J-H, Chen K-Y, Wu JC-C, et al. Voluntary exercise delays progressive deterioration of markers of metabolism and behavior in a mouse model of Parkinson’s disease. Brain research. 2019;1720:146301.
Figures