4169
UPsampling by Subspace Informed ZEro-padded Reconstruction (UPSIZER) in Diffusion Tensor Imaging1Physics and Astronomy, University of British Columbia, Vancouver, BC, Canada, 2Medicine, University of British Columbia, Vancouver, BC, Canada
Synopsis
Keywords: Sparse & Low-Rank Models, Diffusion Tensor Imaging
Motivation: Diffusion tensor imaging (DTI) is inherently resolution limited by MRI gradient performance and human tolerance of gradient slew rates but could benefit greatly from finer detail for tissue mapping.
Goal(s): To increase the resolution of DTI images by using the joint information between different encoding directions to improve efficiency of upsampling.
Approach: Using a compressed sensing subspace-based reconstruction algorithm on zero-padded k-space to estimate a higher resolution image with finer detail than current interpolation strategies.
Results: Smoother diffusion encoded images and reduced spatial blurring in calculated metrics compared to standard cubic interpolation was achieved.
Impact: A new method for upsampling diffusion images using subspace-based compressed sensing reconstruction is introduced that includes fine detail and reduces noise. Potential for improving on standard cubic interpolation is demonstrated, which will benefit DTI analysis including tractography.
Introduction
Interpolation of diffusion tensor imaging (DTI) scans is a common preprocessing step in DTI pipelines to improve image resolution before calculation of the diffusion tensors1. A common upsampling technique, cubic interpolation, introduces spatial blurring, especially across small structures with high contrast differences. Maintaining fine detail is necessary for accurate estimation of diffusion tensors in fine structures like small nerve tracts. However, DTI scans contain many images, each of which contain different information about tissues and image edges. Including this shared information when increasing the scan resolution should improve the estimation of fine structures compared to cubic interpolation.Methods
Five DTI datasets with a variety of b-values and diffusion encoding directions were acquired. The images were unwarped and eddy current corrected using FSL's topup and eddy2,3,4. The corrected images were then upsampled from 2x2x2mm to 1x1x2mm using cubic interpolation and the subspace-based reconstruction upscaling technique to assess differences between upsampling algorithms. The upsampled datasets were then analyzed using FSL and mrtrix3’s dwi2fod, tckgen and tcksift functions2,5,6,7,8 to assess changes in fractional anisotropy maps9, orientation distribution functions10 (ODFs) and tractography performance. All images shown are from a 128 direction diffusion scan with b-values 0,500,1000 and 2000 s/mm2 and are representative of the dataset.To perform the subspace-based interpolation, individual diffusion images were fourier transformed into k-space, zero-padded to the new resolution, then reconstructed using a subspace-based compressed sensing algorithm using the ‘pics’ function from BART11,12. The subspace basis set was generated using the singular vector decomposition of the original images and the subspace size was chosen by excluding all basis vectors representing less than 0.05% of the total imaging data.
Results
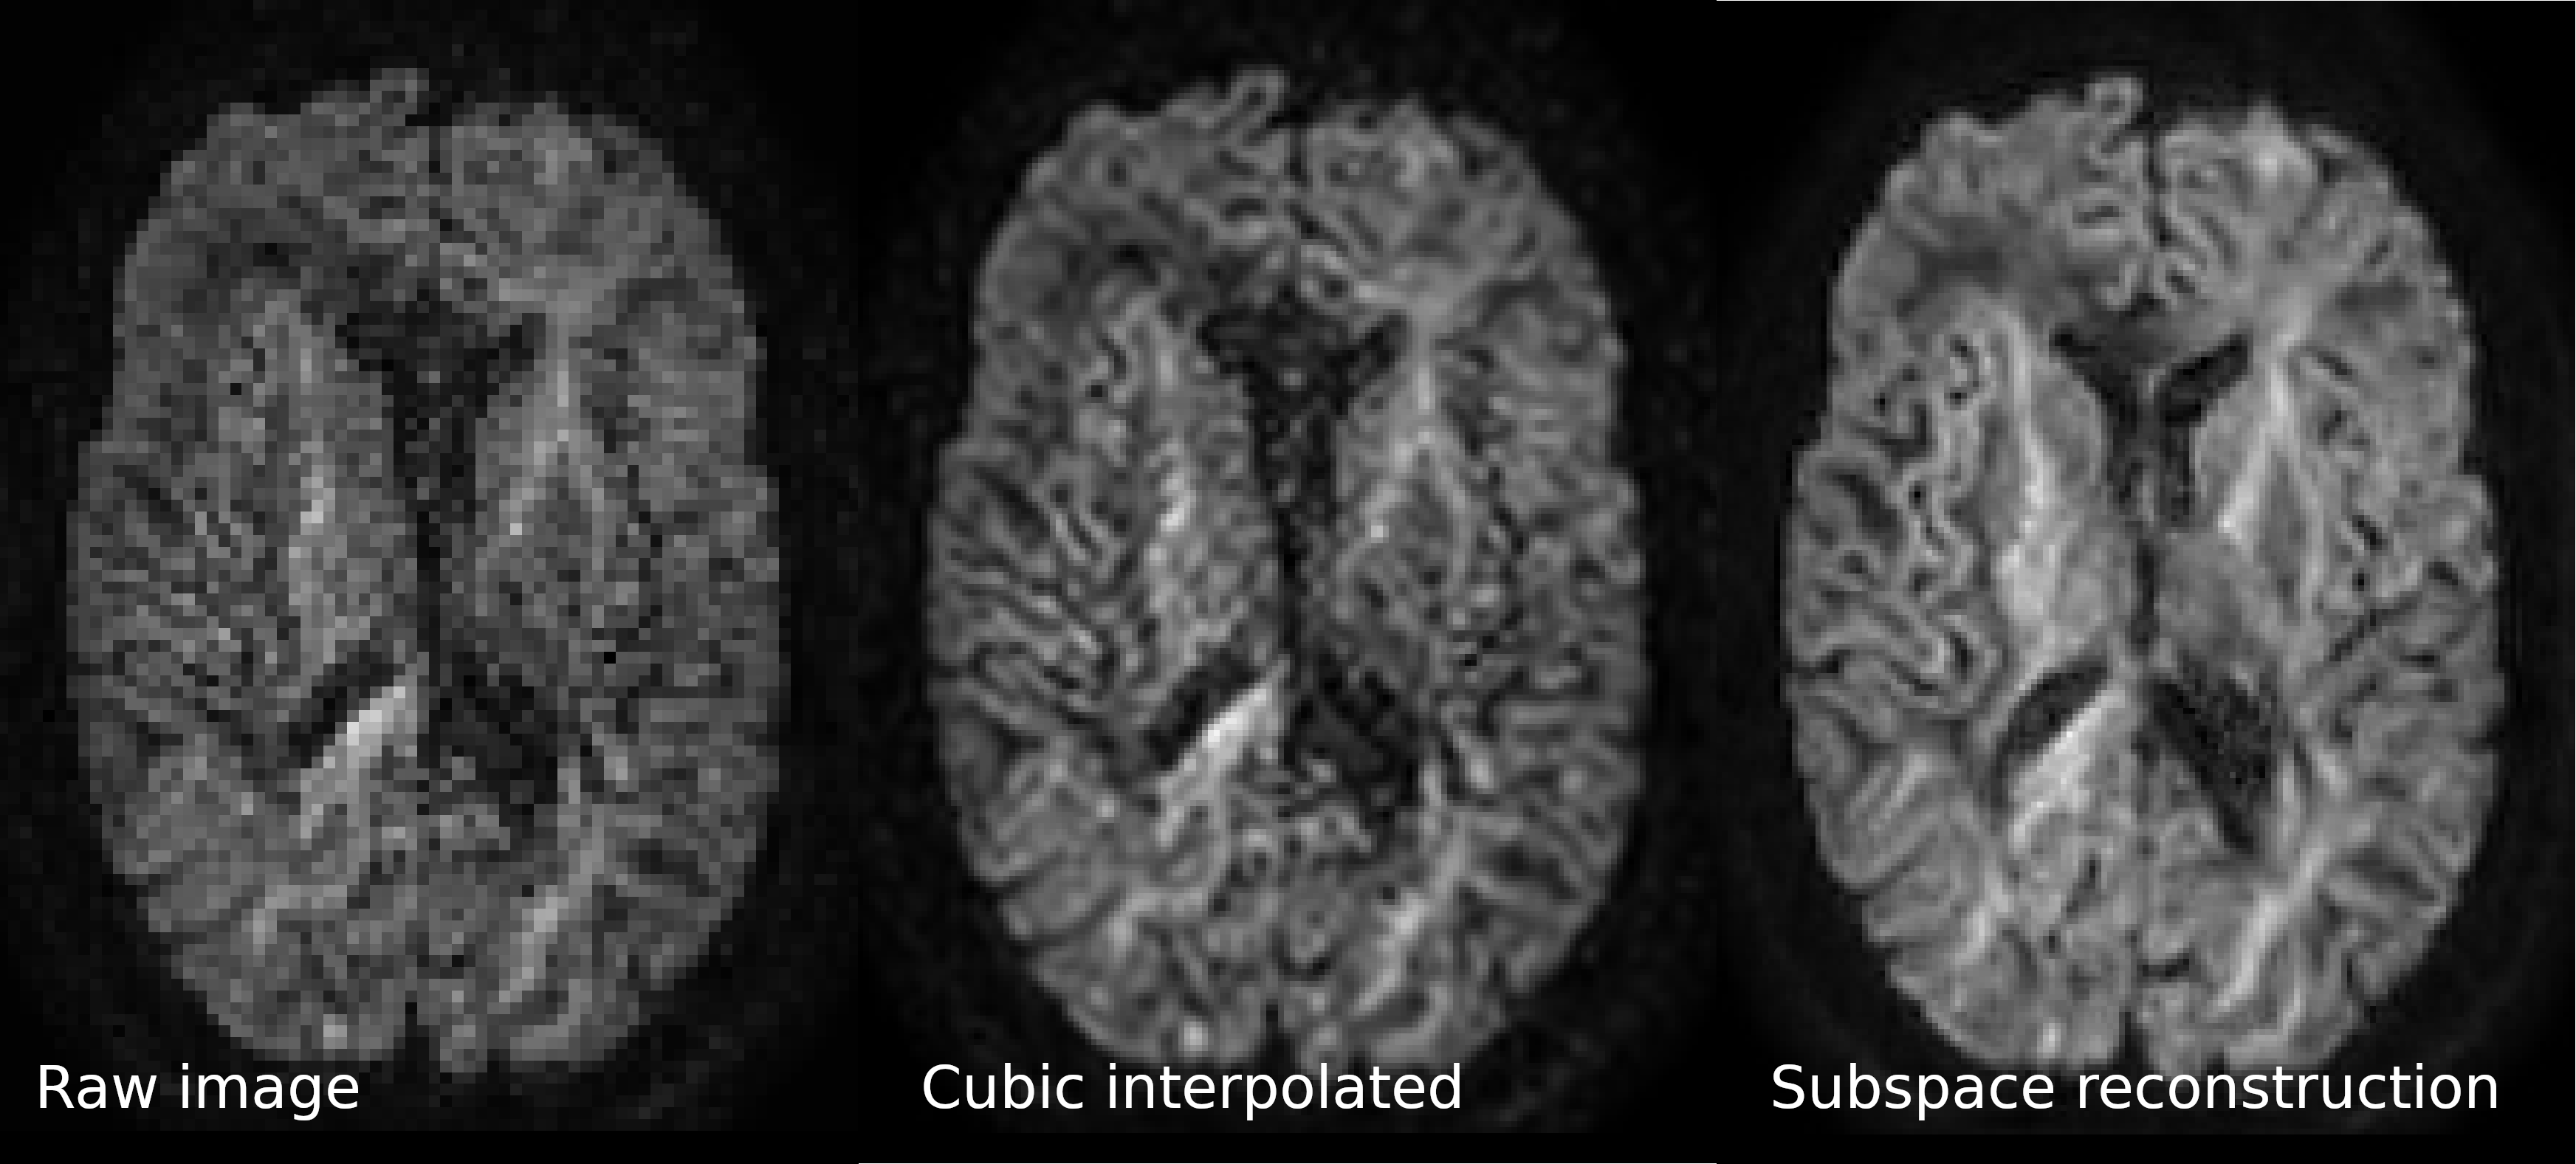
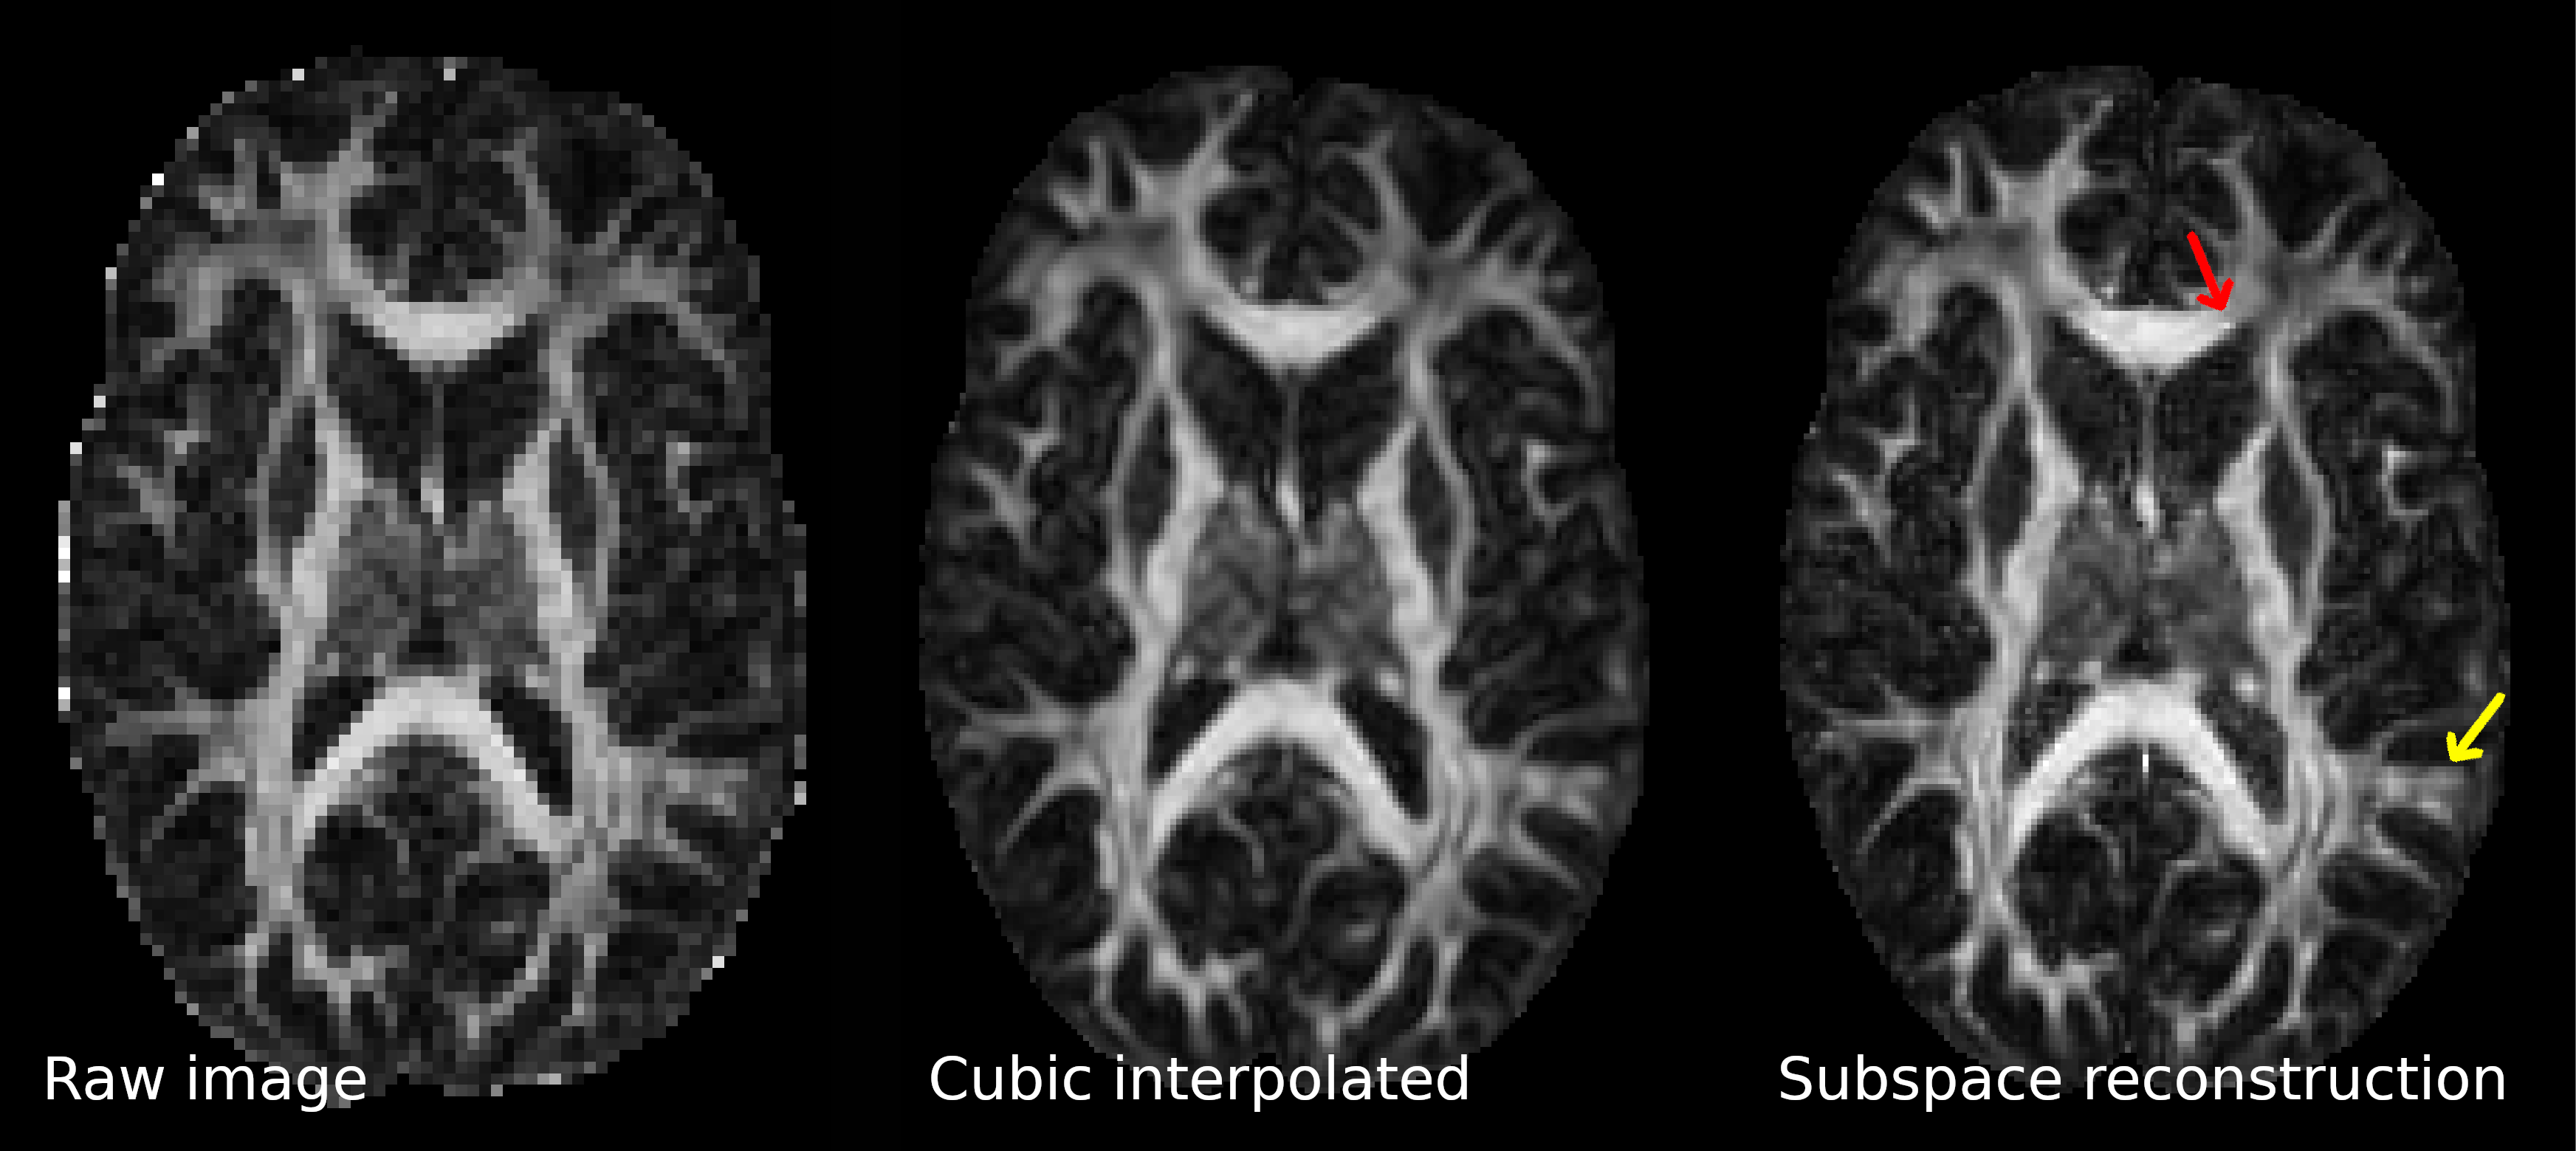
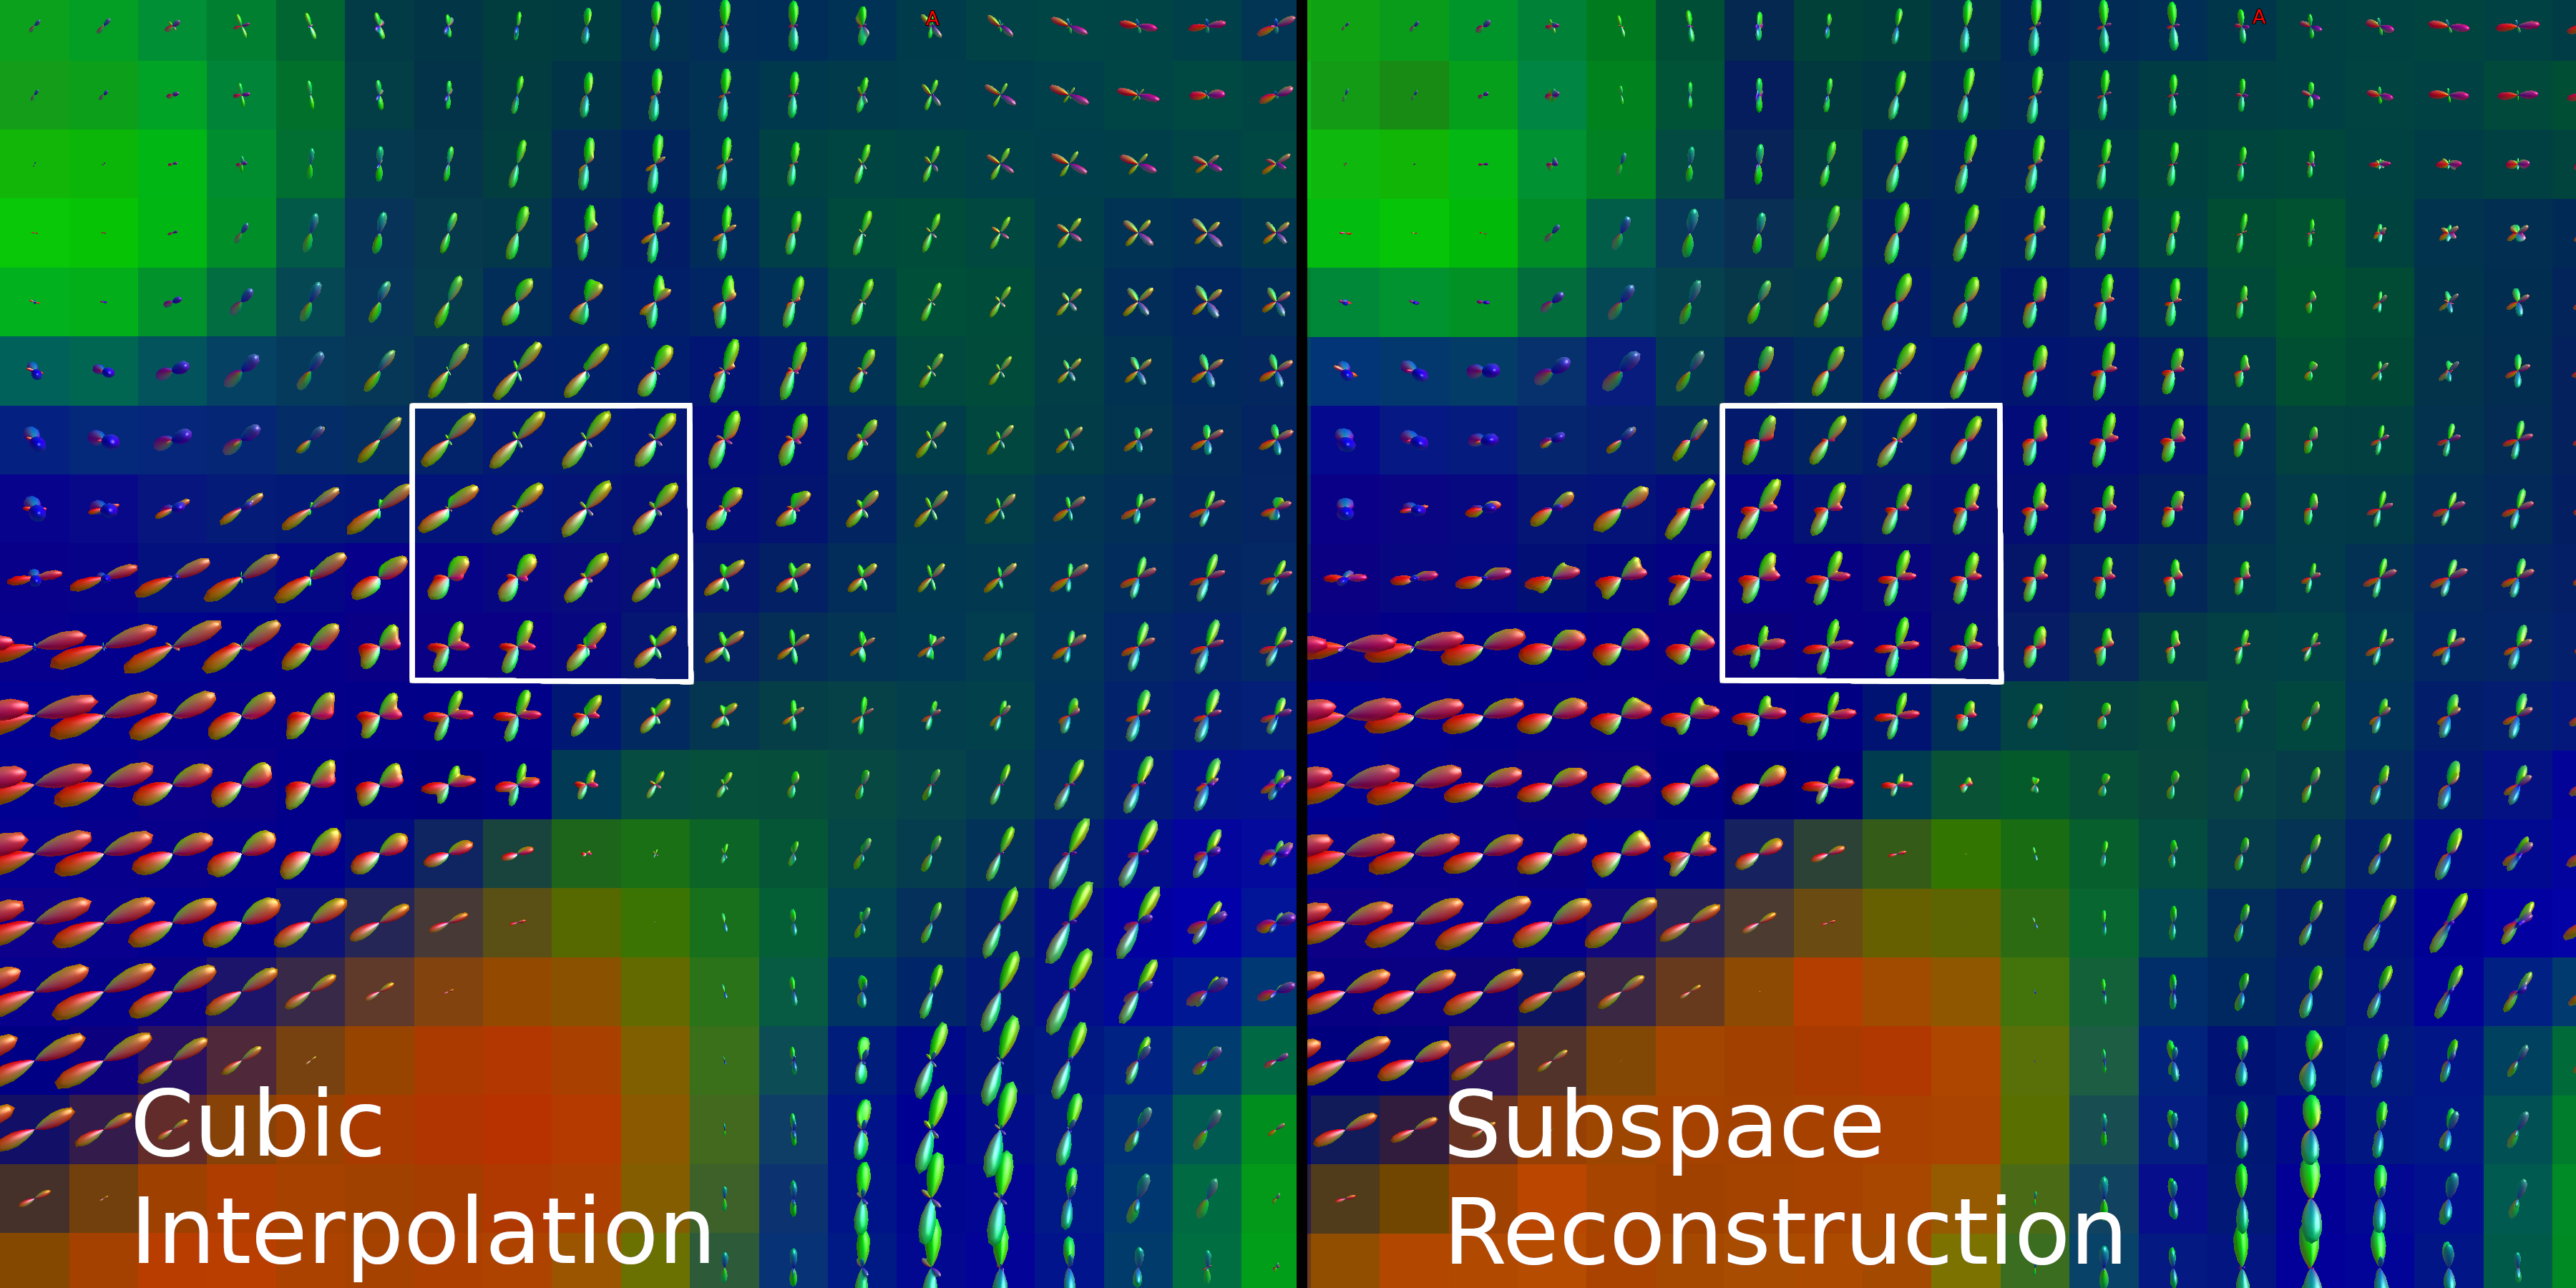
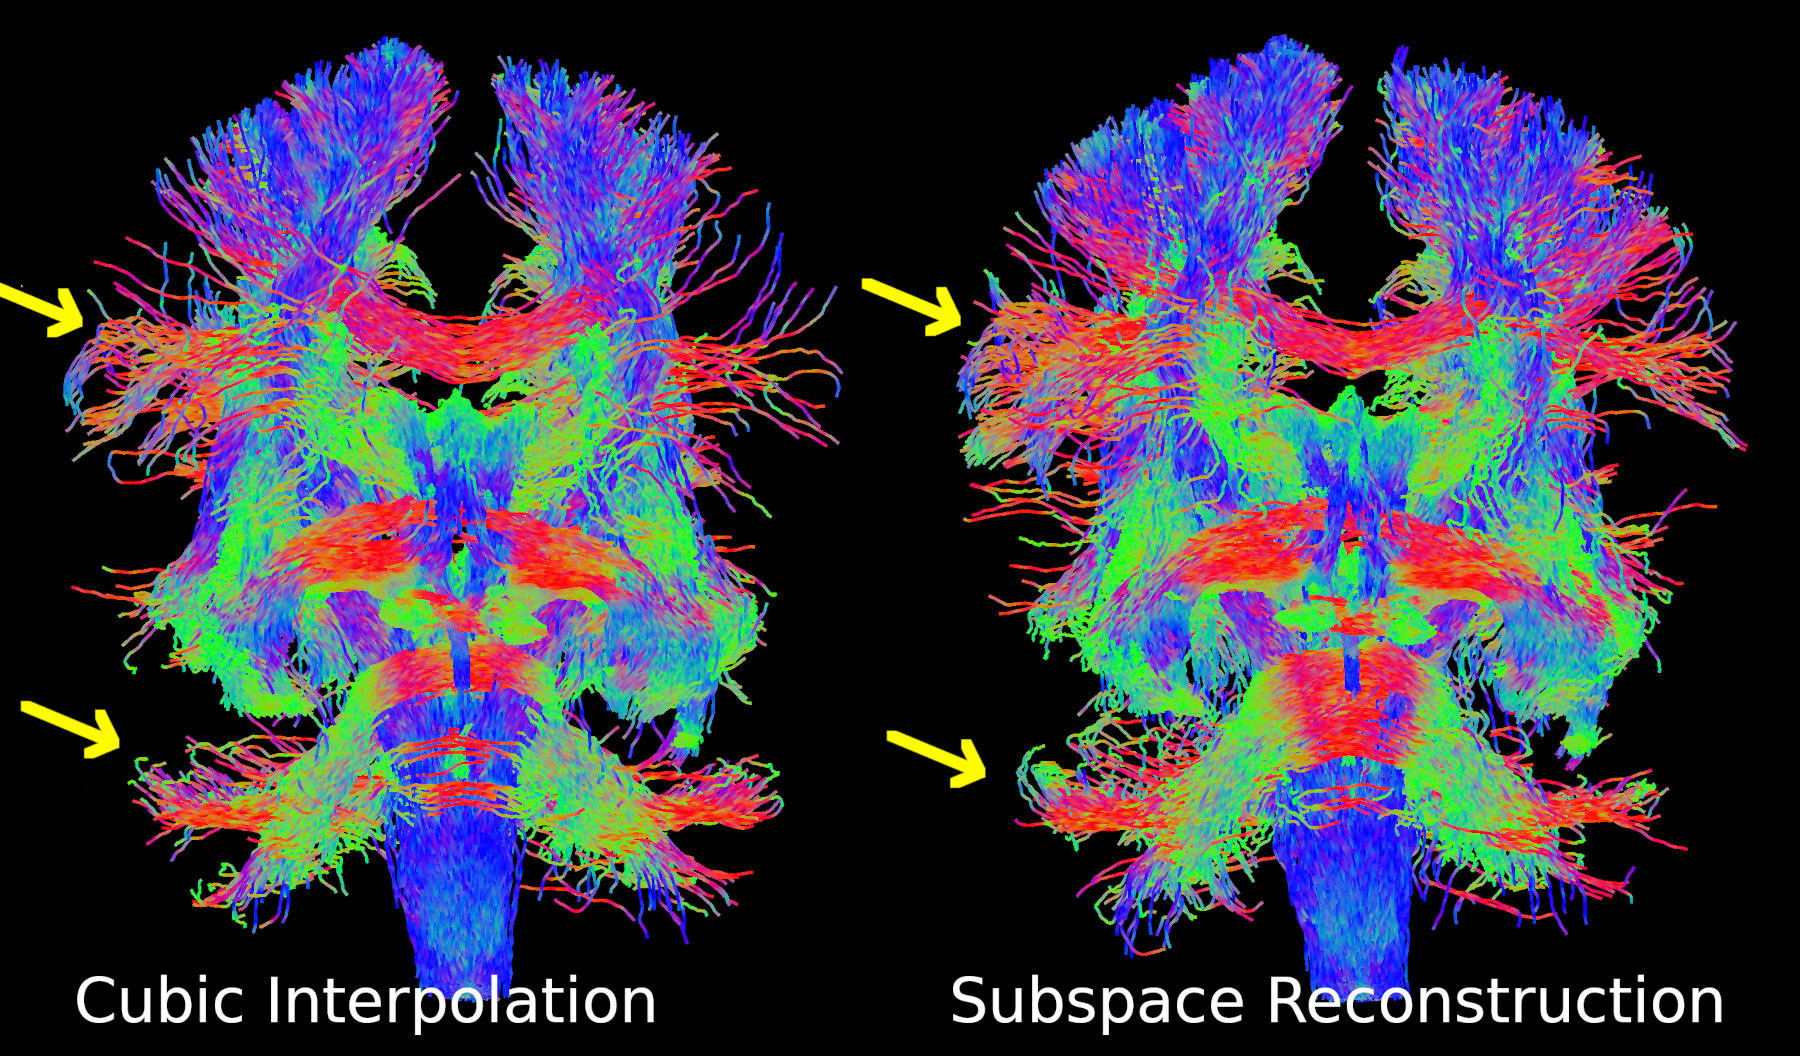
Across all five diffusion scans upscaled, subspace-reconstructed diffusion images showed a significant improvement in image quality over cubic interpolated images. In Figure 1, finer detail, and higher apparent signal to noise ratio (SNR) can be observed on subspace-based upscaled images compared to raw images and cubic interpolation, notably at the borders of gray matter, white matter and cerebrospinal fluid in the gyri. This denoising effect is similar to Marchenko-Pastur Principal Component Analysis (MP-PCA) denoising as described by Veerart et al13.Calculated metrics had less obvious benefits and some artifacts from the upscaling algorithm; finer detail was preserved but with line and grid shaped artifacts apparent in Figure 2, which displays fractional anisotropy (FA) maps of raw, cubic interpolated and subspace-based interpolation. In Figure 3, better resolved ODFs of the subspace upsampled images are shown in regions of crossing fibers at the anterior aspect of the corpus callosum. Finally, Figure 4 shows tractography of 20,000 fiber tracts seeded in the optic nerve (chosen to attempt to assess performance in a small structure) anterior to the optic chiasm. Tractography demonstrated a greater set of total streamlines especially to the parietal lobe and cerebellum.
Discussion
Using a compressed sensing subspace reconstruction algorithm on zero-padded k-space resulted in finer detail and higher apparent SNR on upsampled images, providing refinements for calculating ODFs and performing tractography.The reconstruction process limits the data to a specific number of basis vectors. Higher-order diffusion information may not be represented in the subspace basis vectors and hence lost during the upsampling process. This can be addressed through careful choice of the number of subspace vectors to balance performance in upsampling while retaining maximum diffusion information.
Due to the use of shared information between diffusion directions, interpolation effects are magnified on FA maps, resulting in line or grid-shaped artefacts, and individual voxels of high FA. This can be reduced with further optimization of the upsampling method.
Additionally, performance depends on the SNR characteristics of the original dataset, number of b-vectors, regularization factors and upsampling factor. The algorithm can be tuned to individual acquisition parameters for optimal upsampling and is most useful only for small upscaling factors.
Next steps will include 3D reconstructions (preliminary work has been successful at also interpolating the slice direction), quantifying the relationship between maximuminterpolation factor to number of subspace vectors and diffusion directions, and reduction of interpolation artefacts through optimization of the reconstruction parameters.
Conclusions
This novel subspace-based upsampling algorithm shows potential for improving interpolation blurring and noise in DTI images and shows benefits for resolution-sensitive DTI processing such as tractography.Acknowledgements
We would like to thank the volunteers who participated in this study, and UBC MRI Research's MR technologists and staff. We thank our funding sources for this study: Natural Sciences and Engineering Research Council (NSERC), Canadian Institute for Health Research (CIHR), Michael Smith Health Research BC and Multiple Sclerosis Canada.References
Dyrby T, Lundell H, Burke M, Reislev N, Paulson OB, Ptito M, Siebner HR. Interpolation of diffusion weighted imaging datasets. Neuroimage. 2014; 103:202-13. doi:10.1016/j.neuroimage.2014.09.005. PMID: 25219332.
Jenkinson M, Beckmann CF, Behrens TE, Woolrich MW, Smith SM. FSL. Neuroimage. 2012; 62:782-90
Andersson JLR, Skare S, Ashburner J. How to correct susceptibility distortions in spin-echo echo-planar images: application to diffusion tensor imaging. Neuroimage. 2003; 20(2):870-88. doi: 10.1016/S1053-8119(03)00336-7. PMID: 14568458.
Andersson JLR, Sotiropoulos SN. An integrated approach to correction for off-resonance effects and subject movement in diffusion MR imaging. Neuroimage. 2016; 125:1063-78. doi: 10.1016/j.neuroimage.2015.10.019. PMID: 26481672.
Tournier JD, Smith RE, Raffelt D, Tabbara, R, Dhollander T, Pietsch M, Christiaens D, Jeurissen B, Yeh CH, Connelly A. MRtrix3: A fast, flexible and open software framework for medical image processing and visualisation. Neuroimage. 2019; 202:116137. doi: 10.1016/j.neuroimage.2019.116137.
Jeurissen, B, Tournier JD, Dhollander T, Connelly A, Sijbers J. Multi-tissue constrained spherical deconvolution for improved analysis of multi-shell diffusion MRI data. Neuroimage. 2014; 103:411-26. doi: 10.1016/j.neuroimage.2014.07.061.
Tournier JD, Calamante F, Connelly A. Improved probabilistic streamlines tractography by 2nd order integration over fibre orientation distributions. Proceedings of the International Society for Magnetic Resonance in Medicine, 2010, 1670
Smith RE, Tournier JD, Calamante F, Connelly A. SIFT: Spherical-deconvolution informed filtering of tractograms. Neuroimage. 2013; 67:298-312. doi: 10.1016/j.neuroimage.2012.11.049.
Basser PJ, Pierpaoli, C. Microstructural and physiological features of tissues elucidated by quantitative-diffusion-tensor MRI. J Magn Reson B. 1996; 111(3):209-219. doi: 10.1006/jmrb.1996.0086. PMID: 8661285.
Tournier JD, Calamante F, Gadian DG, Connelly A. Direct estimation of the fiber orientation density function from diffusion-weighted MRI data using spherical deconvolution. Neuroimage. 2004;23(3):1176-85. doi: 10.1016/j.neuroimage.2004.07.037.
Uecker M, Ong F, Tamir JI, Bahri D, Virtue P, Cheng JY, Zhang T, Lustig M. Berkeley Advanced Reconstruction Toolbox. InProc Intl Soc Mag Reson Med. 2015; 23:2486.
Tamir JI, Ong F, Anand S, Karasan E, Wang K, Lustig M. Computational MRI with Physics-based Constraints: Application to Multi-contrast and Quantitative Imaging. IEEE Signal Process Mag. 2020;37(1):94-104. doi: 10.1109/msp.2019.2940062. PMID: 33746469.
Veraart J, Novikov DS, Christiaens D, Ades-Aron B, Sijbers J, Fieremans E. Denoising of diffusion MRI using random matrix theory. Neuroimage. 2016; 142:394-406. doi: 10.1016/j.neuroimage.2016.08.016. PMID: 27523449.
Figures