4166
Push-button liver DCE MRI: free-breathing, high-resolution 3D DCE with T1 mapping using multitasking joint reconstruction1United Imaging Healthcare, Houston, TX, United States, 2Department of Bioengineering, University of California, Los Angeles (UCLA), Los Angeles, CA, United States, 3Department of Radiology, Tongji Hospital of Tongji Medical College, Wuhan, China, 4Biomedical Imaging Research Institute, Cedars-Sinai Medical Center, Los Angeles, CA, United States
Synopsis
Keywords: Liver, Liver, DCE
Motivation: To address the pain points in clinical abdomen DCE, including sacrifice of spatial resolution for temporal resolution, repeated breath-hold, risk of missing contrast arrival, and the need for separate T1 mapping scan.
Goal(s): To develop an all-in-one, push-button abdomen DCE technique that improves kinetic mapping.
Approach: It was developed using MR multitasking joint reconstruction and tested on volunteer and phantom.
Results: Its feasibility was proven. Its feature includes free-breathing, high spatial and temporal resolution, and embedded T1 and B1 mapping for kinetic modeling correction.
Impact: Abdomen DCE with the proposed MR multitasking joint reconstruction approach can make clinical liver DCE more accessible, more accurate and hassle-free, allowing further researches on DCE in liver disease diagnosis.
Introduction
Dynamic contrast-enhanced (DCE) MRI of the liver can non-invasively characterize perfusion change in the parenchyma and angiogenic activity in lesions [1]. However, its clinical adoption is hindered by 1) the dilemma of choosing higher spatial or temporal resolution, 2) the need for repeated breath-hold in conventional techniques, and 3) the need for separate T1 and B1 mapping scans for kinetic modeling correction. Despite recent developments in free-breathing DCE techniques [2-3], native T1 is either presumed based on literature value, or obtained through a separate breath-hold mapping scan that results in patient discomfort and possible respiratory state mismatch.Here an all-in-one, push-button abdomen DCE technique is proposed to address the above three challenges. By employing the MR multitasking framework that can resolve multiple ‘tasks’ simultaneously using a low-rank tensor model [4-6], embedded B1 and T1 maps can be jointly reconstructed with the DCE images from a single scan. This technique allows free-breathing, achieves high DCE temporal resolution, and produces B1 and native-T1 maps with the same high spatial resolution and matched respiratory state as DCE images. The feasibility of this 6-min push-button technique is evaluated.
Methods
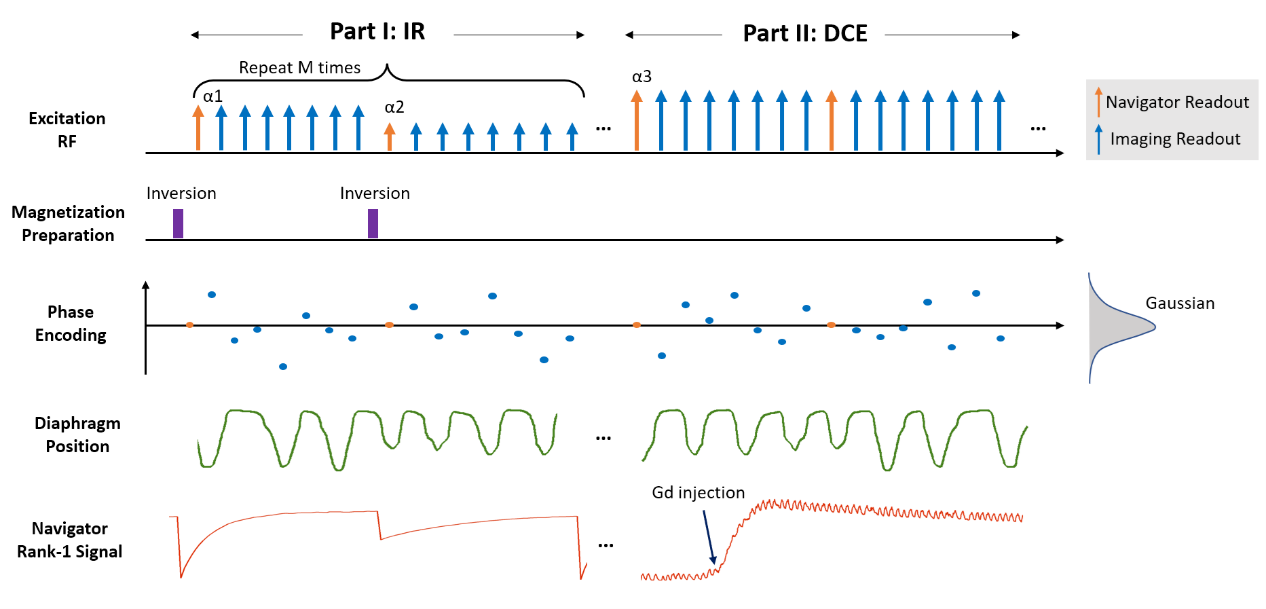
Sequence design: A two-part, 3D spoiled-GRE sequence was developed (Figure 1). In Part I (IR), periodically applied inversion recovery pulses and alternating excitation flip angles (3° and 10°) create B1 and T1 dependent magnetization recovery. In Part II (DCE), a constant flip angle is used to capture post-contrast signal change. The phase encodings follow randomized Gaussian distribution and every eighth readout is a navigator line without phase encoding.Reconstruction workflow: Data are jointly reconstructed to produce co-registered images. The underlying multidimensional images of Part I and II are represented by two tensors $$$A_{IR}$$$ (dimensions: spatial, respiratory, inversion recovery and flip angle) and $$$A_{DCE}$$$ (dimensions: spatial, respiratory, and DCE time-course), respectively. By applying high-order singular value decomposition on the navigator readouts, the respective multi-dimensional temporal basis $$$\Phi_{IR}$$$ and $$$\Phi_{DCE}$$$ can be determined. Based on spatial-temporal correlation and tensor low-rankness, a shared spatial subspace is assumed between $$$A_{IR}$$$ and $$$A_{DCE}$$$ such that $$$A_{IR}=\Phi_{IR}\times_{1}U$$$ and $$$A_{DCE}=\Phi_{DCE}\times_{1}U$$$, where $$$U$$$ is the shared spatial factors. $$$U$$$ is recovered by solving the optimization problem:
$$\widehat{U}=argmin_{U} ||d_{IR}-\Omega_{IR}(\Phi_{IR}\times_{1}FSU)||_2^{2} +||d_{DCE}-\Omega_{DCE}(\Phi_{DCE}\times_{1}FSU)||_2^{2} + R(U)$$
where $$$d$$$s are the acquired imaging data, $$$\Omega$$$s are the undersampling operator, F is Fourier transform operator, S is the coil sensitivity operator, and R is spatial regularization operator in the form of total variation.
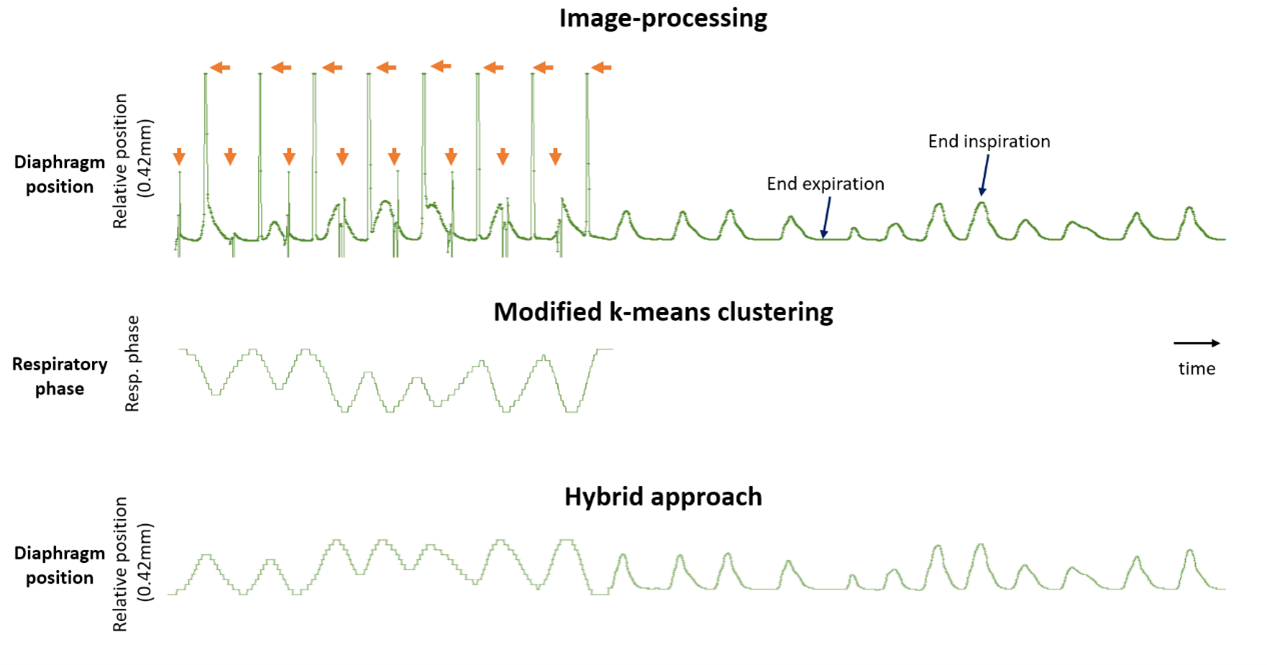
Resolving respiratory motion: Preliminary real-time images at certain inversion times in Part I exhibit minimal intensity due to magnetization zero-crossing thus prevent accurate diaphragm detection using image processing. Here a hybrid approach is proposed (Figure 2). Respiratory state is identified by the modified k-means clustering algorithm and then linearly correlated with diaphragm position using data points away from zero-crossing. Subsequently this correlation is propagated to produce diaphragm position throughout the scan, based on which respiratory binning is carried out.
Contrast concentration: Ignoring T2* decay, pixel-wise $$$T_{1}(t)$$$ is related to signal intens
ity $$$S(t)$$$ by:
$$S(t)=\sin(\alpha\cdot\beta)\cdot M_{0} \cdot \frac{1-e^{-TR/T_{1}(t)}}{1-\cos(\alpha\cdot\beta)\cdot e^{-TR/T_{1}(t)}}$$
where TR is repetition time, $$$\alpha$$$ is the nominal flip angle, and $$$\beta$$$ is the B1 field.
Given knowledge of $$$T_{0}(t)$$$, contrast agent concentration $$$C(t)$$$ can be calculated by:
$$C(t)=(\frac{1}{T_{1}(t)}-\frac{1}{T_{1}(0)})/\gamma$$
where $$$\gamma$$$ is relaxivity.
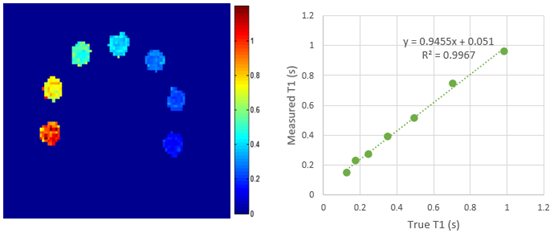
Study experiment: Data were acquired on a clinical 3T scanner (uMR 790, United Imaging Healthcare). Imaging parameters are summarized in Table 1. Three volunteers were recruited after IRB consent. Single dose Gd (Omniscan, GE Healthcare) bolus was intravenously injected with the flow rate of 2.0 ml/s. For kinetic modeling, images were imported to a United Imaging post-processing workstation. After manually placing ROIs in the abdomen aorta and portal vein, a dual-input single compartment liver model was used for pixel-wise kinetic parameter fitting. To study the benefit of the embedded B1 and T1 maps for liver DCE, kinetic modeling was performed twice, with and without B1 and T1 mapping. An ISMRM/NIST phantom [7] was also scanned to assess the accuracy of T1 quantification.
Results
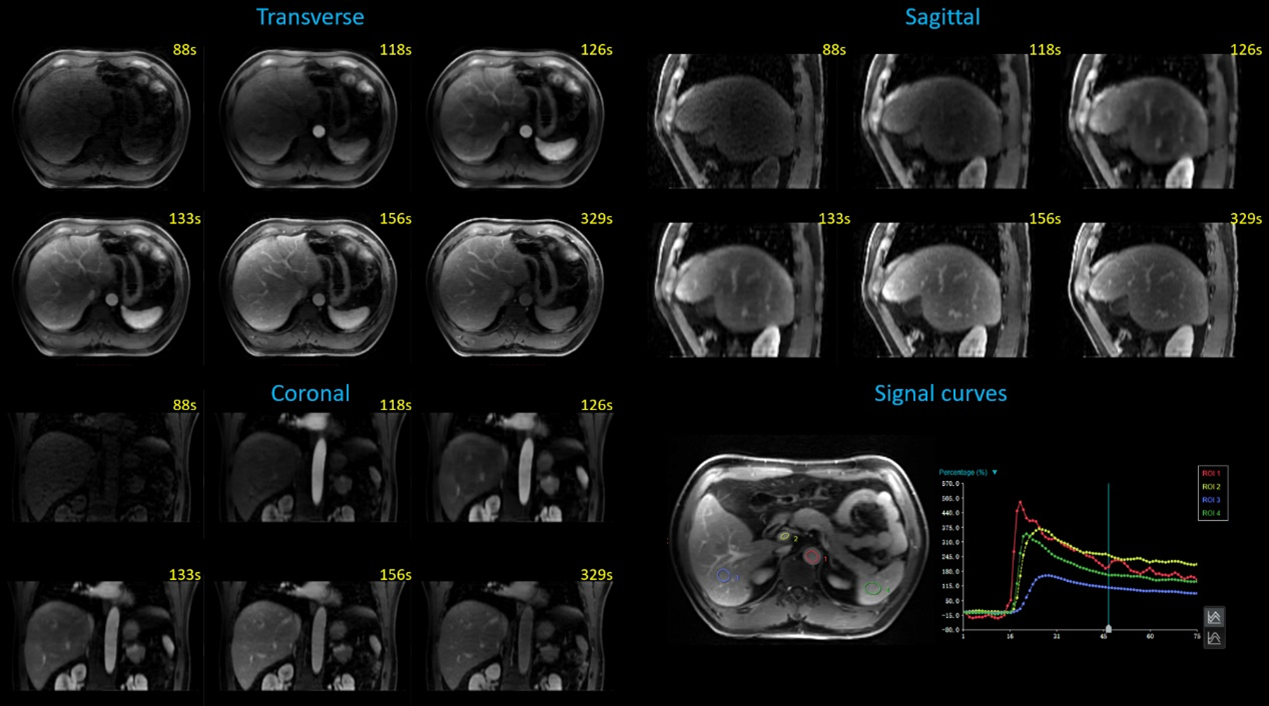
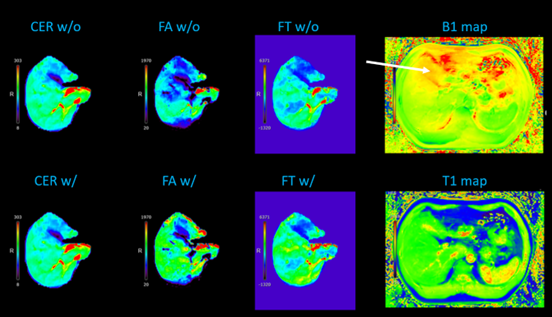
Typical DCE images and sample ROI signal curves are shown in Figure 3, demonstrating good image quality and reasonable enhancement patterns. Sample kinetic parameter maps with and without B1 and T1 correction are shown in Figure 4, highlighting the importance of correction. Figure 5 shows phantom T1 maps.Conclusion and discussion
An all-in-one, push-button abdomen DCE technique is proposed and evaluated on volunteers and phantoms. It has the potential to overcome some of the pain points in clinical abdomen DCE, namely, sacrifice of spatial resolution for temporal resolution, repeated breath-hold, risk of failing to capture contrast arrival, and the need for separate T1 mapping scan.Acknowledgements
This work was partially facilitated by a non-exclusive license agreement between Cedars-Sinai Medical Center and United Imaging HealthcareReferences
[1] Do RK, Rusinek H, Taouli B. Dynamic contrast-enhanced MR imaging of the liver: current status and future directions. Magn Reson Imaging Clin N Am. 2009;17(2):339-349.
[2] Weiss J, Ruff C, Grosse U, Grözinger G, Horger M, Nikolaou K, Gatidis S. Assessment of Hepatic Perfusion Using GRASP MRI: Bringing Liver MRI on a New Level. Invest Radiol. 2019 Dec;54(12):737-743.
[3] Yoon JH, Lee JM, Yu MH, et al. Simultaneous evaluation of perfusion and morphology using GRASP MRI in hepatic fibrosis. Eur Radiol 32, 34–45 (2022).
[4] Christodoulou AG, Shaw JL, Nguyen C, Yang Q, Xie Y, Wang N, Li D. Magnetic resonance multitasking for motion-resolved quantitative cardiovascular imaging. Nat Biomed Eng. 2018;2(4):215.
[5] Wang N, Gaddam S, Wang L, et al. Six-dimensional quantitative DCE MR Multitasking of the entire abdomen: Method and application to pancreatic ductal adenocarcinoma. Magn Reson Med. 2020; 84: 928– 948.
[6] Mao X, Lee H, Kwan AC, et al. 3D Joint Reconstruction of Non-Contrast and Contrast-Enhanced CMR Multitasking. In: Proceedings of the 31st annual meeting of ISMRM; 2022. Abstract 0274.
[7] Kathryn EK, Karl FS, Michael AB, et al. Multi-site, multi-vendor comparison of T1 measurement using ISMRM/NIST system phantom, ISMRM 2016: 3290
Figures