4159
Application of Pancreatic ECV Fraction measured by T1-mapping MRI in predicting Impaired Glucose Tolerance in Chronic Liver Disease1Radiology Department, Guangdong Provincial Hospital of Traditional Chinese Medicine, Guangzhou, China
Synopsis
Keywords: Hepatobiliary, Liver, Chronic liver disease; Impaired Glucose Tolerance;T1-mapping Magnetic Resonance Imaging; Eextracellular Volume Fraction
Motivation: The mechanism of impaired glucose tolerance (IGT) in chronic liver disease (CLD) may be related to reduced insulin secretion caused by pancreatic fibrosis.
Goal(s): This study aims to evaluating the value of T1-mapping MRI in quantifying pancreatic ECV fraction for predicting IGT in CLD.
Approach: A total of 184 CLD patients were recruited in this study. Univariate and multivariate logistic regression analysis was conducted to identify independent predictors of IGT in CLD.
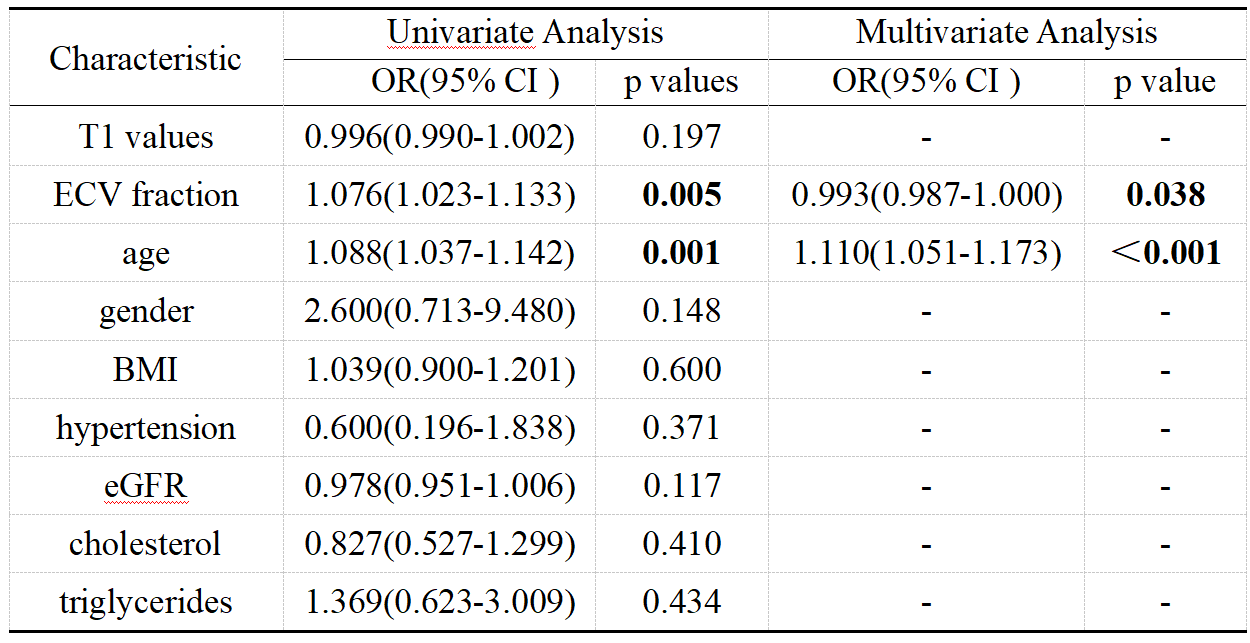
Results: After adjusting for age, gender, body mass index(BMI), hypertension,estimated glomerular filtration rate(eGFR), cholesterol and triglycerides, pancreatic ECV fraction was identified as an independent predictor for IGT in CLD.
Impact: The results suggest that pancreatic ECV fraction, quantified by T1-mapping MRI, may help elucidate the pathophysiological mechanisms of IGT in CLD.
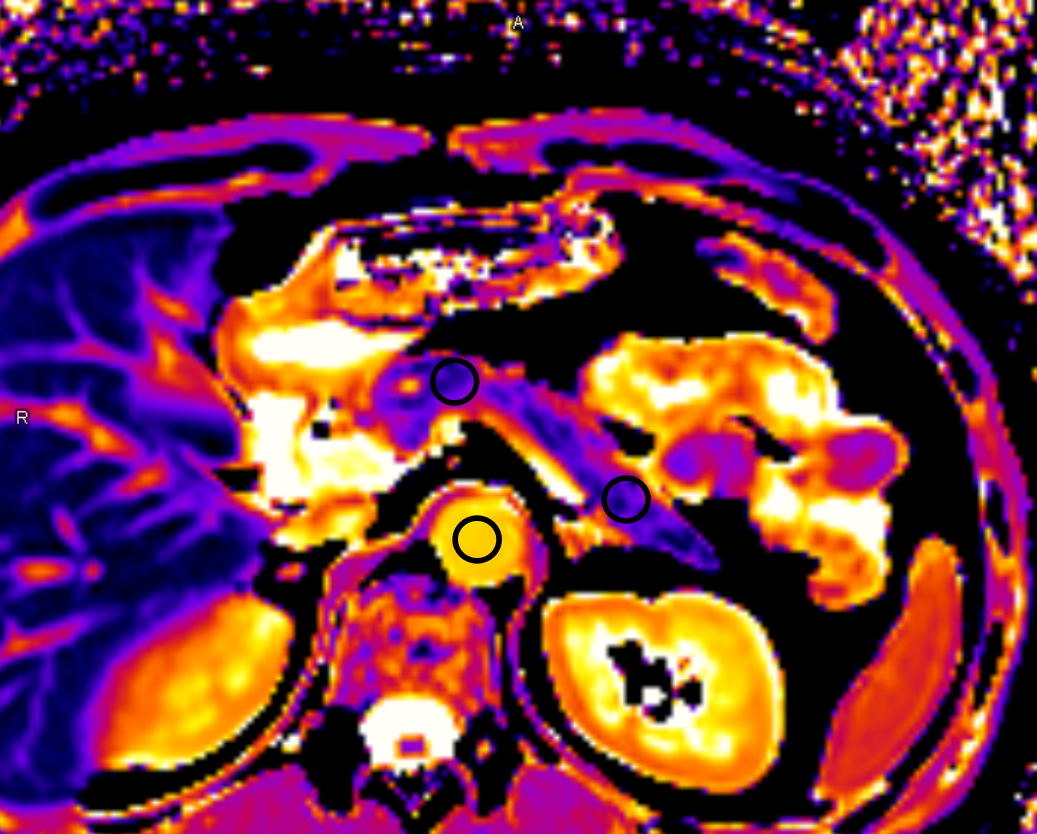
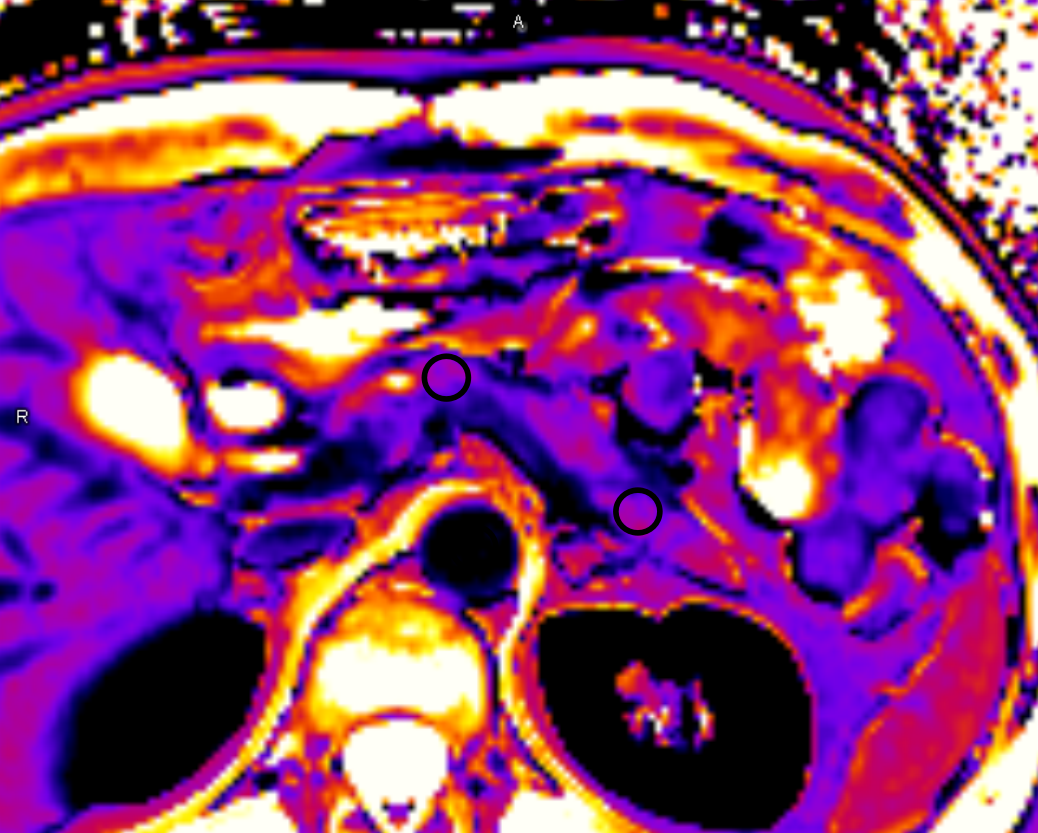
Methods: A total of 184 CLD patients(median:46 years old; interquartile range:37-54 years old; 118 men) were recruited in this study, including 90 patients with non-advanced CLD(non-ACLD), 63 patients with compensated ACLD(cACLD) and 31 patients with decompensated ACLD(dACLD). All patients were underwent T1 mapping on a 3.0T MR scanner(MAGNETOM Prisma, Siemens Healthineers) with a 18-channel body coil. MOLLI T1 mapping sequence were obtained twice, once before and once 10 min after administration of gadovist(BayerAG, Germany). To measure the T1 values of the pancreas before and after contrast administration(Figure 1), and calculate the ECV fraction of the pancreas.Clinical data and serum markers were collected. T1 values and ECV fraction of the pancreas between non-ACLD group, cACLD group and dACLD group were compared by Kruskal-Wallis test, Mann-Whitney U test and Bonferroni correction. IGT was defined as glycated hemoglobin (HbA1c) ≥ 6.0. Univariate and multivariate logistic regression analysis was conducted to identify independent predictors of IGT in CLD.
Results: Pancreatic T1 values in the dACLD group(946ms; 868-987ms) was significantly higher than that in the cACLD group(874ms; 854-901ms) and non-ACLD group(837ms; 790-876ms)(p<0.05). Pancreatic ECV fraction in the dACLD group(40.14%; 33.33-47.46%) was significantly higher than that in the cACLD group(29.59%; 25.46-33.9%) and non-ACLD group(24.80%; 22.77-28.07) (p<0.05),ECV fraction in the cACLD group was significantly higher that in the non-ACLD group(p<0.05). 16 out of 184 CLD patients(8.7%) had IGT. After adjusting for age, gender, body mass index(BMI), hypertension,estimated glomerular filtration rate(eGFR), cholesterol and triglycerides, pancreatic ECV fraction was identified as an independent predictor for IGT in CLD patients(OR=0.993, P=0.038)(Table 1).
Conclusion: The results suggest that pancreatic ECV fraction, quantified by T1-mapping MRI, may help elucidate the pathophysiological mechanisms of IGT in patients with CLD.
Acknowledgements
We sincerely thank to all the participants in this study.References
1. Ogawa Y, Nakahara T, Ono M, et al. Underestimation of impaired glucose tolerance and usefulness of a continuous glucose monitoring system in chronic liver disease[J]. J Gastroenterol Hepatol.2022; 37(3):592-599.
2. Konishi F, Miyake T, Watanabe T, et al. Association of abnormal glucose tolerance with liver-related disease and cardiovascular diseases in patients with chronic hepatitis C[J]. Hepatol Res. 2023; 53(9):806-814.3.
3. Kameda F, Tanabe M, Higashi M, et al. The extracellular volume fraction of the pancreas measured by dual-energy computed tomography: The association with impaired glucose tolerance[J]. Eur J Radiol. 2021;1 41:109775.4.
4. Catucci D, Obmann VC, Berzigotti A, et al. Noninvasive assessment of clinically significant portal hypertension using ΔT1 of the liver and spleen and ECV of the spleen on routine Gd-EOB-DTPA liver MRI[J]. Eur J Radiol.2021; 144:109958.5.
5. Mavrogeni S, Pepe A, Gargani L, et al. Cardiac inflammation and fibrosis patterns in systemic sclerosis, evaluated by magnetic resonance imaging: An update[J].Semin Arthritis Rheum. 2023; 58:152126.
Figures