4145
A study based on MRI features to assess vessels that encapsulate tumor clusters and microvascular invasion in hepatocellular carcinoma1Nantong Third People's Hospital, Nantong, China, 2Philips Healthcare, Shanghai, China
Synopsis
Keywords: Liver, Liver, HCC, VETC, MVI
Motivation: Vessels encapsulating tumor clusters (VETC) and microvascular invasion (MVI) are distinct vascular patterns of metastasis in hepatocellular carcinoma (HCC). Studies have indicated that patients with VETC+/MVI+ HCC have the worst long-term outcomes.
Goal(s): To establish a model based on MRI features of Liver Imaging Reporting and Data System (LI-RADS) v2018 for predicting VM (+) (VETC+/MVI+) HCC and assess its prognostic value.
Approach: Retrospective study.
Results: Size, arterial peritumoral enhancement, and peritumoral hypointensity on hepatobilary phase (HBP) are independent predictors of VM (+) HCC. The high-risk and low-risk groups predicted by the combined model show significant differences in recurrence-free survival (RFS) and early recurrence.
Impact: Preoperative non-invasive identification of VETC+/MVI+ HCC assists clinical physicians in formulating individualized treatment plans, thereby improving patient survival rates.
Introduction
HCC is the third leading cause of cancer-related deaths[1]. Currently, liver resection remains the primary treatment for liver cancer, but its postoperative recurrence rate is relatively high[2]. HCC is a highly vascularized cancer[3], and tumor angiogenesis plays a crucial role in tumor tissue growth, invasion, and metastasis[4]. MVI and VETC are two distinct patterns of metastatic vascular involvement within HCC tissue, formed based on different microvascular structures and molecular mechanisms. They are closely associated with postoperative recurrence and treatment outcomes[5,6]. Presently, several studies suggest that certain MRI features can be utilized for preoperative prediction of HCC's VETC or MVI status[7,8]. However, research on concurrently assessing HCC's VETC and MVI status using MRI features of LI-RADS v2018 is relatively limited. Therefore, our study aims to develop a model based on MRI features of LI-RADS v2018 to predict VETC +/ MVI+ HCC preoperatively and further explore their associations with the prognosis in HCC patients.Methods
We retrospectively included 232 patients with pathologically confirmed HCC and divided them into two groups based on their VETC and MVI statuses: VM (+) HCC (VETC+/MVI+) and non-VM (+) HCC (VETC+/MVI-, VETC-/MVI+, VETC-/MVI-). Clinical and imaging features associated with VM (+) HCC were determined through logistic regression analysis. We selected the cut-off value at the maximum Youden-index to distinguish between high-risk and low-risk groups. Kaplan-Meier survival curves were used to assess the differences in RFS and early recurrence between these groups.Results
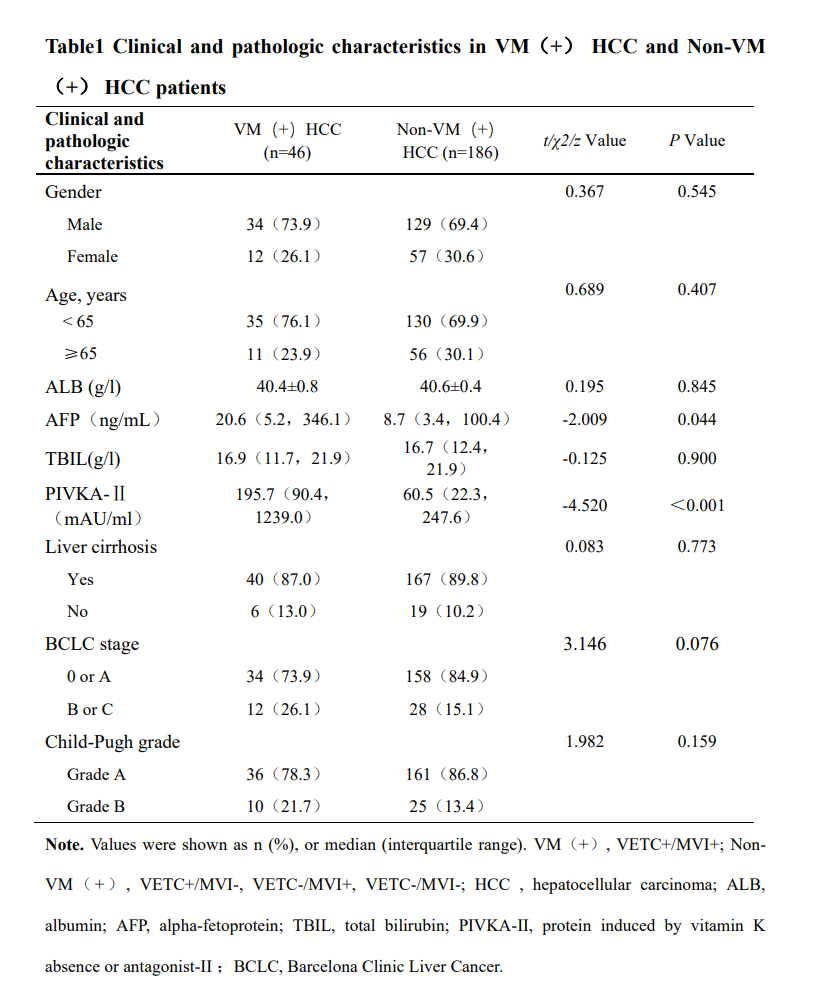
- 46 cases of VM (+) HCC and 186 cases of non-VM (+) HCC were included. Compared to non-VM (+) HCC, patients with VM (+) HCC may have higher levels of AFP and PIVKA-II (P<0.05), with no statistically significant differences in other clinical and pathological characteristics between them.
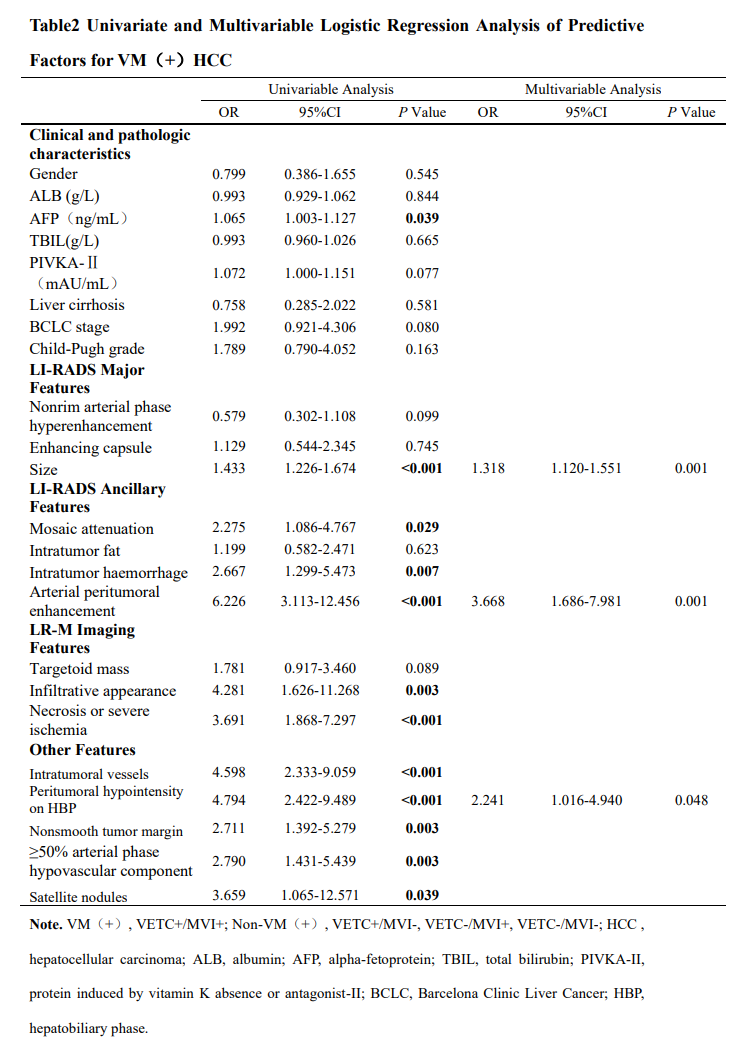
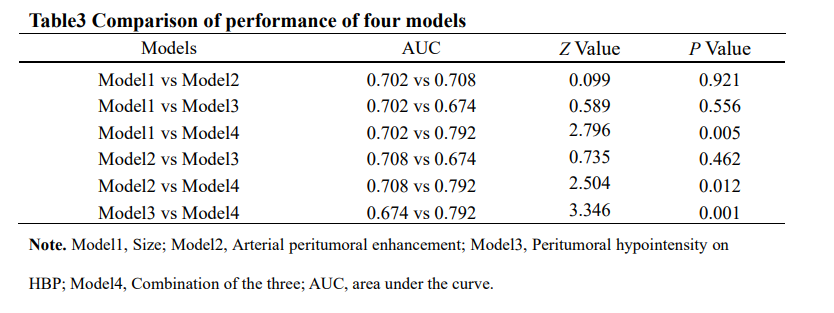
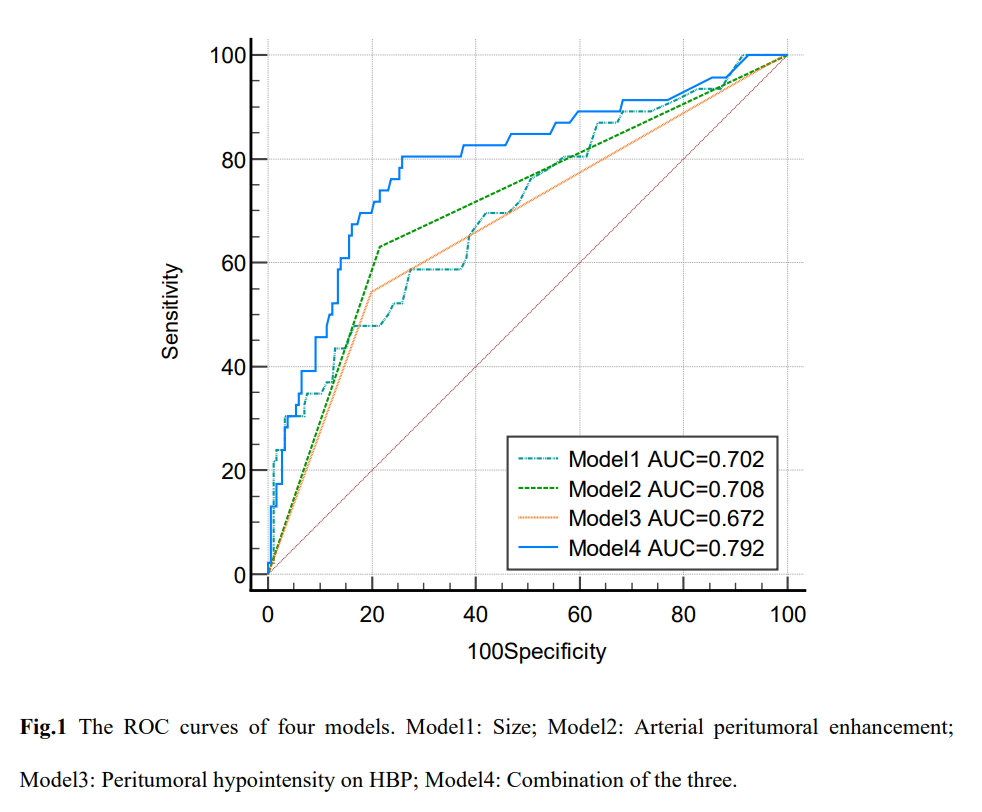
- Multivariable logistic regression analysis revealed that size (odds ratio [OR]=1.318, P=0.001), arterial peritumoral enhancement (odds ratio [OR]=3.668, P=0.001) and peritumoral hypointensity on HBP (odds ratio [OR]=2.241, P=0.043) are independent predictive factors for VM (+) HCC. The combined model of these three factors exhibited an AUC of 0.792 (95%CI 0.735-0.843, P<0.05) , a sensitivity of 80.4%, and a specificity of 74.2%. The Delong test demonstrated statistically significant differences in diagnostic efficacy when comparing the combined model with size, arterial peritumoral enhancement and peritumoral hypointensity on HBP (P< 0.05).
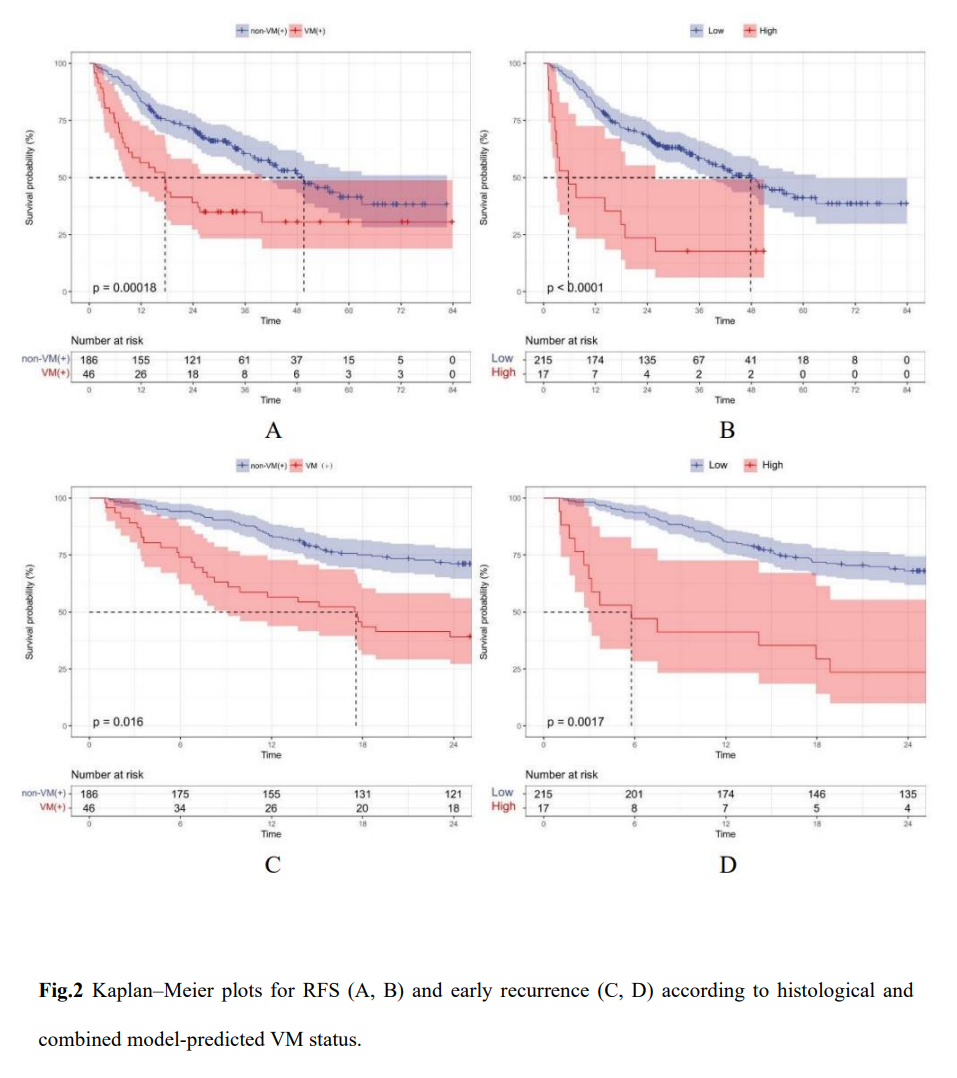
- In Kaplan-Meier survival analysis, there were significant differences in RFS and early recurrence between the high-risk and the low-risk groups predicted by the combined model, as well as between pathologically confirmed VM(+) HCC and non-VM(+) HCC patients (P<0.05).
Discussion
Tumor metastasis is a major factor contributing to the reduced survival rates in HCC patients. VETC and MVI represent two distinct microvascular invasion patterns in HCC. Their coexistence is associated with worse prognosis. Therefore, we categorized HCC into VM(+) HCC (VETC+/MVI+ HCC) and non-VM(+) HCC (VETC+/MVI-, VETC-/MVI+, VETC-/MVI- HCC), which is different from previous research. Our study identified size, arterial peritumoral enhancement and peritumoral hypointensity on HBP as independent predictors of VM(+) HCC. The assessment of peritumoral tissue is more valuable for predicting MVI. Previous research has shown that arterial peritumoral enhancement and peritumoral hypointensity on HBP are specific imaging markers for predicting MVI. Arterial peritumoral enhancement suggests compensatory increase in HCC arterial perfusion, and peritumoral hypointensity on HBP reflects changes in the expression of OATP or MRP2 receptors in the liver parenchyma due to hemodynamic alterations associated with obstruction of the small portal veins. Additionally, peritumoral hypointensity on HBP often appears in higher-grade tumors, indicating that it may reflect the malignant biological behavior of HCC. Larger liver cancers tend to exhibit more aggressive characteristics, possibly due to their irregular borders, rich blood supply, and frequent invasion of adjacent vessels, which may lead to the development of VETC. Some researchers have pointed out that although MVI and VETC have different molecular mechanisms, they both affect the tumor's blood perfusion. Therefore, there are some similarities in the relevant underlying imaging features and causes. Furthermore, our Kaplan-Meier survival analysis revealed that VM(+) HCC patients had lower RFS and higher early recurrence rates compared to non-VM(+) HCC patients, which is consistent with previous research findings.Conclusion
The model based on MRI features of LI-RADS v2018 assists in the preoperative prediction of VM(+)HCC. The simultaneous presence of VETC and MVI is associated with an increased risk of early recurrence and decreased RFS in HCC patients after surgical resection.Acknowledgements
No acknowledgement found.References
- Sung H, Ferlay J, Siegel RL, et al. Global Cancer Statistics 2020: GLOBOCAN Estimates of Incidence and Mortality Worldwide for 36 Cancers in 185 Countries. CA Cancer J Clin. 2021;71(3):209-249.
- Xu XF, Xing H, Han J, et al. Risk Factors, Patterns, and Outcomes of Late Recurrence After Liver Resection for Hepatocellular Carcinoma: A Multicenter Study From China. JAMA Surg. 2019;154(3):209-217.
- Zhu AX, Duda DG, Sahani DV, Jain RK. HCC and angiogenesis: possible targets and future directions [published correction appears in Nat Rev Clin Oncol. 2011 May;8(5):302]. Nat Rev Clin Oncol. 2011;8(5):292-301.
- Jiang X, Wang J, Deng X, et al. The role of microenvironment in tumor angiogenesis. J Exp Clin Cancer Res. 2020;39(1):204.
- Fang JH, Zhou HC, Zhang C, et al. A novel vascular pattern promotes metastasis of hepatocellular carcinoma in an epithelial-mesenchymal transition-independent manner. Hepatology. 2015;62(2):452-465.
- Lu L, Wei W, Huang C, et al. A new horizon in risk stratification of hepatocellular carcinoma by integrating vessels that encapsulate tumor clusters and microvascular invasion. Hepatol Int. 2021;15(3):651-662.
- Chen J, Ming X, Wang Z, Ye Y. Analysis of the Performance of Gadoxetic Acid Disodium MRI in Predicting Microvascular Invasion of Hepatocellular Carcinoma. Contrast Media Mol Imaging. 2022;2022:6128845.
- Fan Y, Yu Y, Hu M, et al. Imaging features based on Gd-EOB-DTPA-enhanced MRI for predicting vessels encapsulating tumor clusters (VETC) in patients with hepatocellular carcinoma. Br J Radiol. 2021;94(1119):20200950.
Figures