4139
Assessing Hepatic Metabolism in Patients with HCC Using 31P-MRS: Insights and Potential Clinical Utility1Faculty of Medical Imaging Technology, College of Health Science and Technology, Shanghai Jiao Tong University School of Medicine, Shanghai, China, 2Department of Radiology, Ruijin Hospital, Shanghai Jiao Tong University School of Medicine, Shanghai 200025, China;, Shanghai, China, 3Department of General Surgery, Ruijin Hospital,Shanghai Jiao Tong University School Of Medicine, Shanghai, China, 4Philips Healthcare, Shanghai, China, Shanghai, China
Synopsis
Keywords: Liver, Liver, Phosphorus Magnetic Resonance Spectroscopy
Motivation: The clinical need for noninvasive tools to assess the metabolism of hepatocellular carcinoma (HCC), which contributes to treatment guidance, therapy response assessment and prognostic prediction. This study aimed to investigate the value of phosphorus (31P)-magnetic resonance spectroscopy (MRS) as a supplementary metabolism-related alternative in clinic.
Goal(s): The goal of this study was to evaluate the metabolism status of HCC, compared with healthy controls.
Approach: Three HCC patients and three healthy volunteers were analyzed with a 3.0-T MRI scanner, using 31P MRS.
Results: The study revealed an elevated phomonoester (PME) / phosphodiester (PDE) ratio in patients with HCC, suggesting potential metabolic changes in HCC.
Impact: This study highlights the promising value of 31P MRS as a noninvasive alternative in patients with HCC. Elevated PME/PDE ratio offers valuable insights into hepatocellular carcinoma, enhancing the diagnostic and treatment strategies of HCC.
INTRODUCTION
Phosphorus (31P)-magnetic resonance spectroscopy (MRS) is a noninvasive tool that quantifies the alterations in phosphorus-containing metabolites1. Previous studies have reported abnormal phosphorus metabolite alterations in patients with cirrhosis2. This study aimed to evaluate the underlying metabolism changes of HCC, with 31P-MRS.METHODS
The institutional review board approved this study. Three patients diagnosed with HCC and three healthy volunteers were recruited. Informed consent was obtained from healthy volunteers and patients.MRI Data Acquisition MR examinations were performed with a clinical 3.0-T imager (Elition; Philips Healthcare, Best, the Netherlands).We used a1H anterior coil in combination with a body coil to collect T2-weighted ultrafast gradient-echo images (TR/TE = 8/2.3 ms; flip angle= 15°; FOV = 450*450*60mm3), which provided the underlying image information and the position reference of phosphorus spectra .To obtain the 31P MR spectroscopy, an oblong, flexible 31P transmit-receive loop coil with a diameter of 14 cm was placed laterally over the liver, parallel to the main magnetic field. The coil placement was checked with the T2 rapid positioning imaging and repositioned before the scan of phosphorus to make sure the coil is close to the liver. 31P MRS were acquired using the 2D CSI sequence, with the following parameters: FOV=195*195mm2; TR=4000ms; TE=0.2ms; Samples=2048; Spectral bandwidth =3000Hz.Broadband decoupling with a wide band alternating-phase low-power technique for zero-residual splitting four (or WALTZ-4) phase cycling was used. The duration of 31P MR spectroscopy data collection was 4 minutes.
MR Spectroscopy Data Processing All spectra were analyzed with a vendor-supplied software package (SpectroView).Intensities of phosphoethanolamine(PE), phosphocholine(PC), inorganicphosphate(Pi), glycerophosphorylethanolamine(GPE), glycerophosphorylcholine(GPC), phosphoenolpyruvate(PCr), γ-ATP, α-ATP, and β-ATP were determined with the timedomain advanced method for spectral fitting algorithm. Prior to quantitation, spectra were corrected for zero- and first order phases, as described for 3T 31P MR spectroscopy3.The spectrum integral ratios, PME/PDE, PME/Pi, PME/g-ATP were used to evaluate phosphorus metabolism in liver1
RESULTS
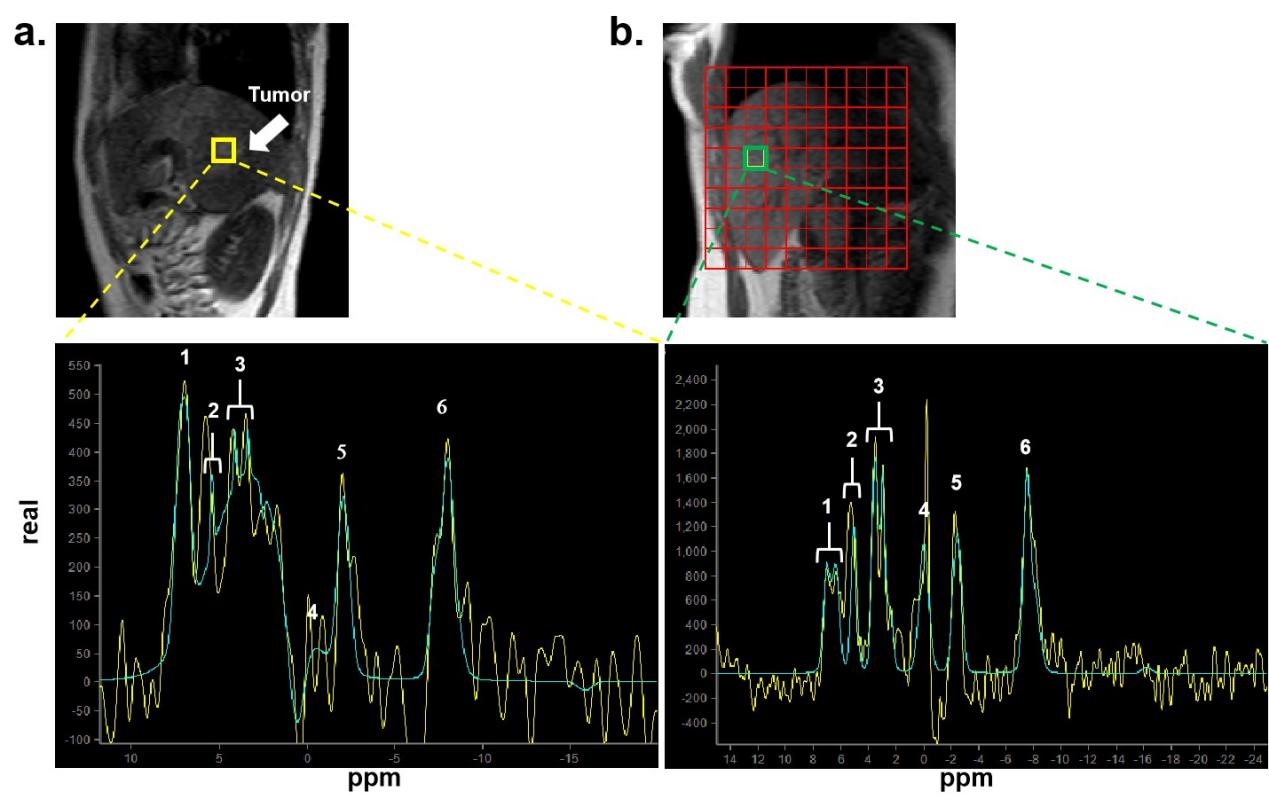
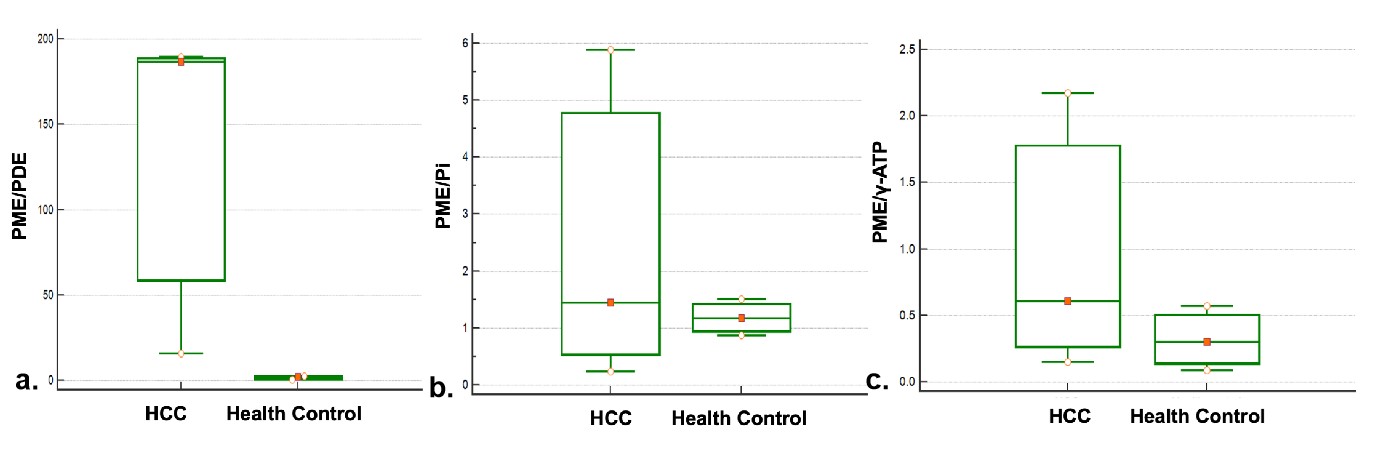
All meaningful peaks corresponding to phosphorus compounds were depicted in the fitted curve. Figure 1 displays the 31P-MRS scans from healthy volunteers and patients with HCC. HCC showed increased PME/PDE compared with healthy controls(15.95~189.48 vs 0.43~1.89 ).However, HCC showed a varied range of PME/γ-ATP (0.60~2.17)and PME/Pi(0.23~5.89), compared with healthy control.(0,09~0.3 and 0.87~1.50)DISCUSSION
This study was performed on patients with HCC using 3.0T 31P-MRS. We observed alterations in the ratios of phosphorus-containing metabolites PME and PDE, which aligned with the findings of a previous study on HCC1. Prior findings indicated that PME signified the precursors for phospholipid cell membranes, whereas PDE represented the products of cell membrane degradation4. The elevated PME/PDE ratio might suggest a higher level of anabolism than catabolism. The ATP levels were predominantly assessed using the γ-ATP signal, whereas Pi reflected the energy state4. In the current study, a varied range of PME/γ-ATP and PME/Pi might due to the tumor heterogeneity.Our study had several limitations. First, the sample size was small, which included only three patients with HCC and three healthy volunteers. This small sample size had obscured other potential metabolism changes. Second, the 31P-MRS scans necessitated sketching volumes of interest and fitting spectra individually, which introduced subjective bias, despite using a standardized phosphorus scanner. Additionally, absolute quantification of MRS was not incorporated, as discussed in a previous study5.CONCLUSIONS
The 3.0T 31P-MRS unveiled an elevated PME/PDE ratio in patients diagnosed with HCC, which might signify metabolic changes within the liver tumor lesions. Further investigations involving a larger cohort of patients with HCC are needed to validate the potential clinical utility of 3.0T 31P-MRS.Acknowledgements
No acknowledgement found.References
[1] Seelen LWF, van den Wildenberg L, van der Kemp WJM, et al. Prospective of 31 P MR Spectroscopy in Hepatopancreatobiliary Cancer: A Systematic Review of the Literature. J Magn Reson Imaging. 2023;57(4):1144-1155.
[2] Sevastianova K, Hakkarainen A, Kotronen A, et al. Nonalcoholic fatty liver disease: detection of elevated nicotinamide adenine dinucleotide phosphate with in vivo 3.0-T 31P MR spectroscopy with proton decoupling. Radiology. 2010;256(2):466-473.
[3] Hamilton G, Patel N, Forton DM, Hajnal JV, Taylor-Robinson SD. Prior knowledge for time domain quantification of in vivo brain or liver 31P MR spectra. NMR Biomed. 2003;16(3):168-176.
[4] Solga SF, Horska A, Clark JM, Diehl AM. Hepatic 31P magnetic resonance spectroscopy: a hepatologist's user guide. Liver Int. 2005;25(3):490-500.
[5]Norén B, Lundberg P, Ressner M, Wirell S, Almer S, Smedby O. Absolute quantification of human liver metabolite concentrations by localized in vivo 31P NMR spectroscopy in diffuse liver disease. Eur Radiol. 2005;15(1):148-157.
Figures