4132
Assessing Lactate Release in an Epilepsy Mouse Model using Metabolic Imaging of Hyperpolarized [1-13C]Pyruvate1Diagnostic Radiology and Nuclear Medicine, University of Maryland School of Medicine, Baltimore, MD, United States, 2Department of Neurosurgery, University of Maryland School of Medicine, Baltimore, MD, United States
Synopsis
Keywords: Epilepsy, Hyperpolarized MR (Non-Gas)
Motivation: Thirty percent of epilepsy patients have seizures despite best medical therapies. Therefore, a non-invasive method to localize seizure onset zone (SOZ) and epilepsy network (EN) in epilepsy surgery to improve surgical outcomes is essential.
Goal(s): The goal of this study was to apply dynamic magnetic resonance spectroscopic imaging (MRSI) of hyperpolarized [1‑13C]pyruvate (Pyr) to measure lactate (Lac) release in a Pentylenetetrazol (PTZ) mouse model of epilepsy.
Approach: We hypothesize that hpMRSI of [1-13C]Pyr accurately measures elevated Pyr-to-Lac conversion in a PTZ mouse model of epilepsy.
Results: Significant increase in Pyr-to-Lac conversion has been measured in PTZ kindled mice compared to control mice.
Impact: Epilepsy surgery outcomes depend on correctly identifying SOZ and EN. We utilized hpMRSI of [1-13C]Pyr to accurately identify elevated Lac release in PTZ mouse model of epilepsy. These results support its potential application to identify epileptic focus in epilepsy patients.
Introduction
Approximately 30% of epilepsy patients continue to experience seizures despite medical therapy and seek neurosurgical management to achieve seizure control. Outcomes in epilepsy surgery are largely dependent on correctly identifying, mapping, and subsequently treating the epileptogenic focus (EF) or seizure onset zone (SOZ). High glucose metabolism, lactate dehydrogenase A (LDHA), and lactate (Lac) production have been associated to epileptic tissue in patients, animals, and culture models1,2. These studies suggest elevated Lac may serve as a biomarker for improved localization of epileptic tissue.Hyperpolarization (HP) enhances the magnetic resonance (MR) signal of 13C-labeled compounds by a factor of up to five orders of magnitude, which allows for real-time detection of the injected substrate and its downstream metabolic products. Our recent work demonstrated the utility of magnetic resonance spectroscopy (MRS) with HP [1-13C] pyruvate (Pyr) to identify differential Lac release in an in vitro model of epilepsy3. As it has been shown that pentylenetetrazol (PTZ) kindling in mice causes elevated levels of LDHA protein4,5. The goal of this study was to apply dynamic magnetic resonance spectroscopic imaging (MRSI) of HP [1‑13C]Pyr to measure Lac release in a PTZ mouse model of epilepsy.
Materials and Methods
To model chronic epilepsy, kindling was induced in mice (n=9) by administration of sub-convulsive (35mg/kg, intraperitoneal) PTZ doses every other day for twenty days, whereas control (sham) animals (n=8) were given the PTZ vehicle PBS. HP imaging was performed 48 hours after the last dose of PBS or PTZ. After imaging, all mice were euthanized, and their brains were used to assess extracellular lactate concentrations by using a fluorometric lactate assay kit (Cell Biolabs, Inc. MET-5013).In vivo MRSI experiments were conducted using a pre-clinical 3 Tesla Bruker Biospec MR scanner (Bruker, Ettlingen, Germany). A custom-built surface coil (40-mm diameter) was utilized for 13C MR measurements for both radiofrequency (RF) excitation and signal reception. A fast dynamic spiral chemical shift imaging (spCSI)6 scan with a multiband spectral-special RF pulse7 was performed. Animals were injected with 114 mM of HP Pyr (10 uL/g body weight) through a tail vein catheter 4-5 sec after starting the spCSI scan. A multiband RF pulse permits different excitation flip angles for substrate and product resonances. We applied a 1° flip angle on Pyr and 4° on Lac, corresponding to effective flip angles per time point of 6° and 22°, respectively. The other parameters of the spCSI sequence were: FOV = 32x32x32 mm3, 8 phase encoding steps in slice direction for a nominal resolution of 2x2x4 mm3, 4 spatial interleaves, 56 spiral gradient echoes, spectral width = 531 Hz. A total of 20 data sets were acquired for an 80-second scan at 4 s temporal resolution. Metabolic maps were generated using MATLAB, and Lac-to-Pyr ratios were calculated by peak integral in regions of interest (ROIs) drawn in lateral cortex using T2-weighted proton images used for anatomical reference. Isoflurane anesthesia (1-2% in 1 L/min O2) was tightly controlled during all imaging sessions as it is a potent cerebral vasodilator. Following the hpMRSI acquisition, we acquired T1-weighted (T1w) proton images before and after intravenous (IV) injection of Gadavist (gadobutrol) to measure blood-brain-barrier (BBB) permeability8.
Results and Discussion
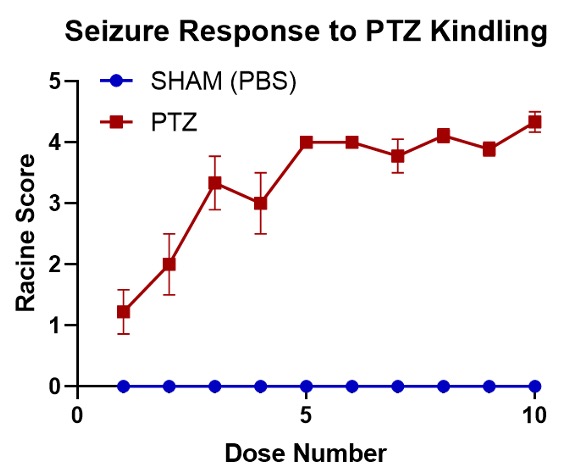
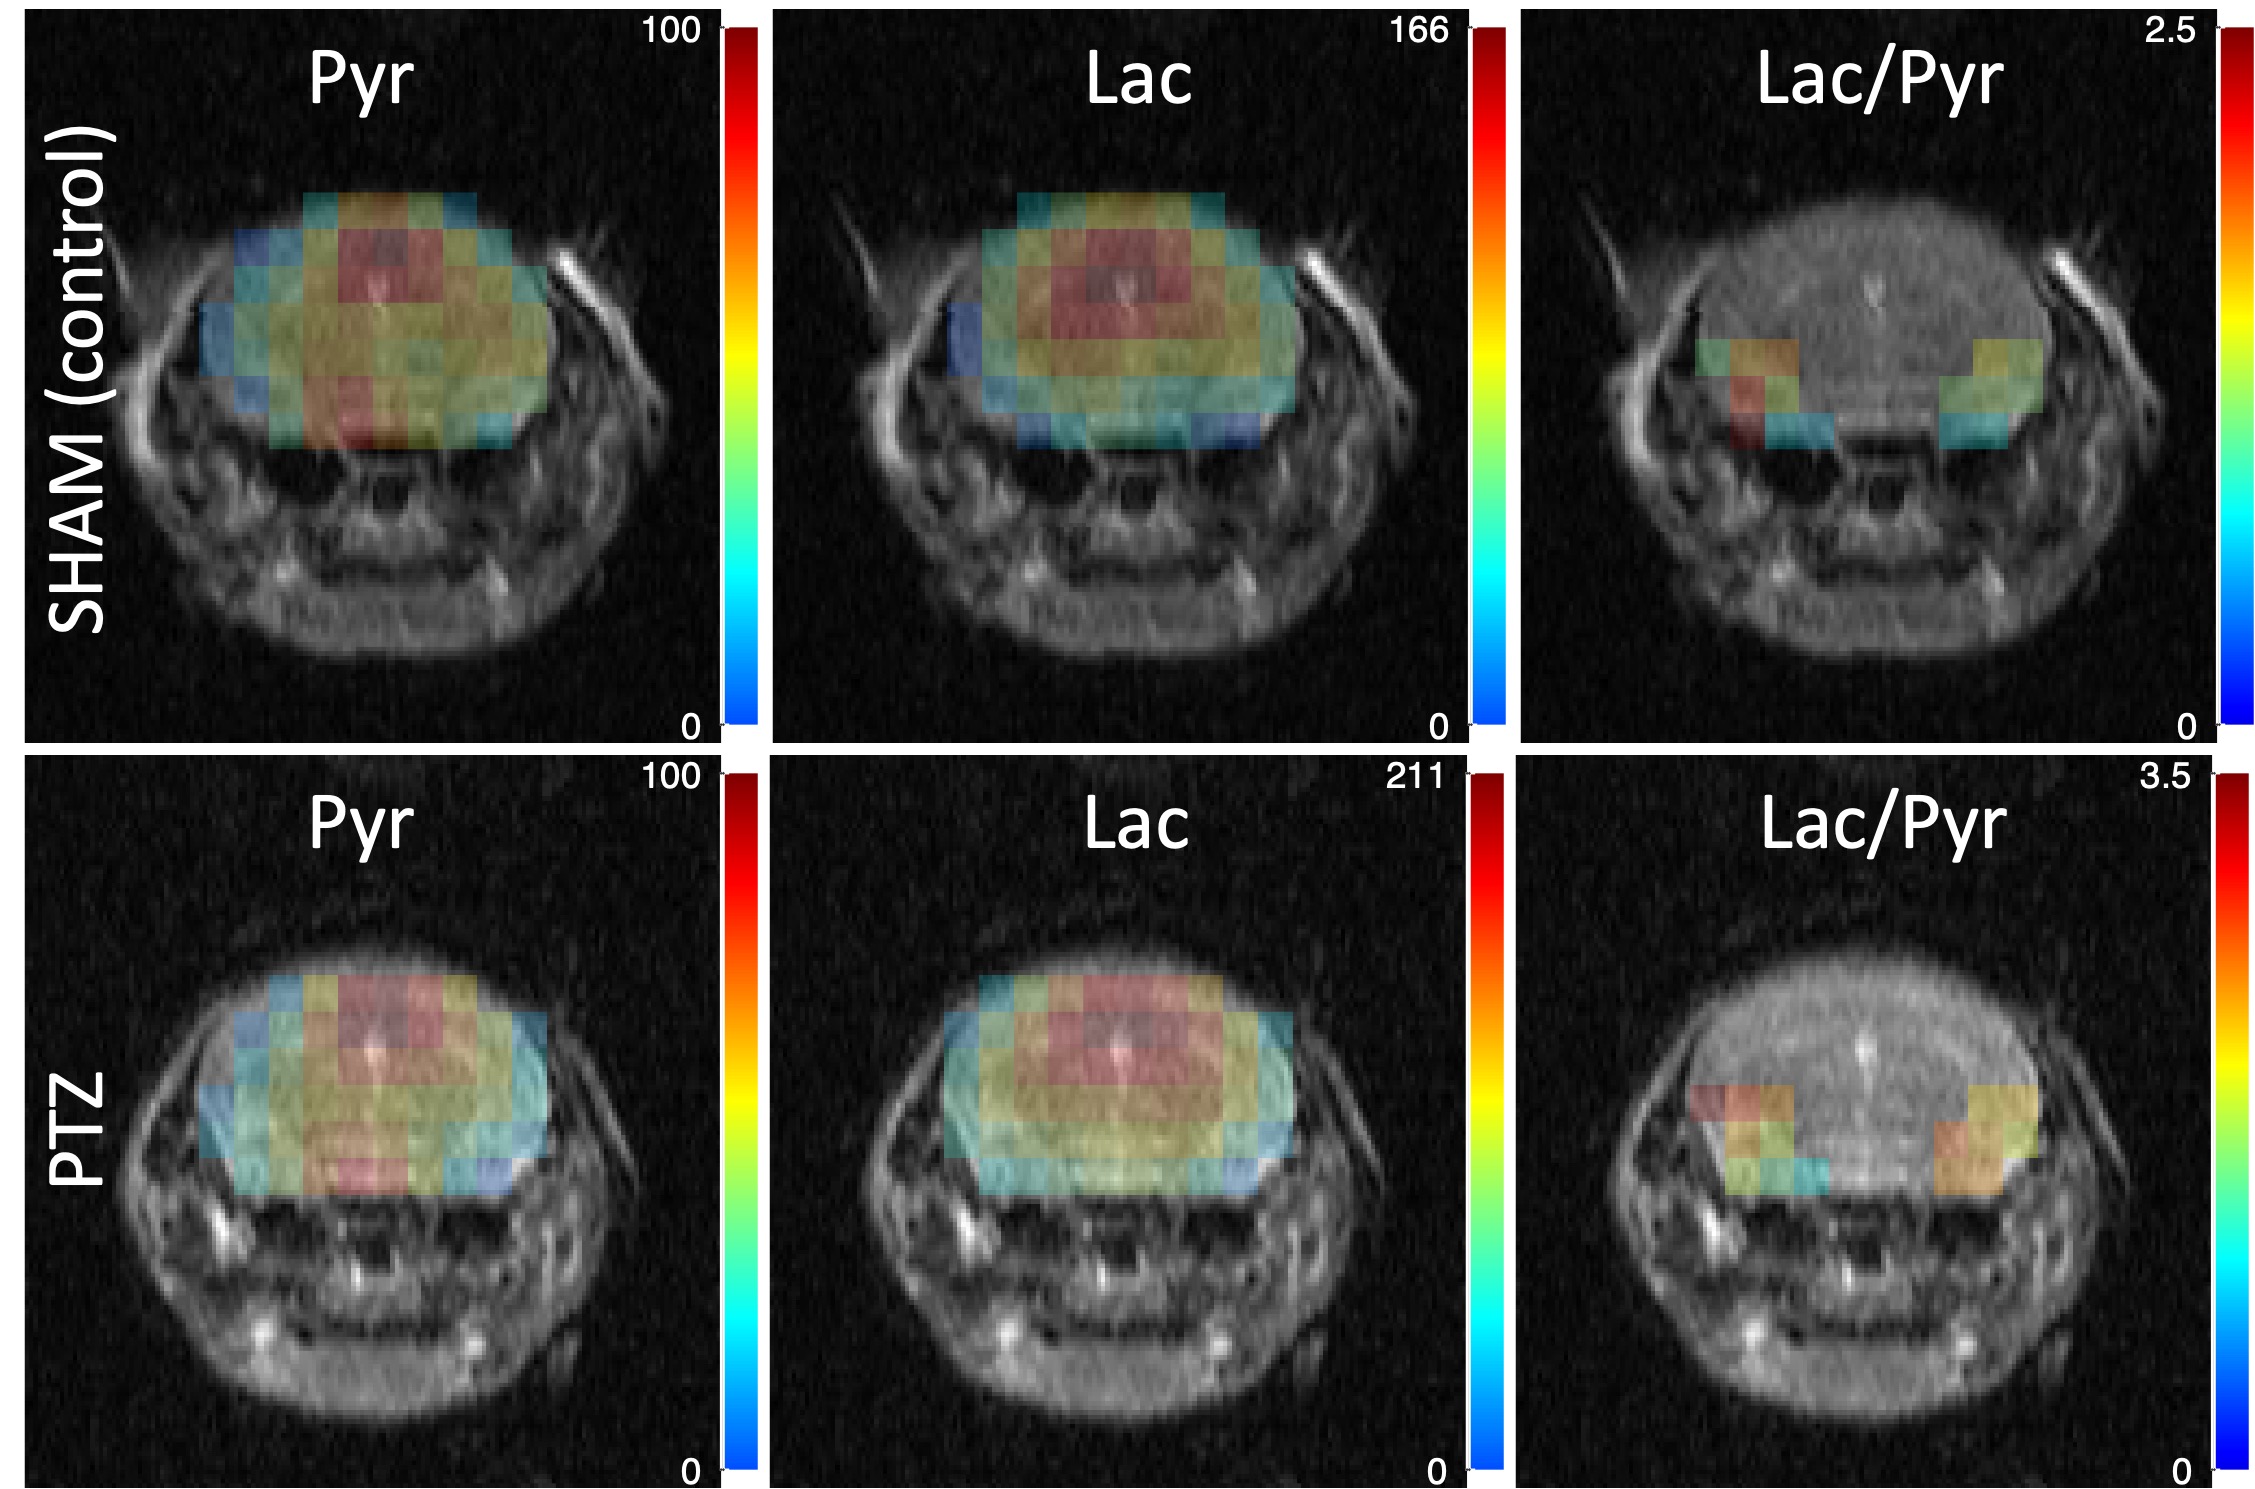
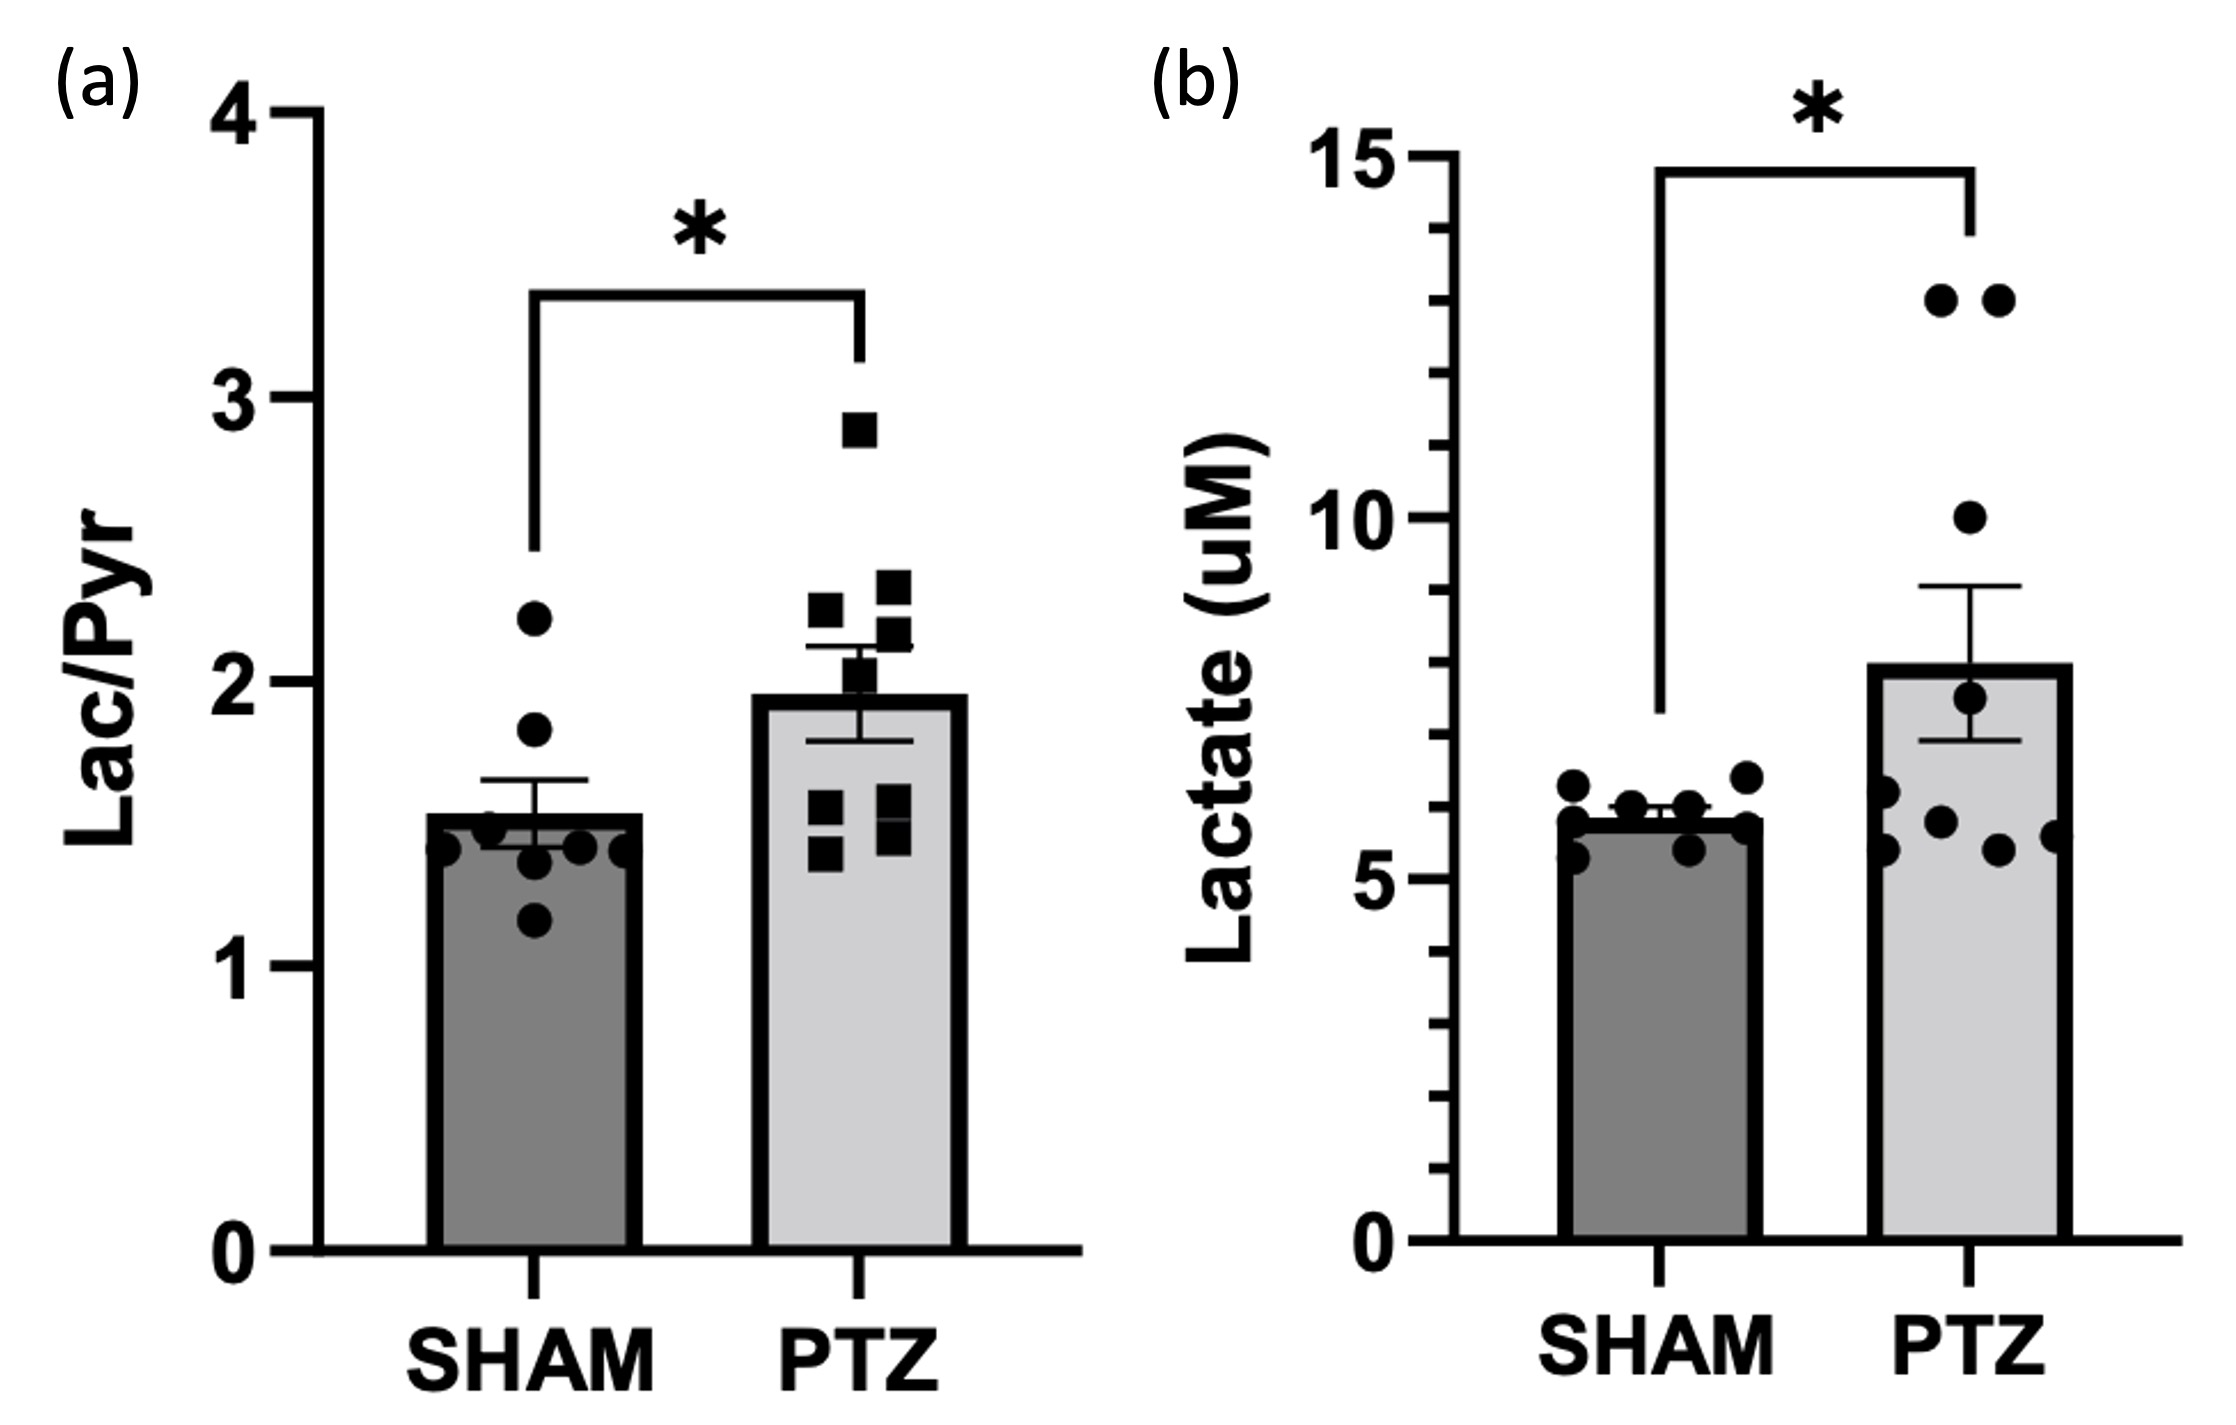
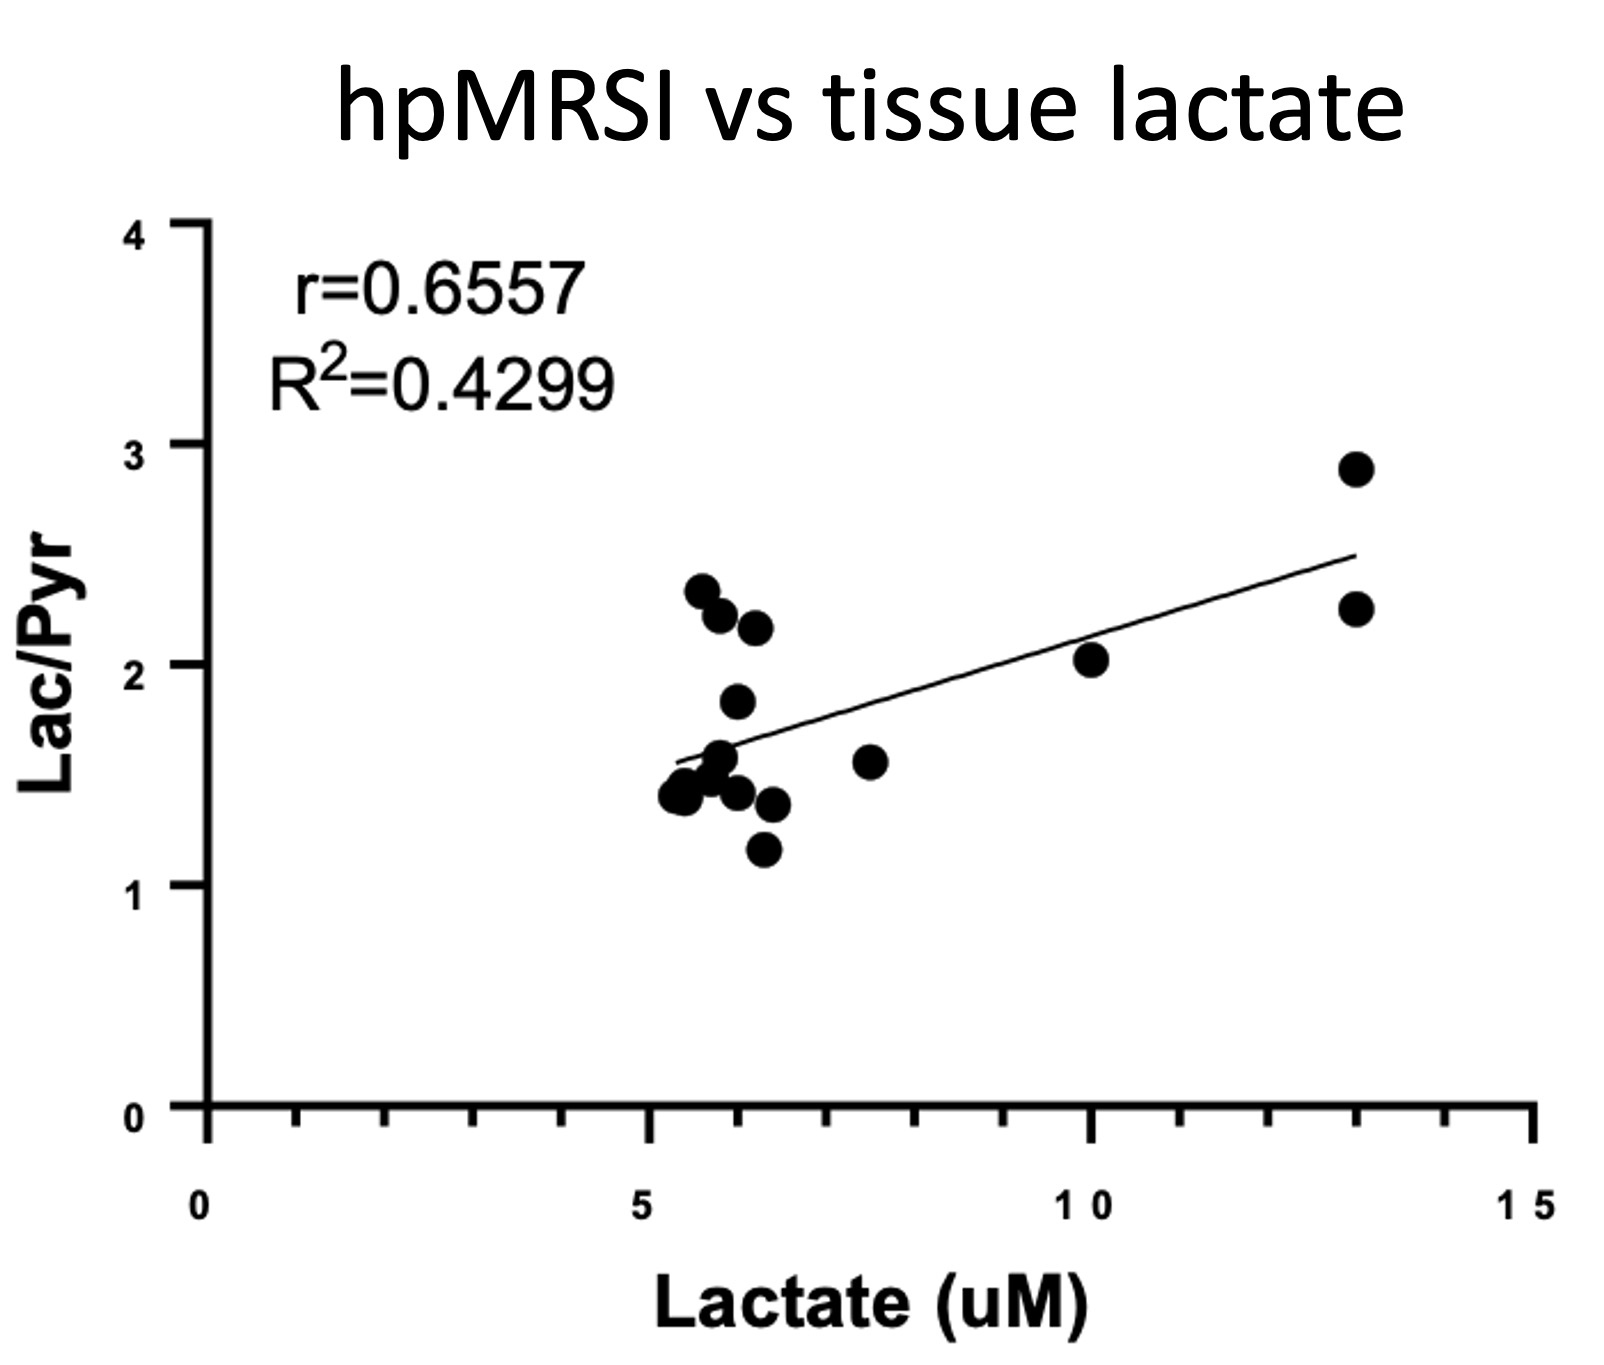
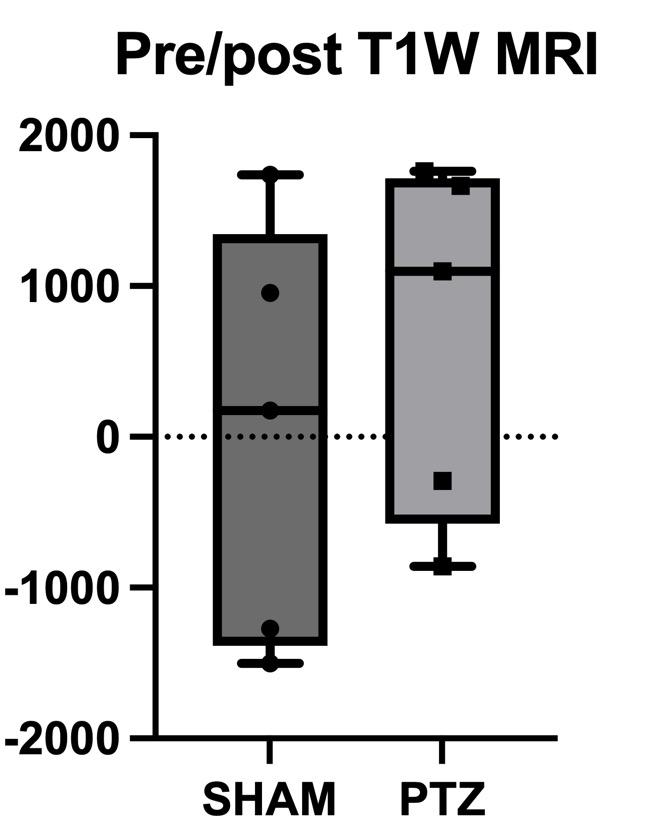
Mice receiving PTZ demonstrated gradually more severe seizure responses, whereas sham control mice showed no seizure as measured by Racine behavioral scores (Fig. 1). Metabolic maps of Pyr, Lac, and Lac-to-Pyr ratio from representative control and PTZ animals in Fig. 2 show elevated Pyr-to-Lac conversion in lateral cortex of PTZ mice. The summary statistics (mean ± standard deviation) from two groups of animals for both the HP Lac/Pyr and results from ex vivo Lac assays are shown in Fig. 3. PTZ administrated animals showed significant elevations in Pyr-to-Lac conversion compared to controls (1.96±0.5 vs 1.63±0.41, p=0.03). Similarly, significantly elevated extracellular Lac concentrations were detected using the lactate assay in the brains of PTZ kindled mice compared to sham controls (7.99±3.19 vs 5.86±0.39, p=0.041). There was a significant correlation between the lactate assay and Lac-to-Pyr ratio (Figure 4, R2=0.4299, p<0.001). It has been reported that PTZ kindling can cause BBB disruption9,10, which could be a confounding factor as transport across the BBB is a rate-limiting step in converting HP Pyr-to-Lac11,12. However, our analysis shows no significant difference between PTZ and sham control in pre/post-T1w MRI (n=5 in each group, p=0.45).Conclusions
This study demonstrates that MRSI of HP [1-13C]Pyr can identify elevated Pyr-to-Lac conversion in a PTZ mouse model of epilepsy with the MR metric correlating with ex vivo extracellular Lac. These results suggest the potential of hpMRSI as a clinical tool to identify the EF.Acknowledgements
This work was supported by NIH grants R21 EB029083 and R21 DK131357 as well as DOD grants CA200996 and PR210572.References
1. Dufour F, Koning E, Nehlig A. Basal levels of metabolic activity are elevated in Genetic Absence Epilepsy Rats from Strasbourg (GAERS): measurement of regional activity of cytochrome oxidase and lactate dehydrogenase by histochemistry. Experimental neurology. 2003;182(2):346-52.
2. Hill RA, Chiappa KH, Huang‐Hellinger F, Jenkins BG. Hemodynamic and metabolic aspects of photosensitive epilepsy revealed by functional magnetic resonance imaging and magnetic resonance spectroscopy. Epilepsia. 1999;40(7):912-20.
3. Aditya Jhajharia, Riccardo Serra, Muznabanu Bachani, Jemima Olu-Owotade, Minjie Zhu, Joshua Rogers, Alexander Ksendzovsky, and Dirk Mayer. MR Spectroscopy of HP [1-13C]Pyruvate in an In Vitro Model of Epilepsy. ISMRM 2022, Abstract #2327.
4. Ksendzovsky A, Bachani M, Altshuler M, Walbridge S, Mortazavi A, Moyer M, Chen C, Fayed I, Steiner J, Edwards N, Inati SK, Jahanipour J, Maric D, Heiss JD, Kapur J, Zaghloul KA. Chronic neuronal activation leads to elevated lactate dehydrogenase A through the AMP-activated protein kinase/hypoxia-inducible factor-1alpha hypoxia pathway. Brain Commun. 2023;5(1):fcac298.
5. Sada N, Suto S, Suzuki M, Usui S, Inoue T. Upregulation of lactate dehydrogenase A in a chronic model of temporal lobe epilepsy. Epilepsia. 2020;61(5):e37-e42.
6. Mayer D, Yen YF, Tropp J, Pfefferbaum A, Hurd RE, Spielman DM. Application of subsecond spiral chemical shift imaging to real-time multislice metabolic imaging of the rat in vivo after injection of hyperpolarized 13C1-pyruvate. Magn Reson Med. 2009;62(3):557-64.
7. Larson PE, Kerr AB, Chen AP, Lustig MS, Zierhut ML, Hu S, Cunningham CH, Pauly JM, Kurhanewicz J, Vigneron DB. Multiband excitation pulses for hyperpolarized 13C dynamic chemical-shift imaging. J Magn Reson. 2008;194(1):121-7. Epub 2008/07/16. doi: 10.1016/j.jmr.2008.06.010. PubMed PMID: 18619875; PMCID: PMC3739981.
8. Ichikawa H, Itoh K. Blood-arachnoid barrier disruption in experimental rat meningitis detected using gadolinium-enhancement ratio imaging. Brain Res. 2011;1390:142-9.
9. Yorulmaz H SF, Oztas B, Kaptan E, Ozdilli K. Effects of Acute Hyperglycemia on Blood Brain Barrier During Pentylenetetrazole-induced Epileptic Seizures. International J of Pharmacology. 2012;8(6):561–6.
10. Danjo S DJ, Ishikawa I, Kadotomo Y, Nakamura Y. . Blood-brain Barrier Damage in the Pentylenetetrazole Generalized Seizure Model Mice Using Gadolinium-enhanced Magnetic Resonance Imaging. INDJ 2018;21;12(1):1-8.
11. Cremer JE, Cunningham VJ, Pardridge WM, Braun LD, Oldendorf WH. Kinetics of blood-brain barrier transport of pyruvate, lactate and glucose in suckling, weanling and adult rats. J Neurochem. 1979;33(2):439-45. doi: 10.1111/j.1471-4159.1979.tb05173.x. PubMed PMID: 469534.
12. Hurd RE, Yen YF, Tropp J, Pfefferbaum A, Spielman DM, Mayer D. Cerebral dynamics and metabolism of hyperpolarized [1-(13)C]pyruvate using time-resolved MR spectroscopic imaging. J Cereb Blood Flow Metab. 2010;30(10):1734-41. Epub 20100630. doi: 10.1038/jcbfm.2010.93. PubMed PMID: 20588318; PMCID: PMC2975615.
Figures