4131
MRS4Brain Toolbox: an harmonized and accessible workflow for preclinical MRSI data processing1CIBM Center for Biomedical imaging, Lausanne, Switzerland, 2Animal Imaging and Technology, Lausanne, Switzerland, 3Sunnybrook Research Institute, University of Toronto, Toronto, ON, Canada
Synopsis
Keywords: Software Tools, Software Tools, preclinical, MRSI, spectroscopy
Motivation: Numerous software options exist for MRS processing, yet the preclinical domain lacks a harmonized multimodal toolbox featuring a graphical user interface (GUI).
Goal(s): Our goal was to create a harmonized toolbox tailored to preclinical MRS processing, with a special focus on addressing MRSI-related challenges.
Approach: The MRS4Brain Toolbox was designed to handle 1H and X nuclei data, and to allow brain segmentation of MRSI voxels in order to investigate brain regional differences.
Results: Fast and user-friendly brain MRSI segmentation and metabolic mapping were achieved, promoting the study of brain-regional differences.
Impact: The implementation of the open-source MRS4Brain Toolbox enables rapid and straightforward advanced preclinical MRS(I) data processing and quantification. It falls in line with the within- and across-site standardization effort launched by the MRS community.
Introduction
The development of MRS toolboxes has arisen due to expert consensus1–3 recommendations, driven by the necessity for harmonizing the steps involved in reconstruction, preprocessing, fitting and quantification of MRS data. In the clinical realm, the diversity of available softwares is valuable (Osprey4, Fid-A5, FSL6, Gannet7, Oryx-MRSI8, MRSpa9, …). However, for preclinical studies, there is still a notable absence of harmonized softwares, especially in the MR spectroscopic imaging (MRSI) context. MRSI acquisitions are characterized by a huge amount of spectra acquired at once, low SNR due to smaller voxel size, possible lipid contaminations and distortions due to imperfect water suppression.10The MRS4Brain Toolbox was designed to offer advanced functionalities for Bruker preclinical MRSI data, encompassing preprocessing, fitting, quantification, semi-automatic quality control, co-registration and segmentation of metabolic maps using anatomical images, all conveniently integrated within a single open-source graphical user interface (GUI). The development of this user-friendly toolbox aims to streamline the processing workflow and enhance the accessibility of MRSI for researchers in the preclinical field.
Description
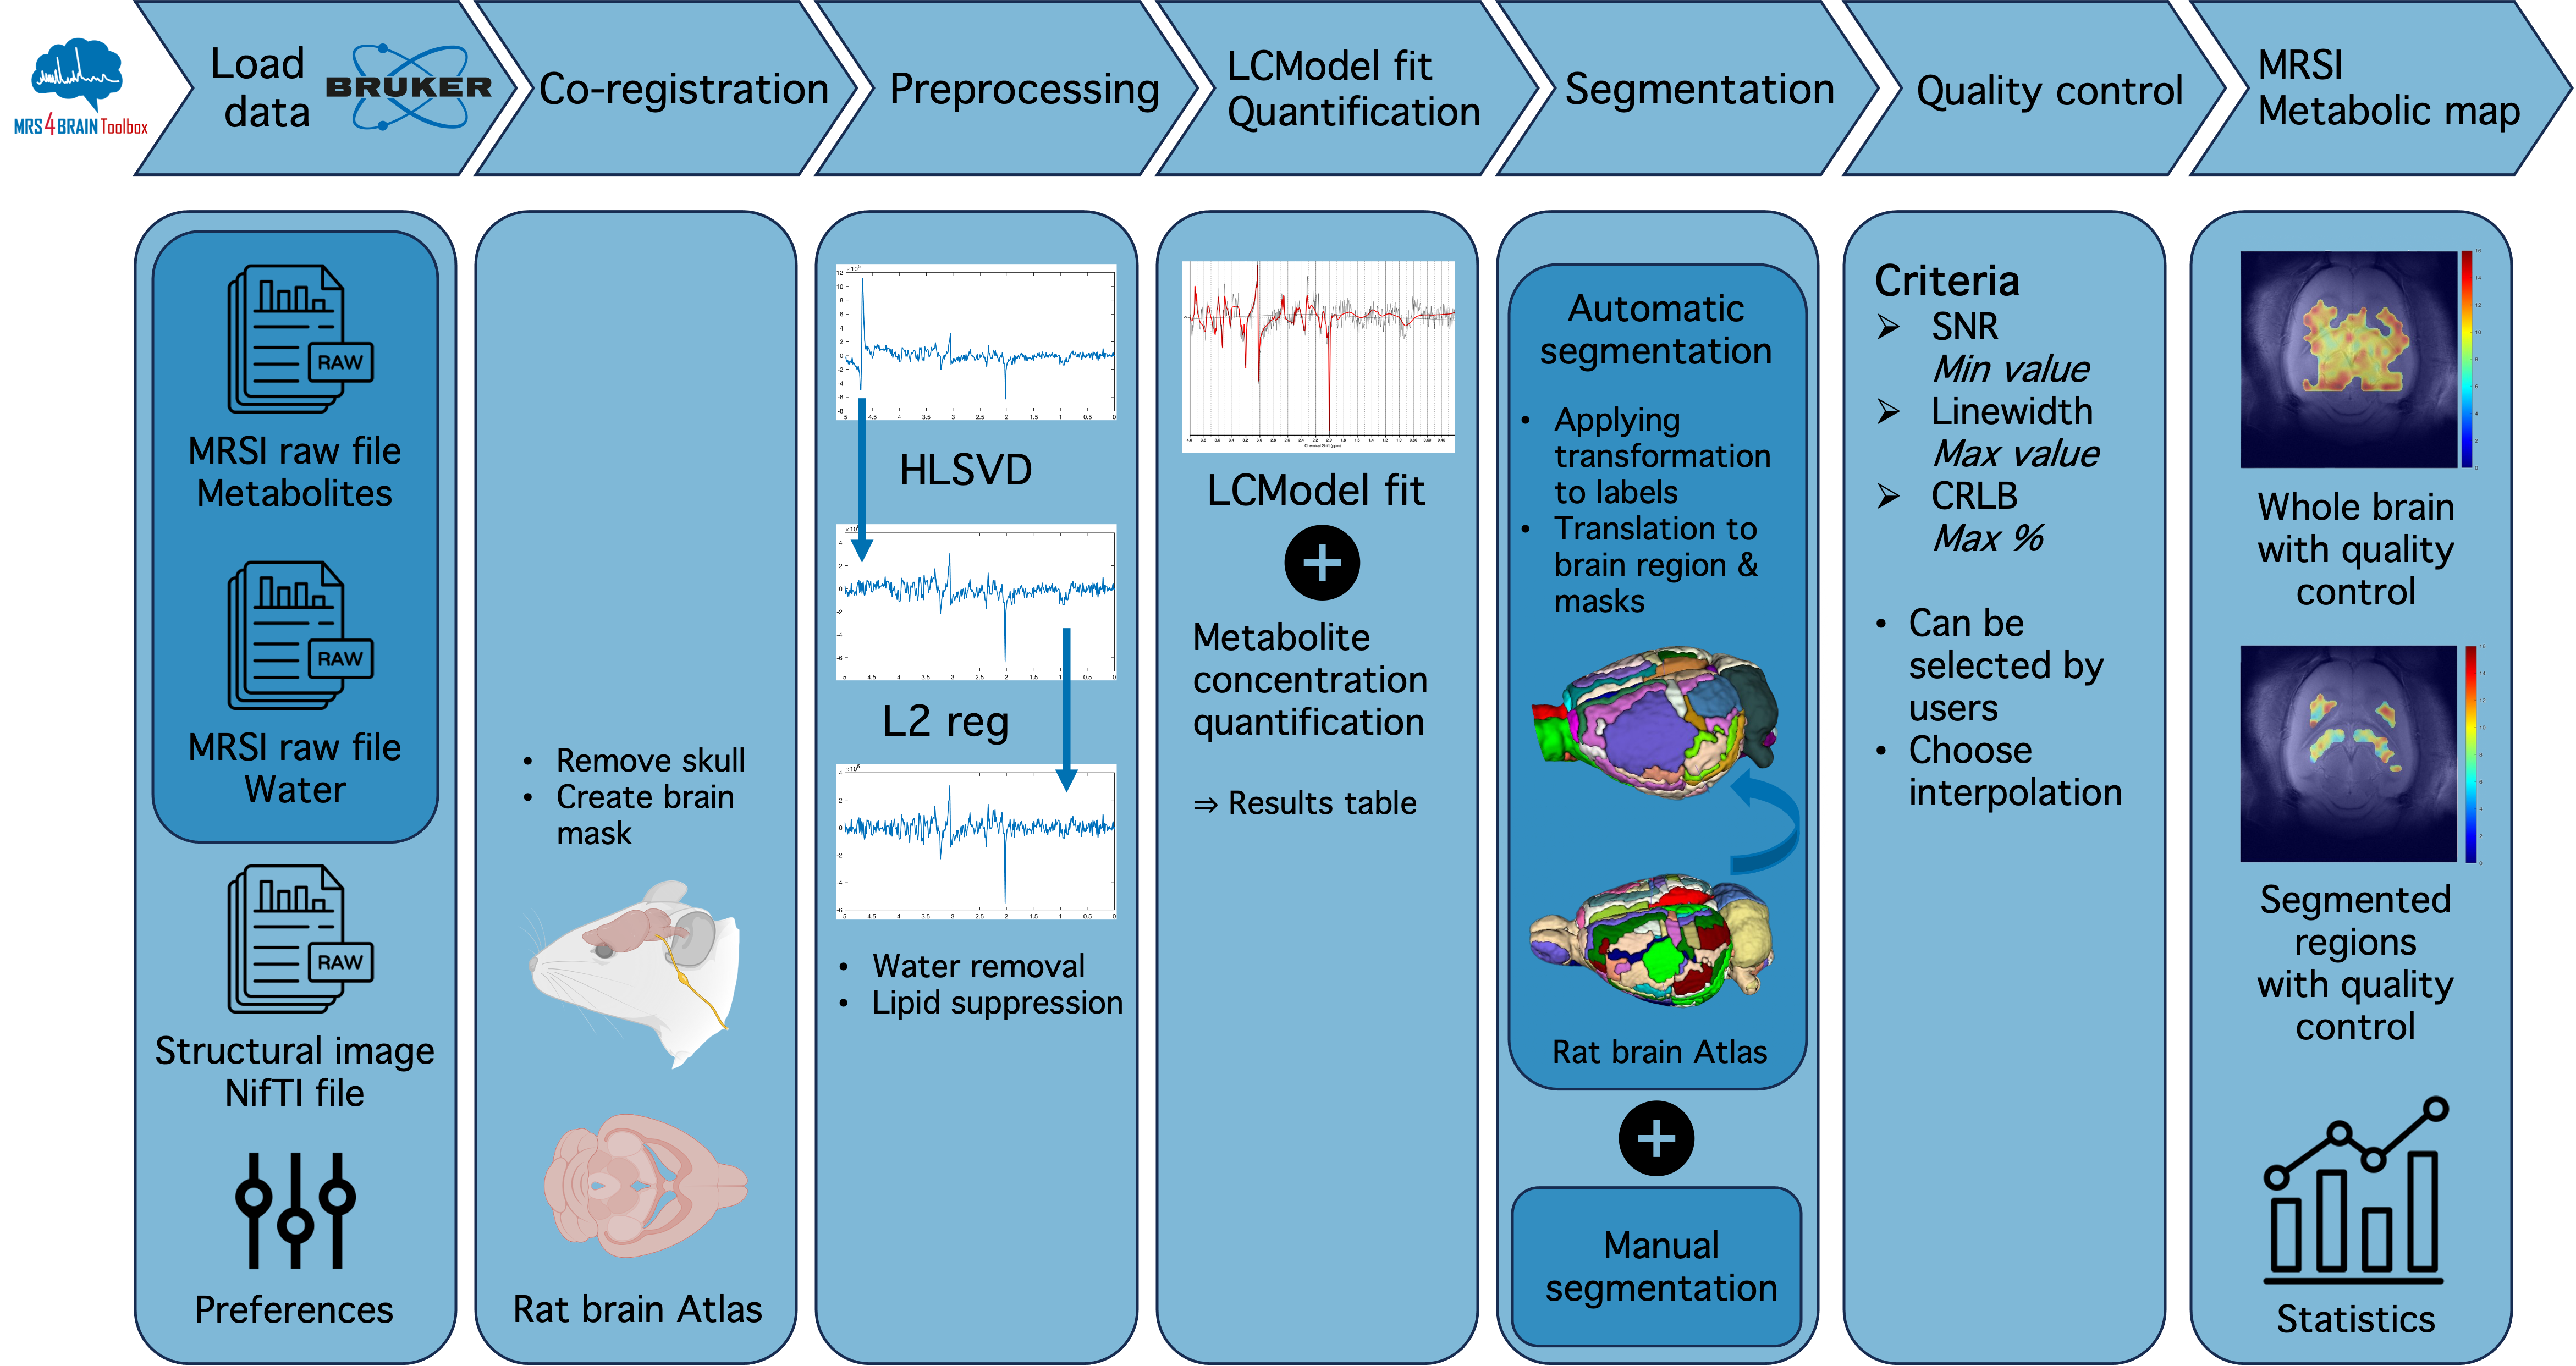
The MRS4Brain Toolbox is written in MATLAB 2023a (MatWorks, USA) and encompasses three distinct spectroscopy modalities (MRSI, single voxel MRS, dMRS), with our primary focus directed towards MRSI. The processing workflow contains several key steps (Figure 1): loading of raw Bruker Paravision 360 (version 1.1 and 3.3) data, preprocessing of the MRSI data, spectral quality control, quantification, co-registration of the MRSI metabolic maps on automatically segmented anatomical MRI images using a rat brain atlas and statistics on outcome metrics.Preprocessing: structural MRI brain mask is used to filter out the voxels located outside the brain and later for SVD-based lipid suppression11,12. Residual water signal removal is performed using a Hankel-Singular Value Decomposition (HSVD)13,14.
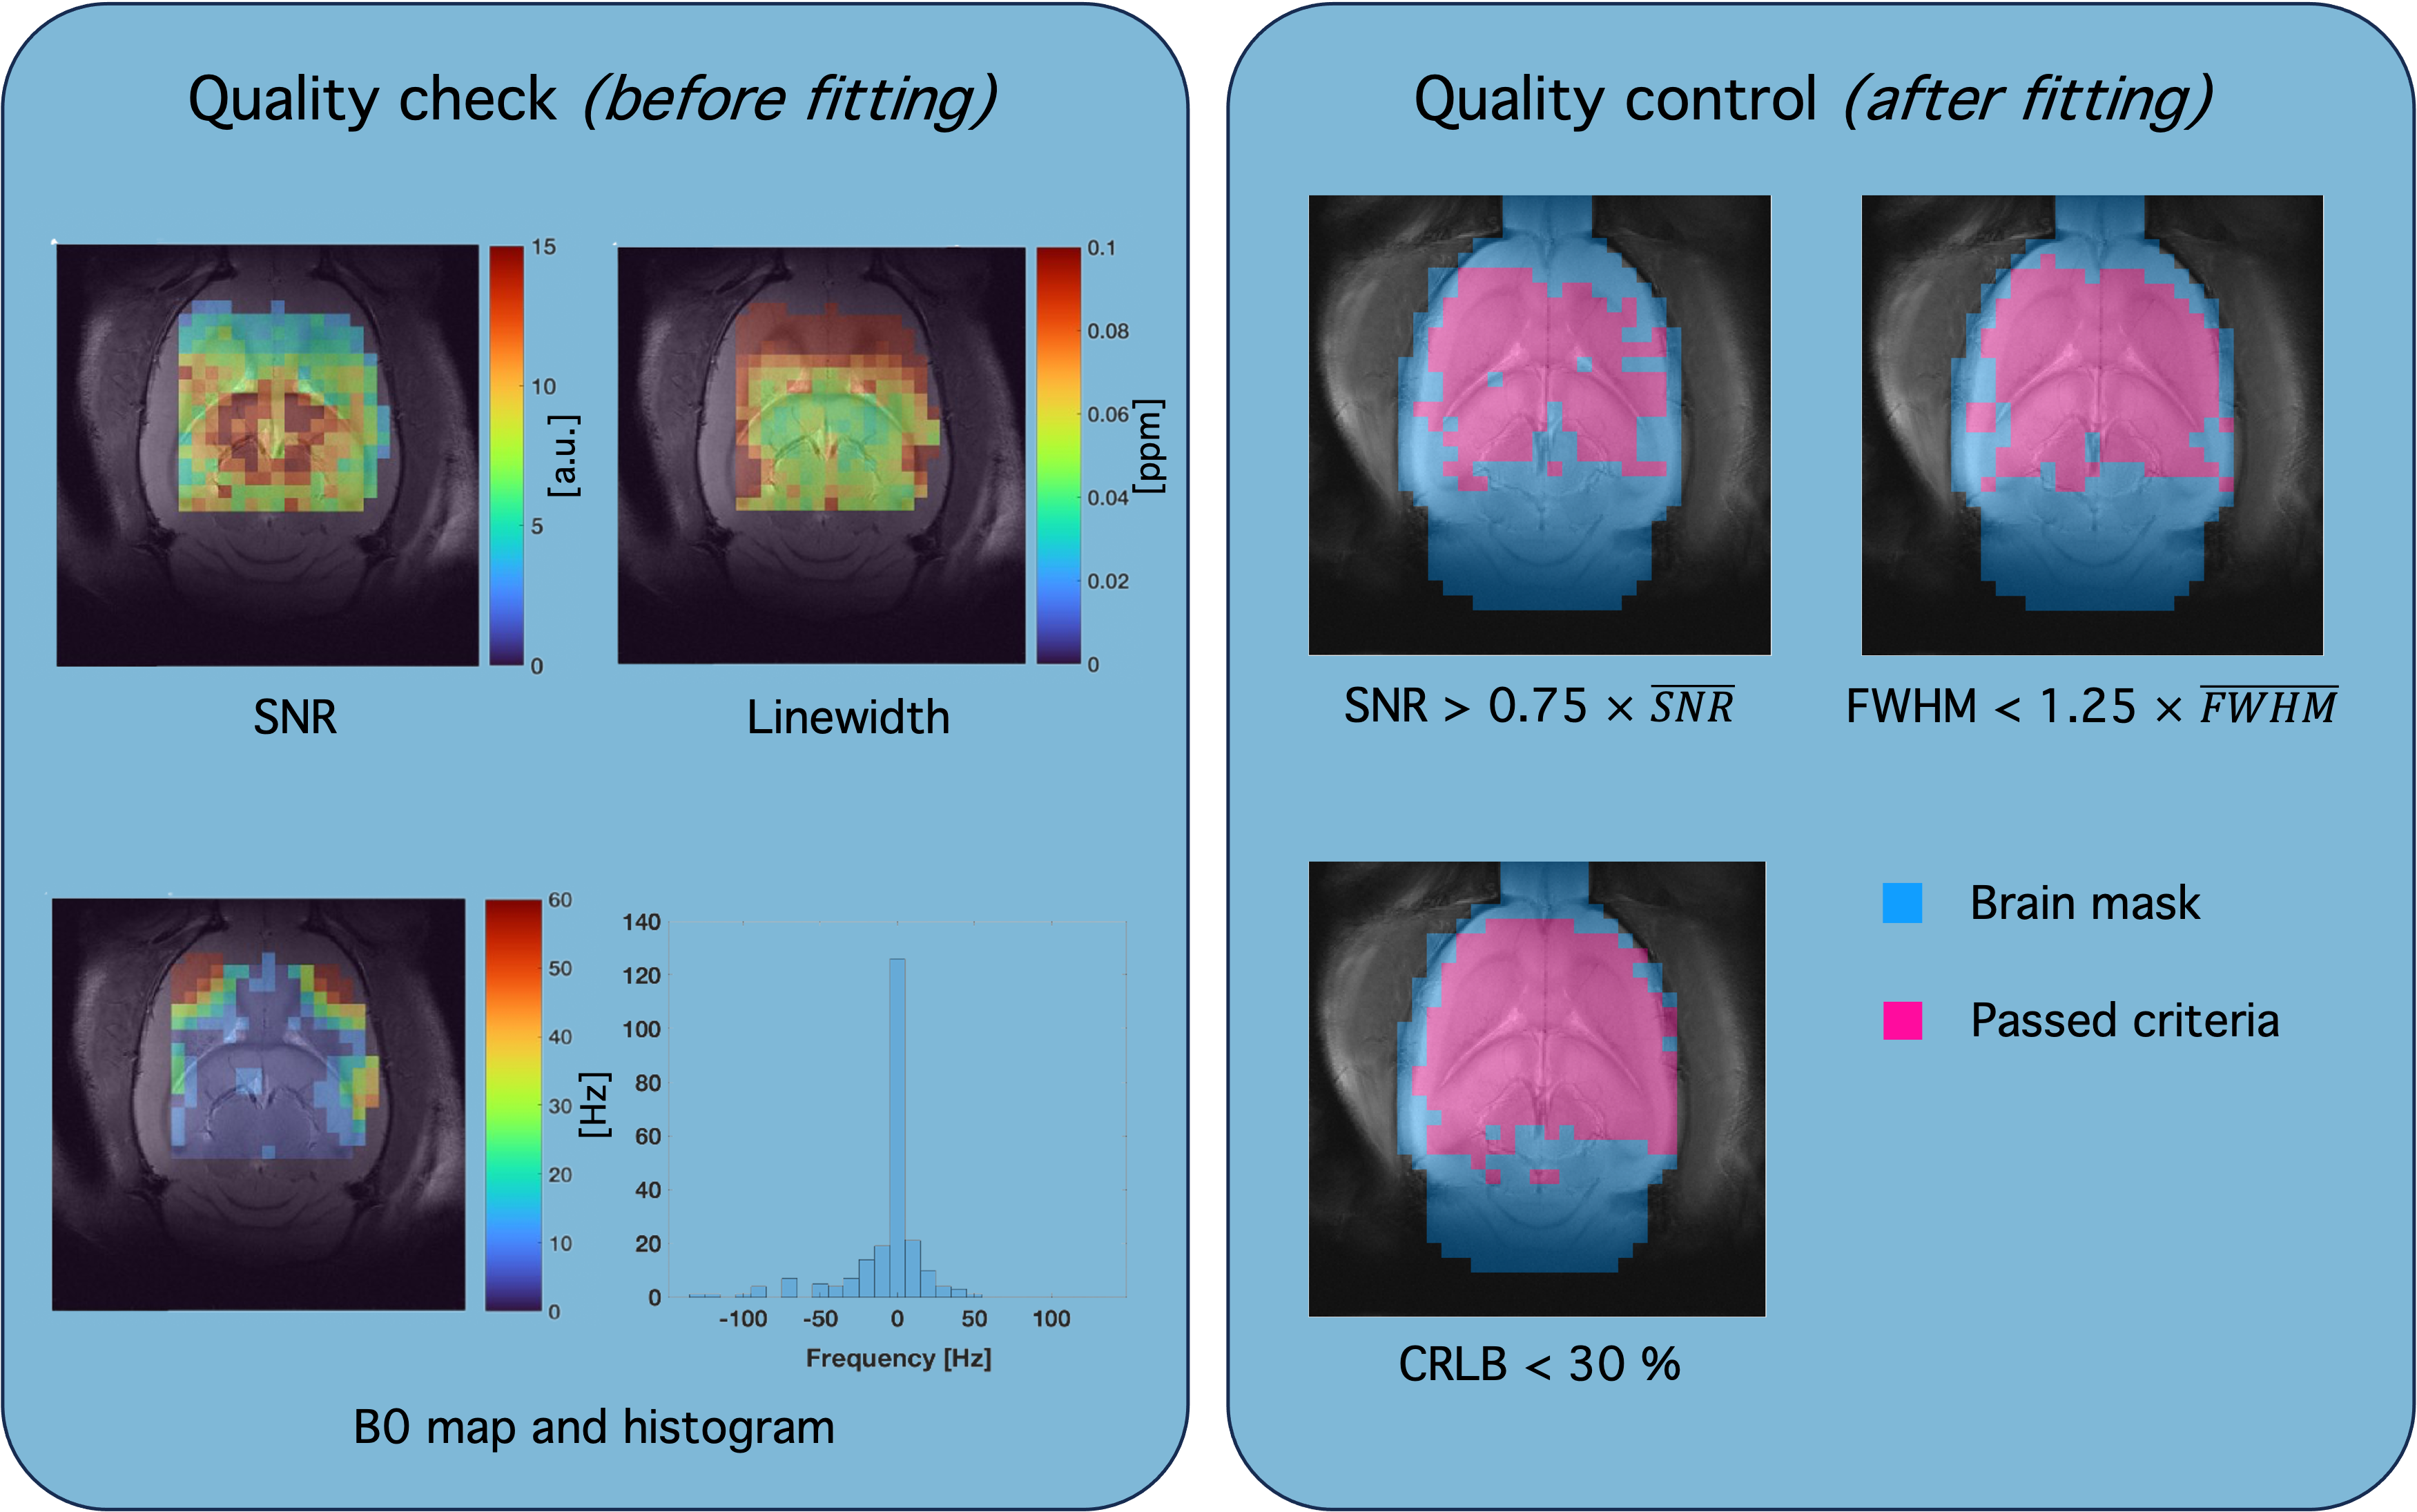
Overall quality control (Figure 2): linewidth and ΔB0 maps (i.e. frequency shifts) using the water signal; SNR map using NAA (2.01ppm) defined as the NAA peak height divided by one standard deviation (SD) of the noise measured in a noise-only region of the real part of the spectrum (-0.9 to -1.25 ppm).
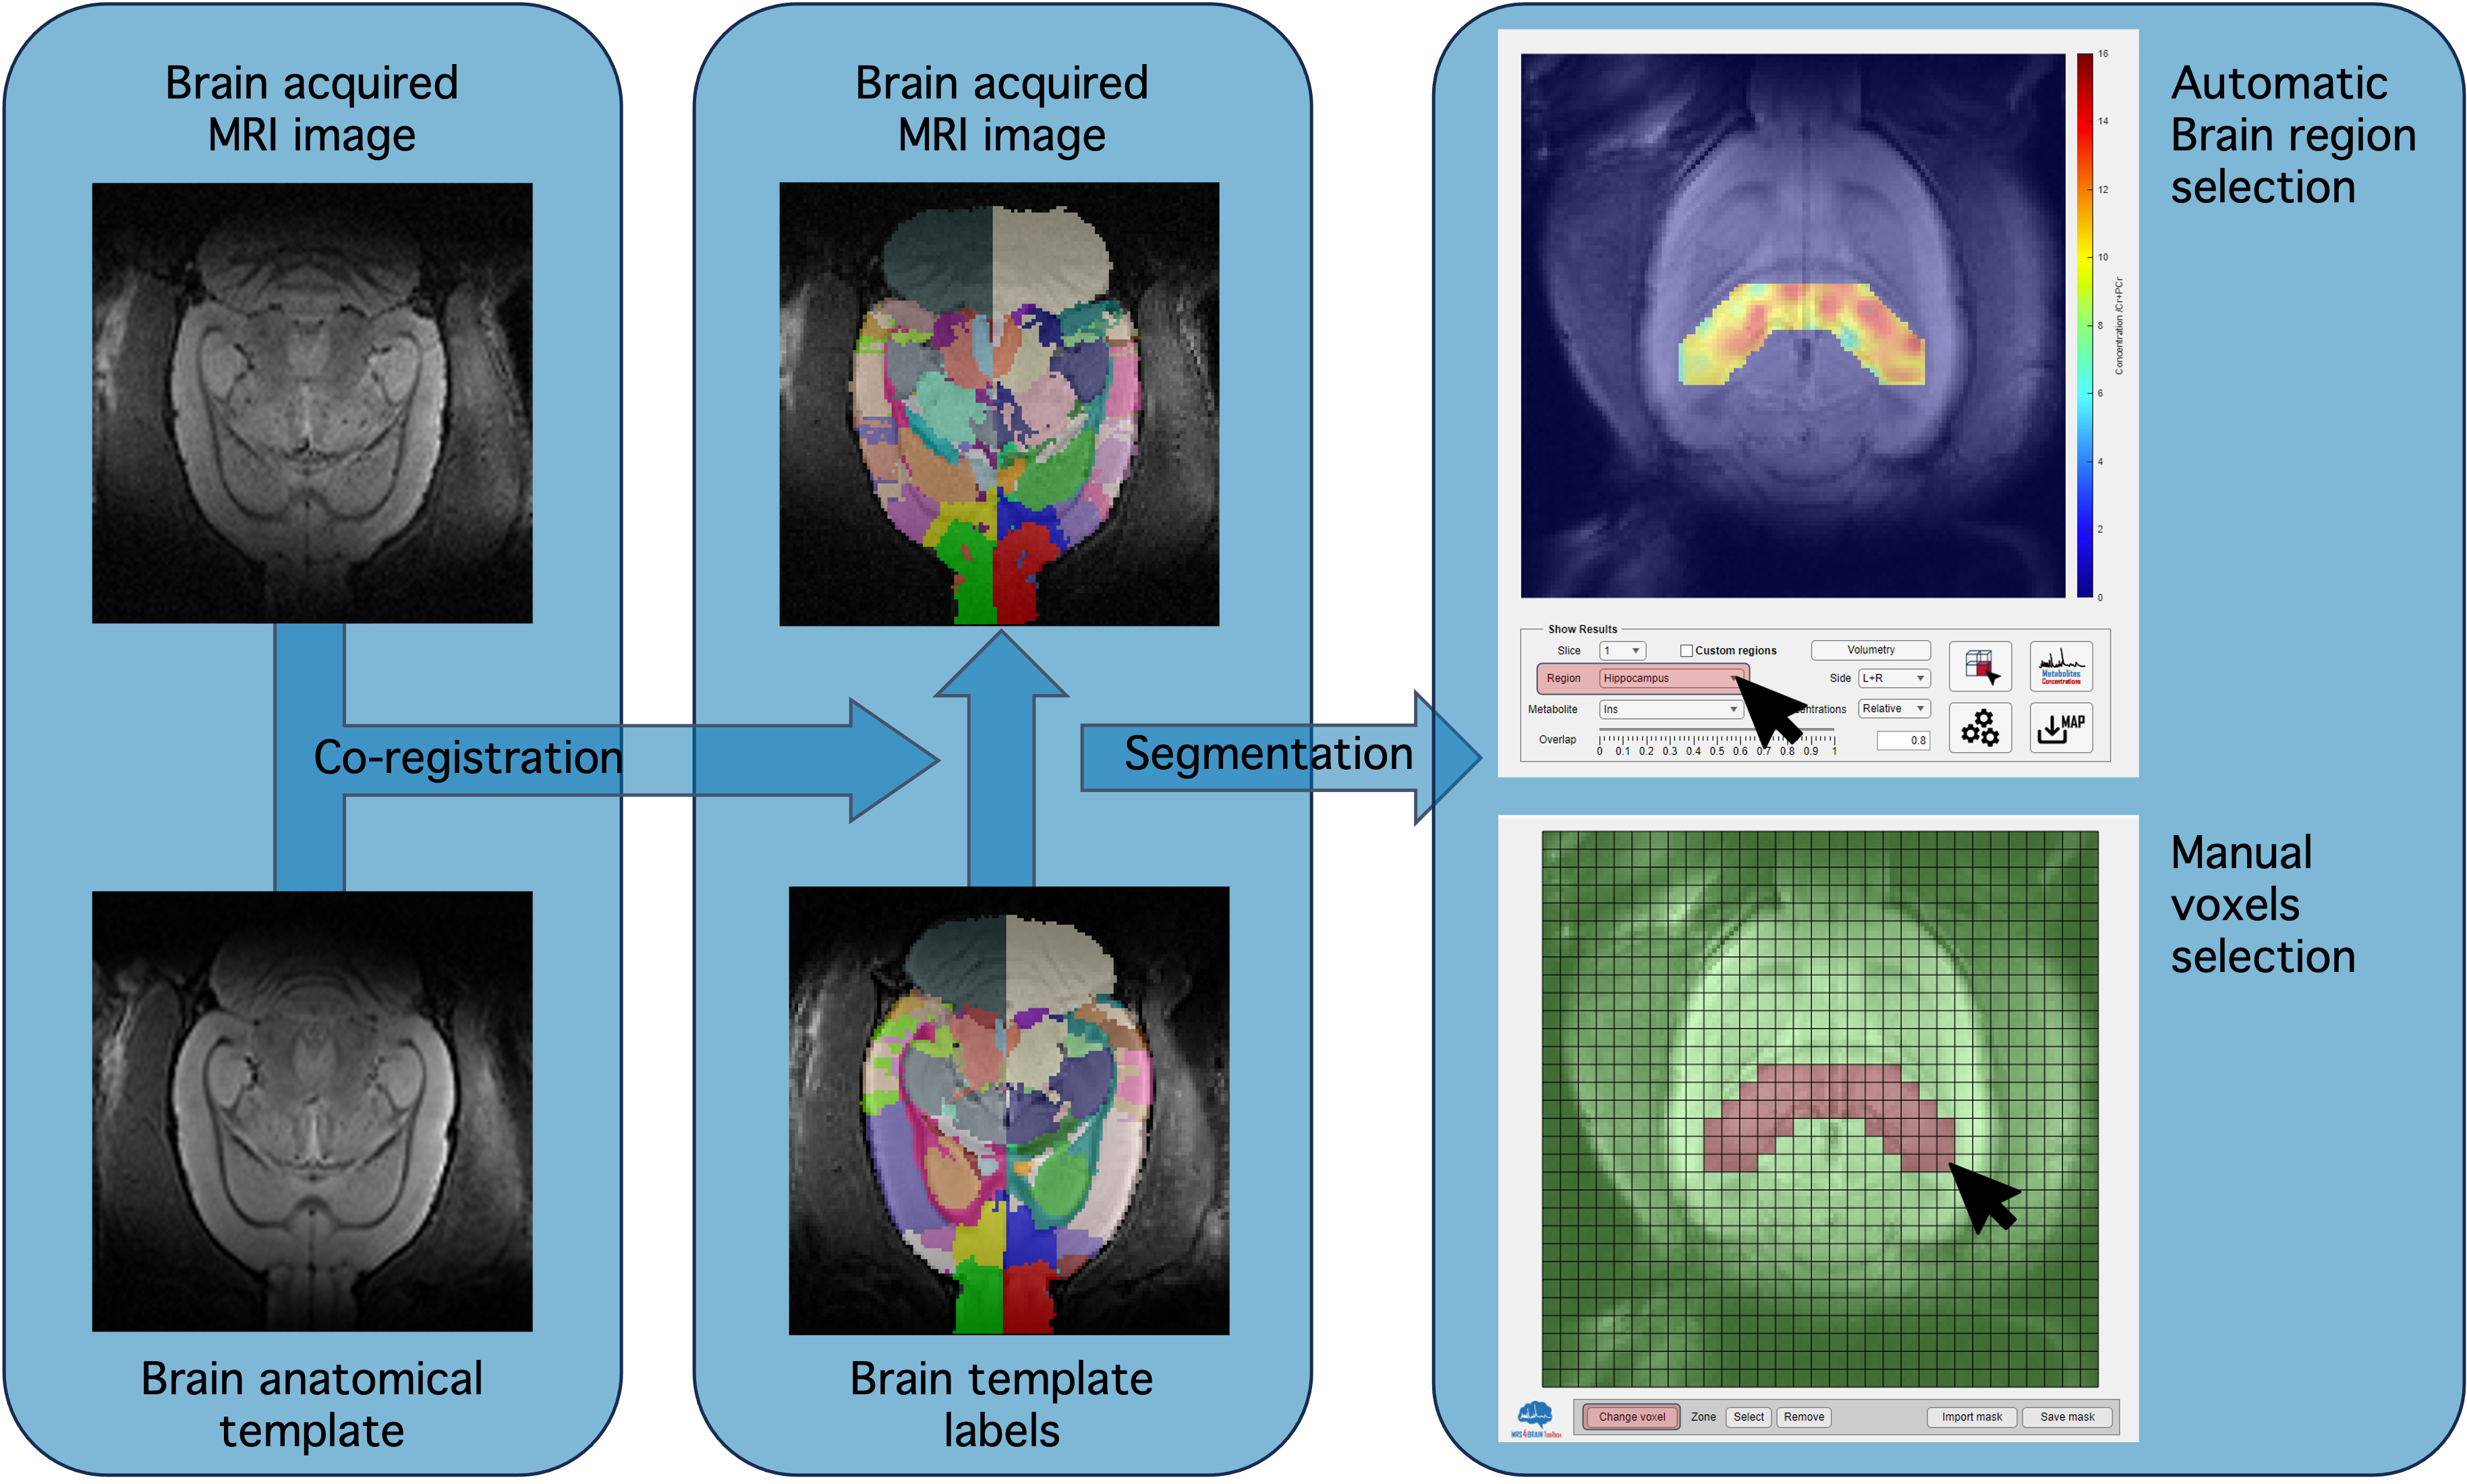
For the segmentation process, ANTs15–18 is used and combined with an in-house developed template based on the SIGMA19 atlas, customized to handle the dimensions of the rodent brain. Initially, it performs a co-registration between the acquired MRI images (fixed) and the corresponding template (moving), and subsequently applies affine and spatial transformations to the labelled template. Given that MRSI data do not cover the same number of voxels as MRI, the applied mask was adjusted to the lower resolution, by using a reshaping method. In addition, the toolbox allows manual segmentation of desired brain regions if needed (Figure 4).
Metabolite quantification is performed by LCModel20 (version 6.2) where the user can input a custom basis-set (in our case, simulated metabolites (NMRScope-B/jMRUI21–23) and acquired macromolecules). The LCModel control file can be adapted on the fly. Semi-automatic quality control after fitting included values of SNR and FWHM from LCModel, both averaged over the number of voxels used. Thresholds for quality filtering were chosen as follows: above 75% of mean SNR, below 125% of mean FWHM and CRLBs below 30%, and can be modified manually by users.
Statistical analysis (ANOVA24 tests) can be conducted using the saved mean and standard deviation of concentrations within a specific brain region.
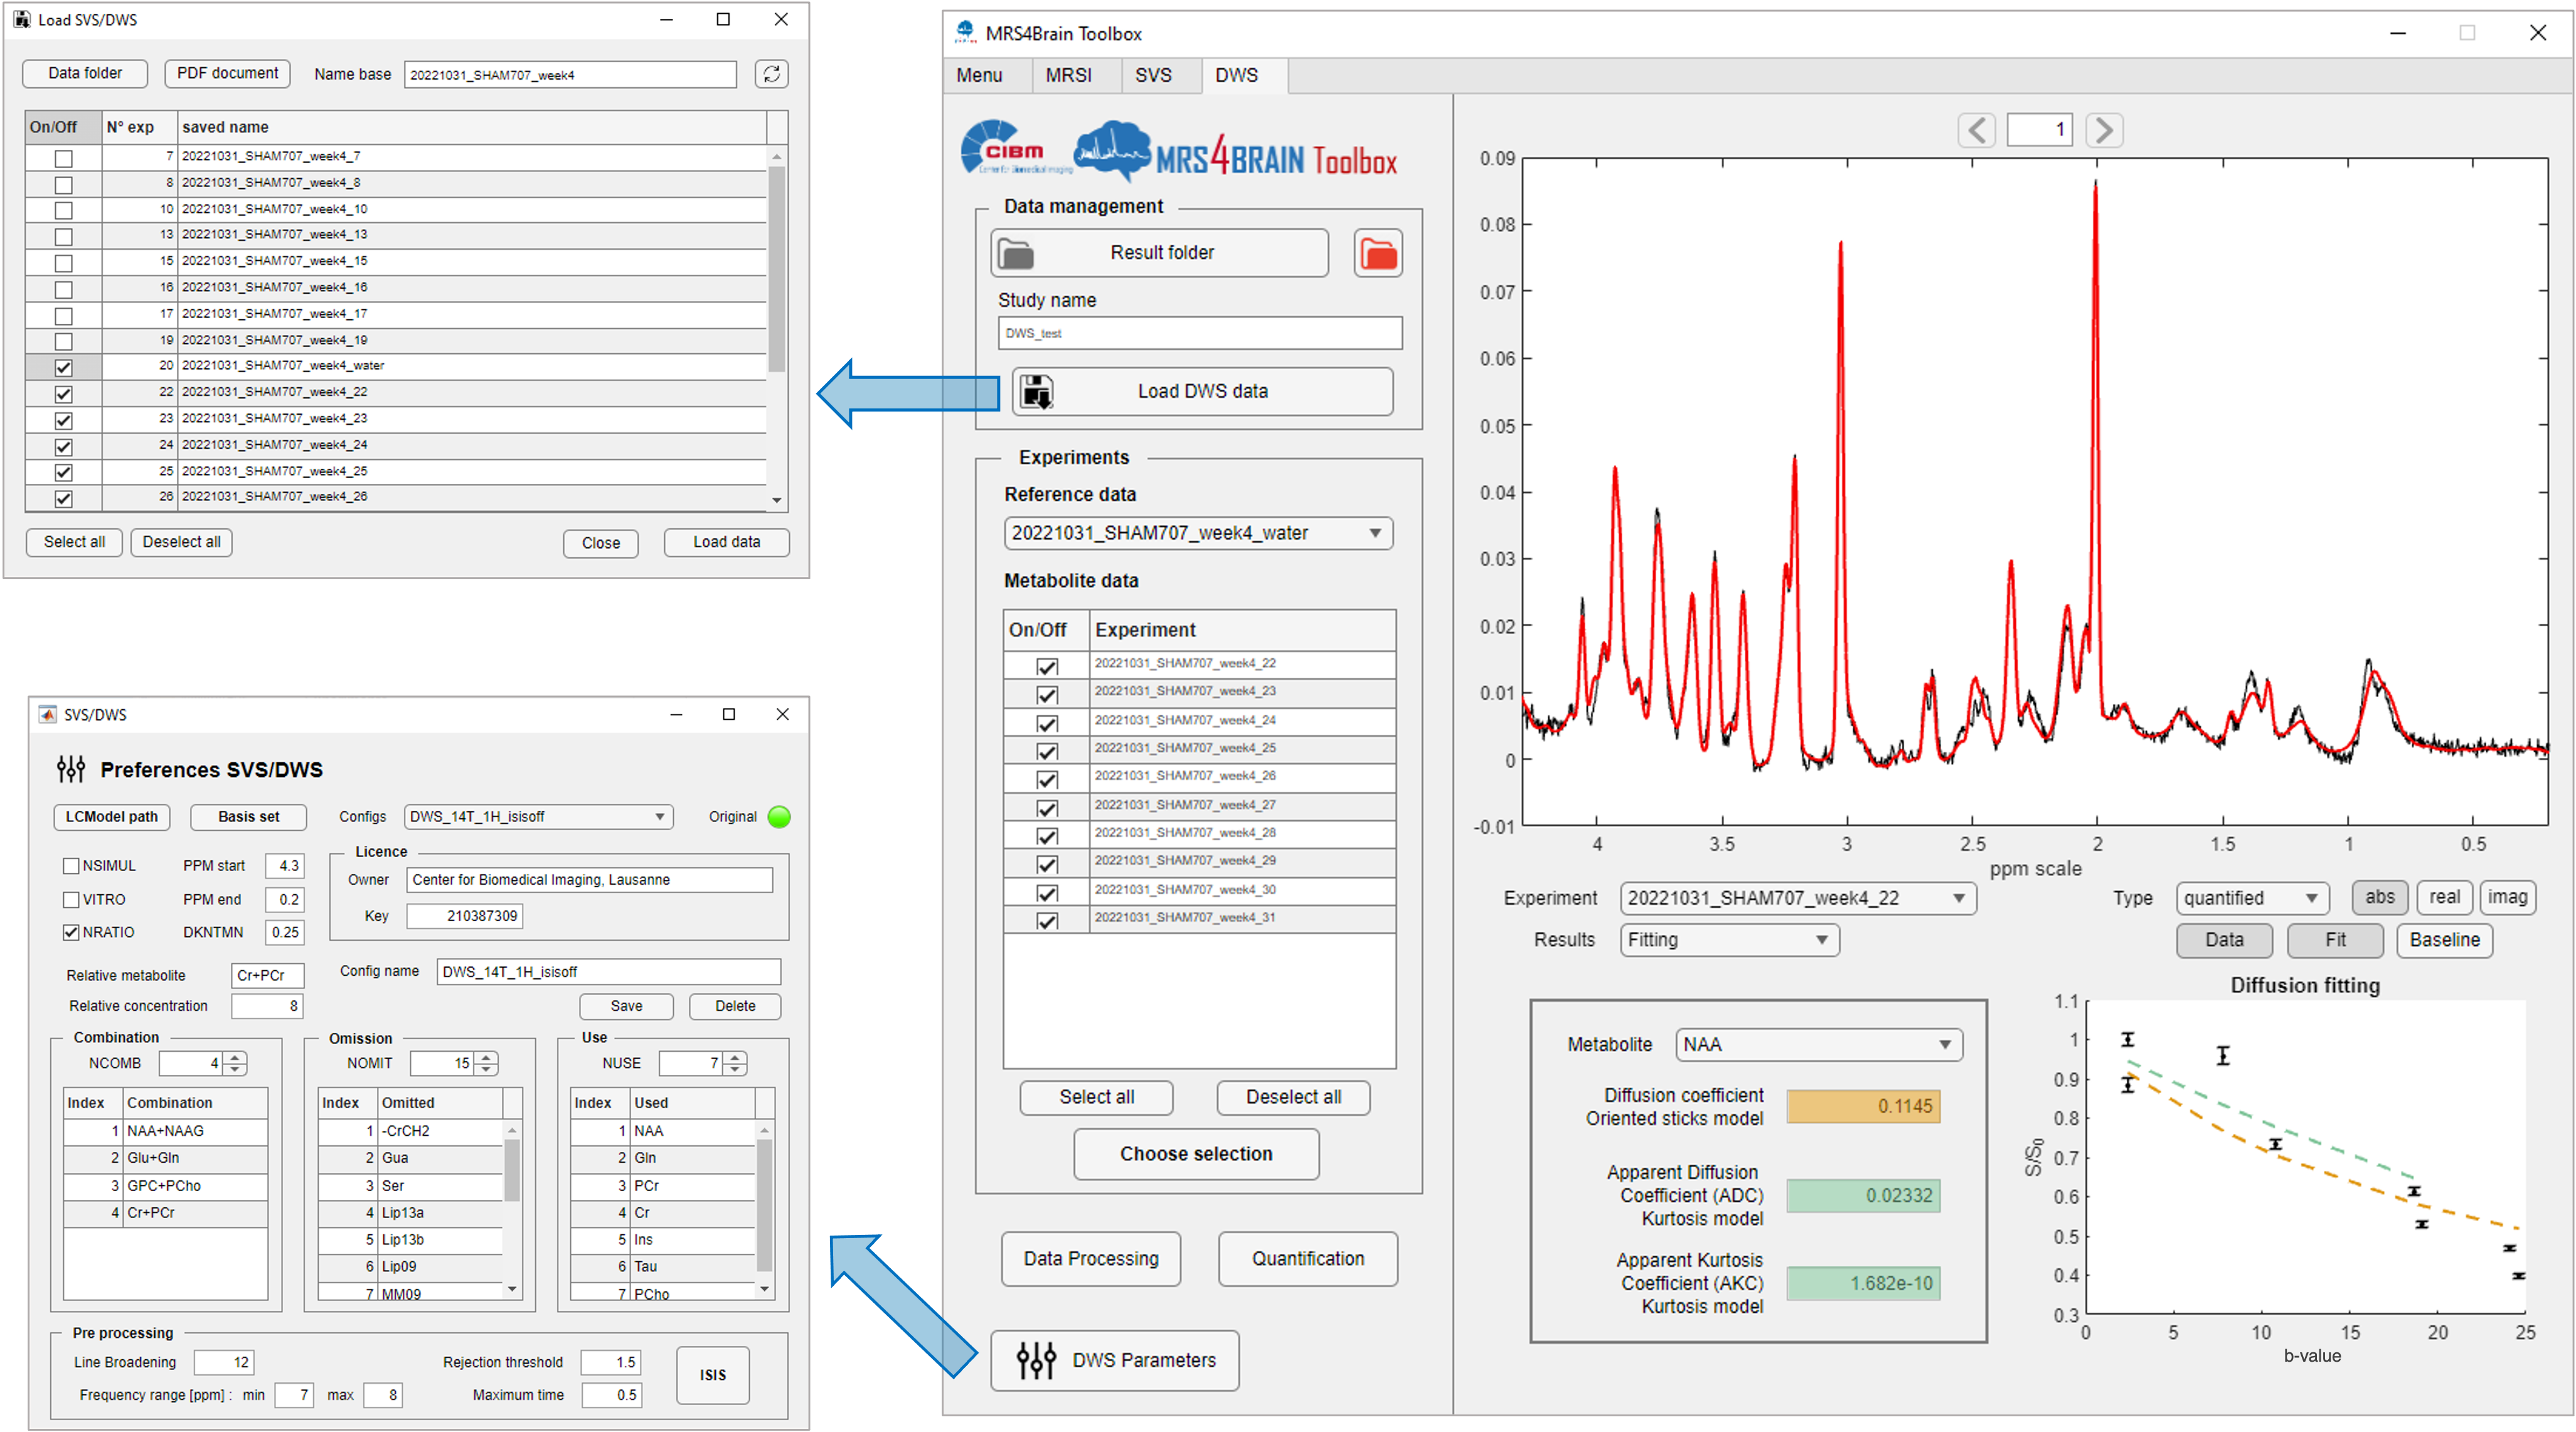
Furthermore, the toolbox has the capability to process SVS data and diffusion MRS data with incorporated diffusion models (Callaghan’s model of randomly oriented sticks25–27 yielding metabolite diffusivity Dintra along the sticks and the cumulant expansion at second order yielding the apparent diffusion coefficient D and kurtosis K) (Figure 5). The preprocessing steps in SVS are based on FID-A5 functions.
MRS4Brain toolbox was successfully applied at 14.1T in the rat brain using 1H-FID-MRSI and PRESS-MRSI28 datasets as shown in Figure 3. Brain regional differences were quantified and automatically displayed together with the statistics module. Additional modules are currently being implemented: compressed sensing and low rank reconstruction, MP-PCA denoising29,30, X-nuclei workflow, etc.
Conclusion
We introduced the MRS4Brain Toolbox, an open-source, well-structured software designed for MRSI end-to-end processing, brain region segmentation, metabolic mapping, and statistical analysis. In addition to its MRSI capabilities, the toolbox accommodates the processing of SVS and diffusion MRS data, each with its own specialized analysis workflow and supplementary features like biophysical modeling. MRS4Brain Toolbox has the potential to enhance comparability, repeatability, and reproducibility of metabolite estimates across sites, and to be combined with other multimodal approaches (e.g. PET) for advanced metabolic imaging applications.Acknowledgements
We acknowledge access to the facilities and expertise of the CIBM Center for Biomedical Imaging founded and supported by Lausanne University Hospital (CHUV), University of Lausanne (UNIL), Ecole polytechnique fédérale de Lausanne (EPFL), University of Geneva (UNIGE) and Geneva University Hospitals (HUG). Financial support was provided by the Swiss National Science Foundation (Project No. 310030_201218).References
1. Lanz B, Abaei A, Braissant O, et al. Magnetic resonance spectroscopy in the rodent brain: Experts’ consensus recommendations. NMR Biomed. 2021;34(5). doi:10.1002/nbm.4325
2. Wilson M, Andronesi O, Barker PB, et al. Methodological consensus on clinical proton MRS of the brain: Review and recommendations. Magn Reson Med. 2019;82(2):527-550. doi:10.1002/mrm.27742
3. Near J, Harris AD, Juchem C, et al. Preprocessing, analysis and quantification in single‐voxel magnetic resonance spectroscopy: experts’ consensus recommendations. NMR Biomed. 2021;34(5):e4257. doi:10.1002/nbm.4257
4. Oeltzschner G, Zöllner HJ, Hui SCN, et al. Osprey: Open-Source Processing, Reconstruction & Estimation of Magnetic Resonance Spectroscopy Data. Published online May 6, 2020:2020.02.12.944207. doi:10.1101/2020.02.12.944207
5. Simpson R, Devenyi GA, Jezzard P, Hennessy TJ, Near J. Advanced processing and simulation of MRS data using the FID appliance (FID-A)—An open source, MATLAB-based toolkit. Magn Reson Med. 2017;77(1):23-33. doi:10.1002/mrm.26091
6. Clarke WT, Jbabdi S. FSL-MRS: An end-to-end spectroscopy analysis package. Published online June 18, 2020:2020.06.16.155291. doi:10.1101/2020.06.16.155291
7. Edden RAE, Puts NAJ, Harris AD, Barker PB, Evans CJ. Gannet: A batch-processing tool for the quantitative analysis of gamma-aminobutyric acid-edited MR spectroscopy spectra. J Magn Reson Imaging. 2014;40(6):1445-1452. doi:10.1002/jmri.24478
8. Cengiz S, Yildirim M, Bas A, Ozturk-Isik E. ORYX-MRSI: A Fully-Automated Open-Source Software for Three-Dimensional Proton Magnetic Resonance Spectroscopic Imaging Data Analysis. Published online November 14, 2021:2021.11.12.468398. doi:10.1101/2021.11.12.468398
9. Deelchand DK, Henry PG, Joers JM, et al. Plug-and-play Advanced Magnetic Resonance Spectroscopy. Magn Reson Med. 2022;87(6):2613-2620. doi:10.1002/mrm.29164
10. Simicic D, Alves B, Mosso J, et al. Fast high-resolution metabolite mapping in the rat brain using 1H-FID-MRSI at 14.1T. 2023;(arXiv:2307.03261). doi:10.48550/arXiv.2307.03261
11. Klauser A, Strasser B, Thapa B, Lazeyras F, Andronesi O. Achieving high-resolution 1H-MRSI of the human brain with compressed-sensing and low-rank reconstruction at 7 Tesla. J Magn Reson. 2021;331:107048. doi:10.1016/j.jmr.2021.107048
12. Bilgic B, Gagoski B, Kok T, Adalsteinsson E. Lipid suppression in CSI with spatial priors and highly undersampled peripheral k-space. Magn Reson Med. 2013;69(6):1501-1511. doi:10.1002/mrm.24399
13. Klauser A, Courvoisier S, Kasten J, et al. Fast high-resolution brain metabolite mapping on a clinical 3T MRI by accelerated 1H-FID-MRSI and low-rank constrained reconstruction. Magn Reson Med. 2019;81(5):2841-2857. doi:10.1002/mrm.27623
14. Barkhuijsen H, de Beer R, van Ormondt D. Improved algorithm for noniterative time-domain model fitting to exponentially damped magnetic resonance signals. J Magn Reson 1969. 1987;73(3):553-557. doi:10.1016/0022-2364(87)90023-0
15. Avants BB, Yushkevich P, Pluta J, et al. The optimal template effect in hippocampus studies of diseased populations. NeuroImage. 2010;49(3):2457-2466. doi:10.1016/j.neuroimage.2009.09.062
16. Avants B, Tustison NJ, Song G. Advanced Normalization Tools: V1.0. Insight J. Published online July 29, 2009. doi:10.54294/uvnhin
17. Avants BB, Epstein CL, Grossman M, Gee JC. Symmetric diffeomorphic image registration with cross-correlation: evaluating automated labeling of elderly and neurodegenerative brain. Med Image Anal. 2008;12(1):26-41. doi:10.1016/j.media.2007.06.004
18. Avants BB, Tustison NJ, Wu J, Cook PA, Gee JC. An Open Source Multivariate Framework for n-Tissue Segmentation with Evaluation on Public Data. Neuroinformatics. 2011;9(4):381-400. doi:10.1007/s12021-011-9109-y
19. Barrière DA, Magalhães R, Novais A, et al. The SIGMA rat brain templates and atlases for multimodal MRI data analysis and visualization. Nat Commun. 2019;10(1):5699. doi:10.1038/s41467-019-13575-7
20. Provencher SW. Estimation of metabolite concentrations from localized in vivo proton NMR spectra. Magn Reson Med. 1993;30(6):672-679. doi:10.1002/mrm.1910300604
21. Starčuk Z, Starčuková J. Quantum-mechanical simulations for in vivo MR spectroscopy: Principles and possibilities demonstrated with the program NMRScopeB. Anal Biochem. 2017;529:79-97. doi:10.1016/j.ab.2016.10.007
22. Govindaraju V MA Young K. Proton NMR chemical shifts and coupling constants for brain metabolites. NMR Biomed. 2000;13:129-153. doi:10.1002/1099-1492(200005)13:33.3.CO;2-M
23. Govind V, Young K, Maudsley AA. Corrigendum to Proton NMR chemical shifts and coupling constants for brain metabolites. [NMR Biomed. 13, (2000), 129-153]. NMR Biomed. 2015;28(7):923-924. doi:10.1002/nbm.3336
24. Stahle L, Wold S. Analysis of variance (ANOVA). Chemom Intell Lab Syst. 1989;6(4):259-272. doi:10.1016/0169-7439(89)80095-4
25. Callaghan PT, Jolley KW, Lelievre J. Diffusion of water in the endosperm tissue of wheat grains as studied by pulsed field gradient nuclear magnetic resonance. Biophys J. 1979;28(1):133-141. doi:10.1016/S0006-3495(79)85164-4
26. Palombo M, Ligneul C, Valette J. Modeling diffusion of intracellular metabolites in the mouse brain up to very high diffusion-weighting: Diffusion in long fibers (almost) accounts for non-monoexponential attenuation. Magn Reson Med. 2017;77(1):343-350. doi:10.1002/mrm.26548
27. Palombo M, Shemesh N, Ronen I, Valette J. Insights into brain microstructure from in vivo DW-MRS. NeuroImage. 2018;182(November):97-116. doi:10.1016/j.neuroimage.2017.11.028
28. Bogner W, Otazo R, Henning A. Accelerated MR spectroscopic imaging—a review of current and emerging techniques. NMR Biomed. 2021;34(5). doi:10.1002/nbm.4314
29. Mosso J, Simicic D, Şimşek K, Kreis R, Cudalbu C, Jelescu IO. MP-PCA denoising for diffusion MRS data: promises and pitfalls. NeuroImage. 2022;263:119634.
30. Alves B, Simicic D, Mosso J, et al. Noise-reduction techniques for 1H-FID-MRSI at 14.1T: Monte-Carlo validation & in vivo application. 2023;(arXiv:2309.11204). doi:10.48550/arXiv.2309.11204
Figures
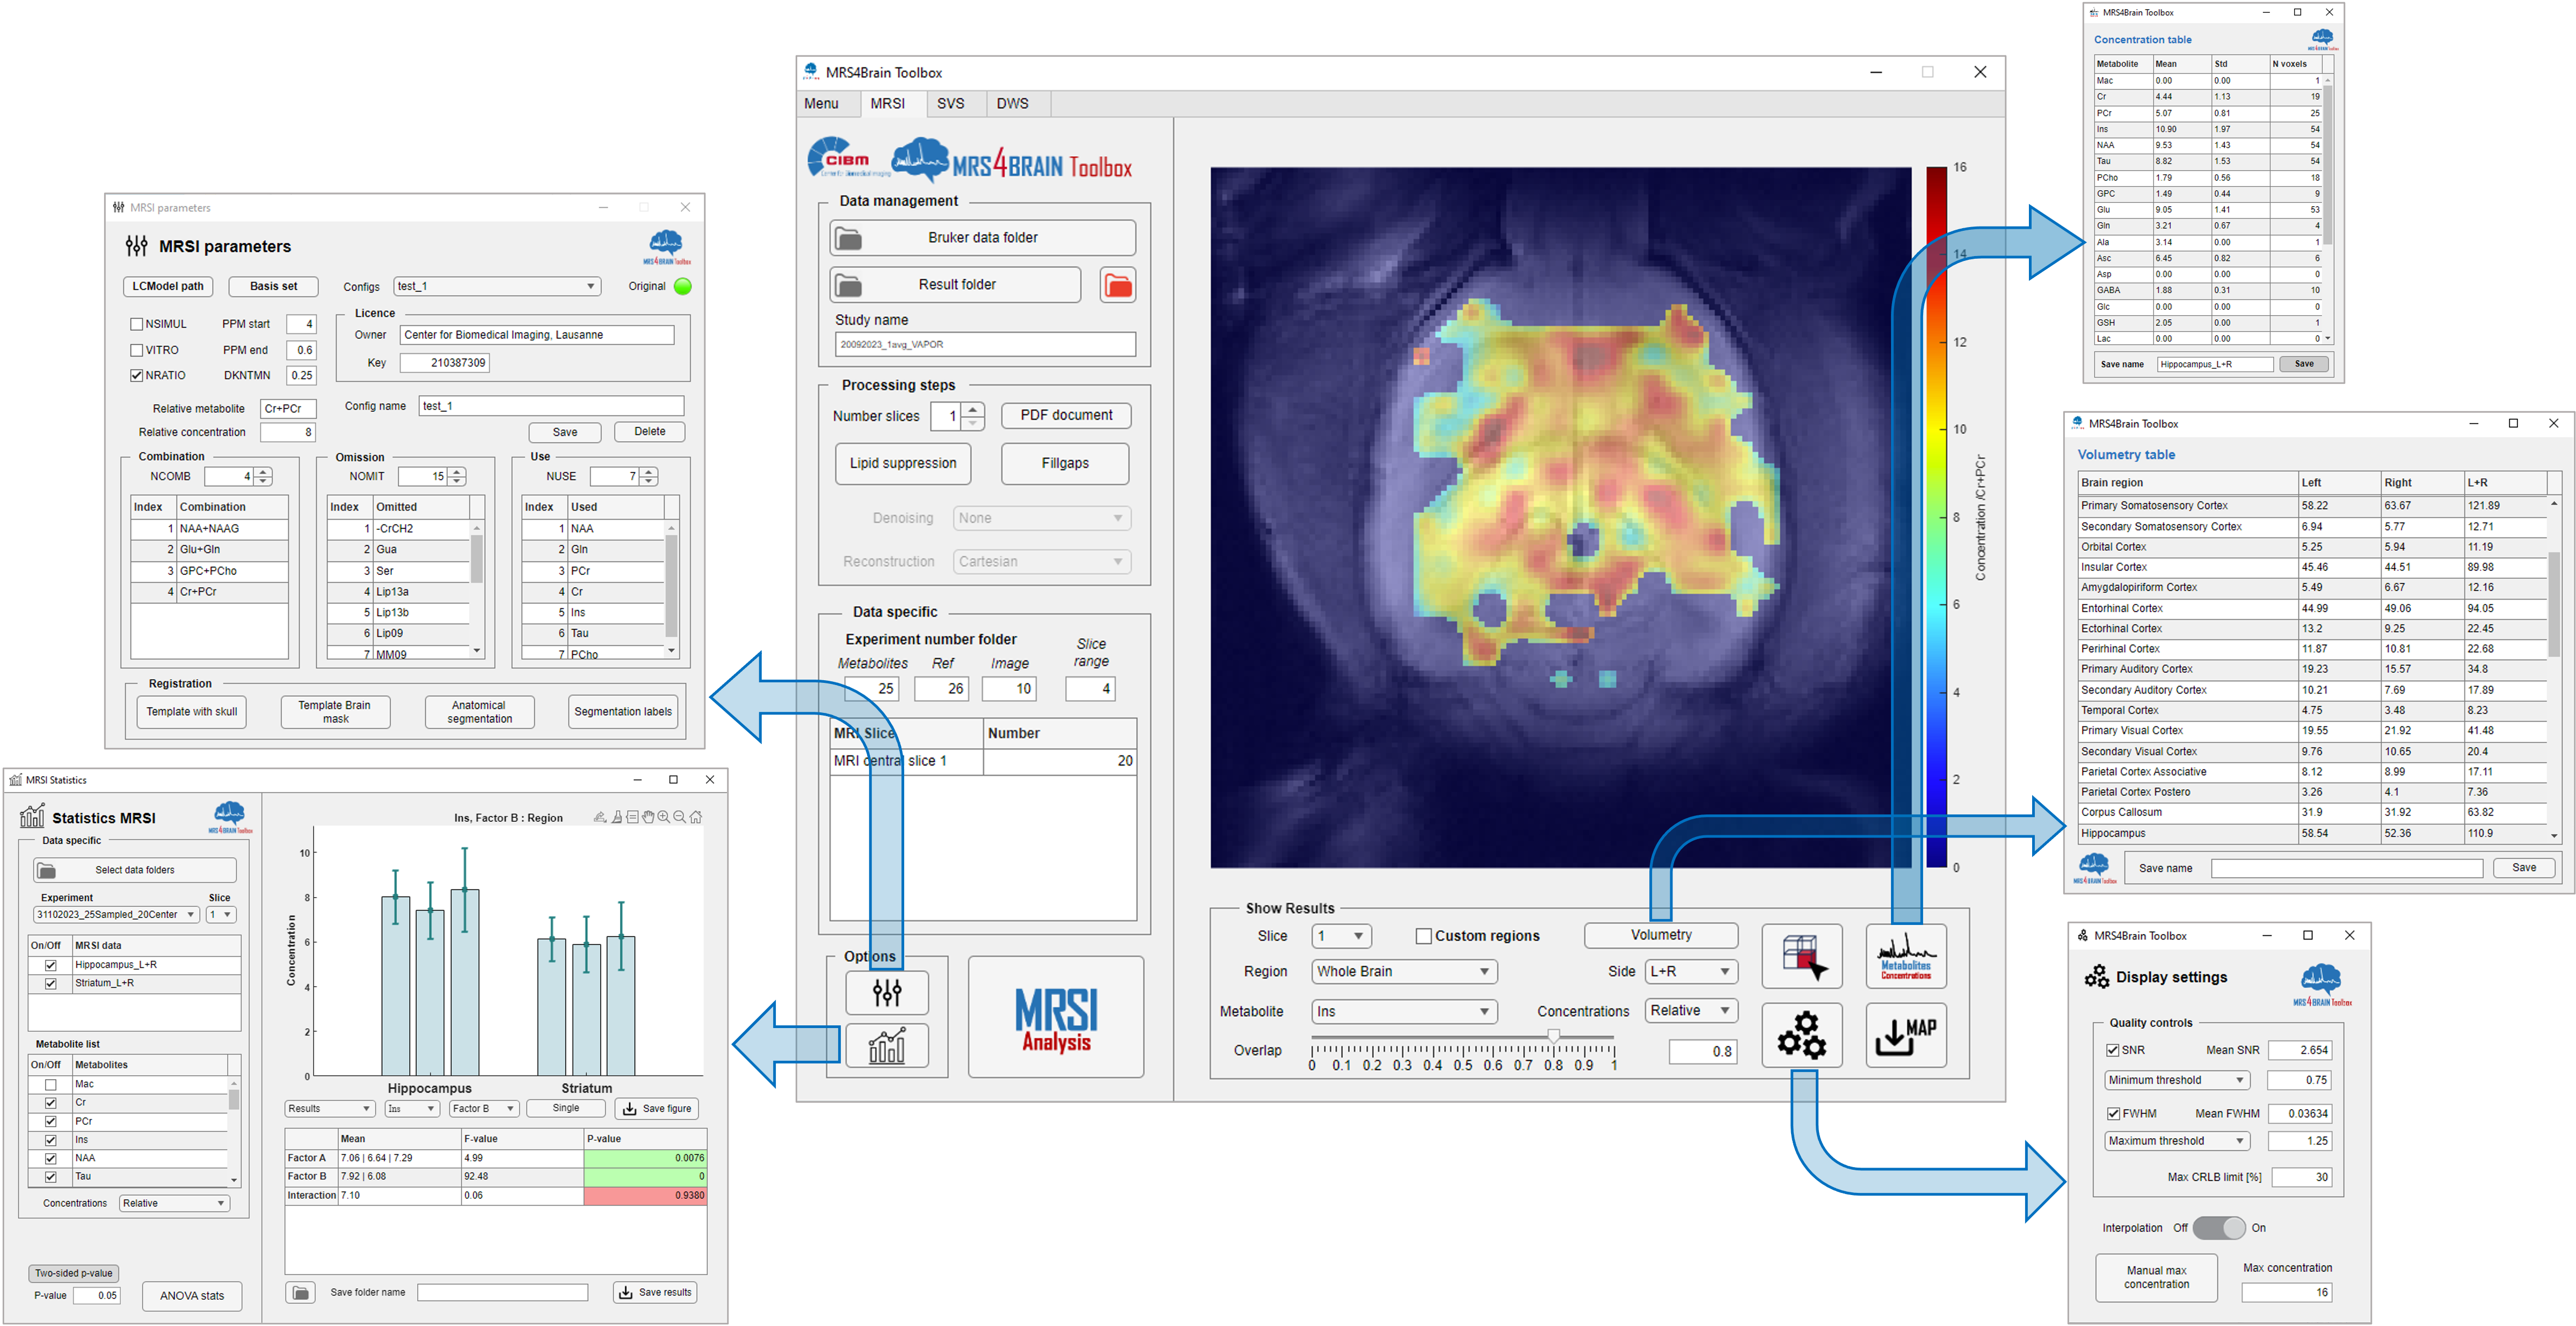
MRS4Brain Toolbox with MRSI functionalities:
- Main window (center): Processing workflow and metabolic map display.
- Parameters (top-left): Select LCModel options and registration atlas.
- Statistics (bottom-right): Analyze acquired data.
- Display options (bottom-right): Set quality control and map plot criteria.
- Volumetry (center-right): Examine brain region volumes.
- Concentration table (top-right): Save and view metabolic data.