4130
Mammalian Species: Development of Basic Tools for Standardized Brain Image Analysis1Faculty of Health Sciences, Tokyo Metropolitan University, Tokyo, Japan, 2Graduate school of Human Health Sciences, Tokyo Metropolitan Uiniversity, Tokyo, Japan, 3Veterinary Medical Center, Graduate School of Agricultural and Life Sciences, The University of Tokyo, Tokyo, Japan, 4Laboratory of Veterinary Surgery, Graduate School of Agricultural and Life Sciences, The University of Tokyo, Tokyo, Japan
Synopsis
Keywords: Large Animals, Nonhuman Primates, Animals
Motivation: Establishing standard brain images for various mammalian species may be useful in brain imaging analysis.
Goal(s): The current research aimed to establish a foundation for brain image analysis tools in a variety of mammalian species, including cats and marmosets, for which standard brain data are scarce.
Approach: For each species, we attempted to create an image of average brain using a nonrigid transformation algorithm. We also evaluated the quality of the average brain images by changing the number of subjects.
Results: We were able to create an image the average human, cat, marmoset, and mouse brain based on T1- and T2-weighted images.
Impact: This study provides an important foundation for the creation of standard brain images of various animal species and for the evaluation of individual differences.
Introduction
In brain science research, reference brain images are widely used for brain image analysis to account for individual differences in brain shape and size. Standard brain images are often used in analytical methods, such as the Voxel based morphometry (VBM)1) and Voxel based analysis (VBA) methods,2) to statistically evaluate quantitative measurements of brain images and brain region volumes. A considerablenumber of studies using human standard brain images have been available. Primarily, MNI1523) has been used in imaging studies on neurodegenerative diseases and various other diseases, such as the evaluation of cerebral blood flow deficits in Parkinson’s disease4) and the distribution of stroke lesions.5) In addition, it has been used to compare brain development according to ethnicity6) and is therefore important for not only medical research but also the development of brain science. In addition, standard brain images have contributed greatly to not only human research but also basic research on experimental animals. For example, CCFv3 in mice has been used to analyze brain structures, such as in studies on neurodegeneration and gene expression due to aging.7) Alternatively, standard brain images of diverse mammals, such as cats and monkeys, for animal research have been scarce. We therefore created average brain images of diverse animal species using a unified analysis method and evaluated their quality with the aim of developing future tools for brain imaging analysis.Methods
This study included Japanese humans in their 20s (n = 13), mongrel cats (n = 5), B16 mice (n = 15), and common marmosets (n = 216). All data were obtained with the approval of the Ethics Committee or Animal Experimentation Committee. The imaging equipment and conditions used for each animal species were as follows Human: 3T magnetic resonance imaging (MRI) system (GE SIGNA Premier), CUBE method (TR, 3302 ms; TE, 157.897 ms; ETL, 130 ms), MPRAGE (TR, 2587.7 ms; TE, 3.268 ms; TI, 930 ms). Cats: 3T MRI machine (Canon Galan3T), FFE3D (TR, 6.4 ms; TE, 2.8 ms; TI, 900 ms), T2WI (TR, 13134 ms; TE, 80 ms). Mice: 9.4T MRI machine (Bruker), RARE method (TR, 1300 ms; TE, 7.77 ms). Marmosets: 9.4T MRI system (Bruker), MPRAGE method (TR, 6000 ms; TE, 2 ms), RARE method (TR, 4000 ms; TE, 22 ms). Average brain images were created from the obtained data using the antsMultivariatTemplateConstruction2 script included in the Advanced Normalization Tools8) of the segmentation toolkit. Images from cats and mice were adjusted for image center in antsRegistrationSyN.sh prior to average brain creation.Aside from average brain creation, we used marmoset data with a large number of samples to evaluate differences and errors due to variations in the number of individuals in the creation of average brain images using the two methods. The number of individuals used to create the average brain images varied (i.e., n = 2, 4, 8, 16, 32, 64, and 128). After randomly selecting individuals, average brain images were created under the same conditions described above. The maximum number of individuals was then evaluated for contrast changes in the brain tissue according to difference analysis on the images. Brain region boundaries were also analyzed using edge contrast analysis.
Results and Discussion
Average brain images were obtained for each animal species. Despite failing to obtain sufficient data in humans, high-resolution MRI revealed shortcomings in the average brain image. The complexity of the brain parenchymal shape may have affected the results. Cats and mice were distinct despite the small number of individuals due to the simplicity of their brain geometry.Analysis of the average brain images created using marmosets showed that the boundaries and contrasts of the brain parenchyma did not change significantly when the number of data exceeded 16 samples. Thus, adding additional individuals to increase accuracy would have had no effect. However, these figures are for relatively simple brain structures, such as those for marmosets, mice, and cats, suggesting the need for a separate study for complex brain structures, such as those found in humans. Therefore, the standard brain requires accurate mapping to quantify the functional and structural characteristics of the brain.9)We believe it necessary to analyze the trends for each region in each mammal.
Conclusion
The images and values obtained in this study would likely serve as a foundation for increasing the number of animals in the future. The probabilistic representation of brain structure and the development of a standard brain atlas will provide a useful database for interspecies comparisons and will serve as a basis for brain imaging analysis.Acknowledgements
This work was supported by the program for Brain Mapping by Integrated Neurotechnologies for Disease Studies from the Japan Agency for Medical Research and Development (Grant Number JP21dm0207001 to HO), Japan Society for the Promotion of Science (Grant Number JP20H03630 to JH), and “MRI platform” as a program of Project for Promoting Public Utilization of Advanced Research Infrastructure of the Ministry of Education, Culture, Sports, Science and Technology, Japan (Grant Number JPMXS0450400622).
References
1) Ashburner J, Friston KJ. Voxel-based morphometry: the methods. Neuroimage, 20002) Ashburner J. A fast diffeomorphic image registration algorithm. Neuroimage, 2007
3) JC Mazziotta, A probabilistic atlas of the human brain: theory and rationale for its development. Neuroimage, 1995
4) Jack L. Lancaster, Automated Talairach atlas labels for functional brain mapping. Human Brain Mapping, 2000
5) Yanlu Wang, Juvenile myoclonic epilepsy has hyper dynamic functional connectivity in the dorsolateral frontal cortex. Neuroimage, 2019
6) Jae Sung Lee, Development of Korean standard brain templates. Journal of Korean Medical Science, 2005
7) Anjum A.Ali., Automated segmentation of neuroanatomical structures in multispectral MR microscopy of the mouse brain. Neuroimage,2005
8) Brian B. Avants, A reproducible evaluation of ANTs similarity metric performance in brain image registration. Neuroimage, 2011
9) Elaine H Shen, The Allen Human Brain Atlas: comprehensive gene expression mapping of the human brain. Trends Neurosci, 2012
10) Suzana Herculano-Houzel, The human brain in numbers: a linearly scaled-up primate brain. Cognitive Neuroscience, 2009
Figures
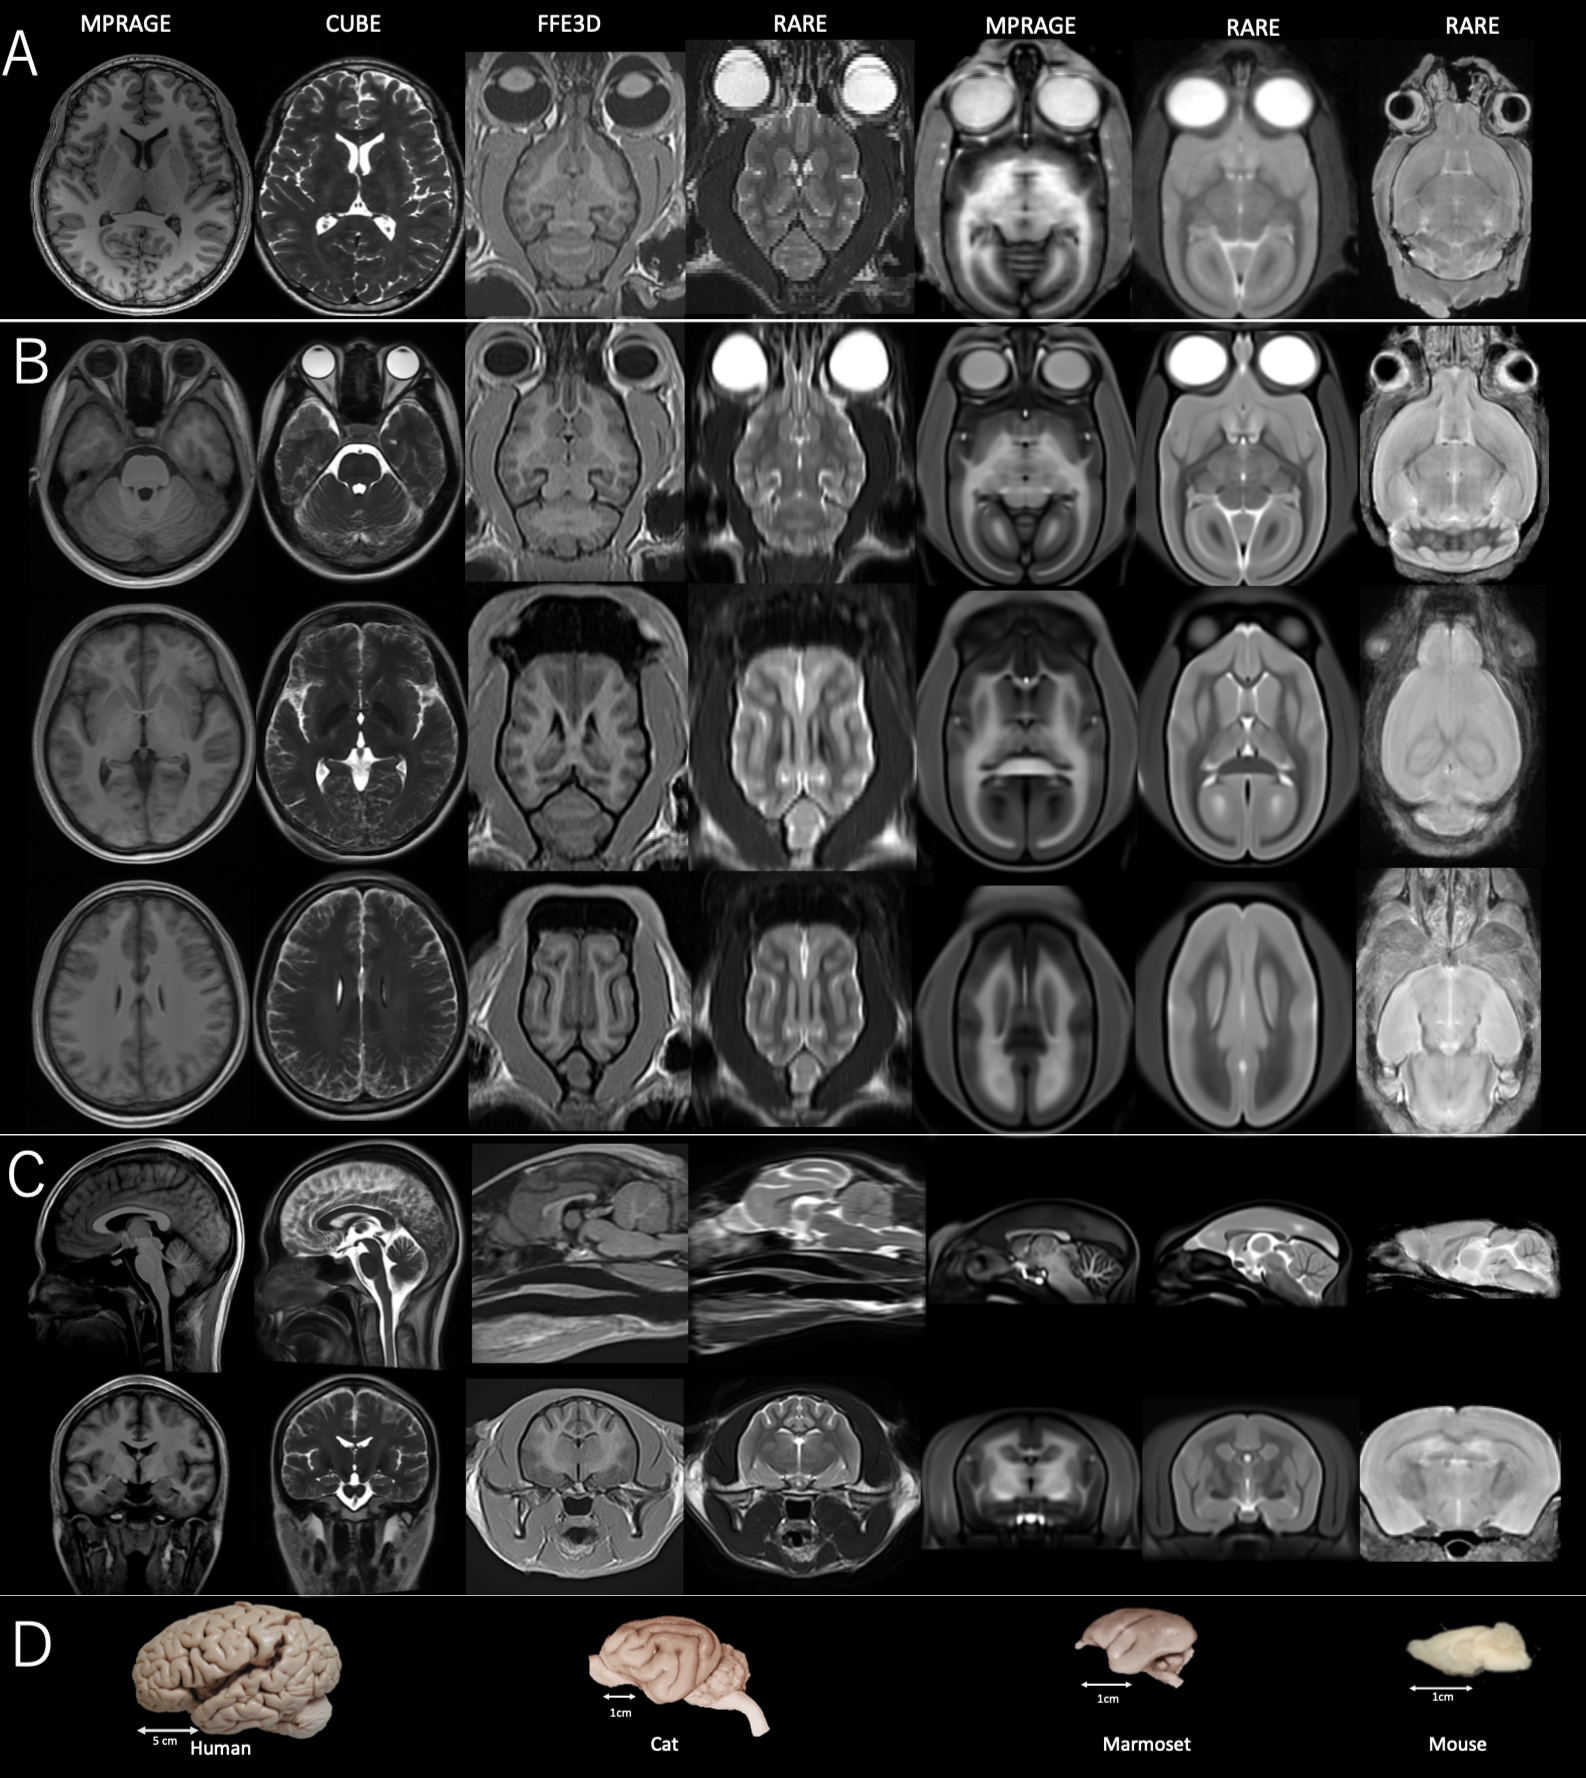
Figure 1. Average brain image of various mammals
Images for a Japanese human in their 20s (Homo sapiens, n = 13), a hybrid cat (Felis sylvestris catus, n = 5), a B16 mouse (Mus musculus, n = 15), and a common marmoset (Callithrix jacchus; hereafter marmoset, n = 216). A presents an image of one individual selected from the data, B present arbitrary axial images of the average brain, C presents a sagital image, D presents a colonal image, and E presents a real image10)(Suzana Herculano-Houzel, Cognitive Neuroscience, 2009).
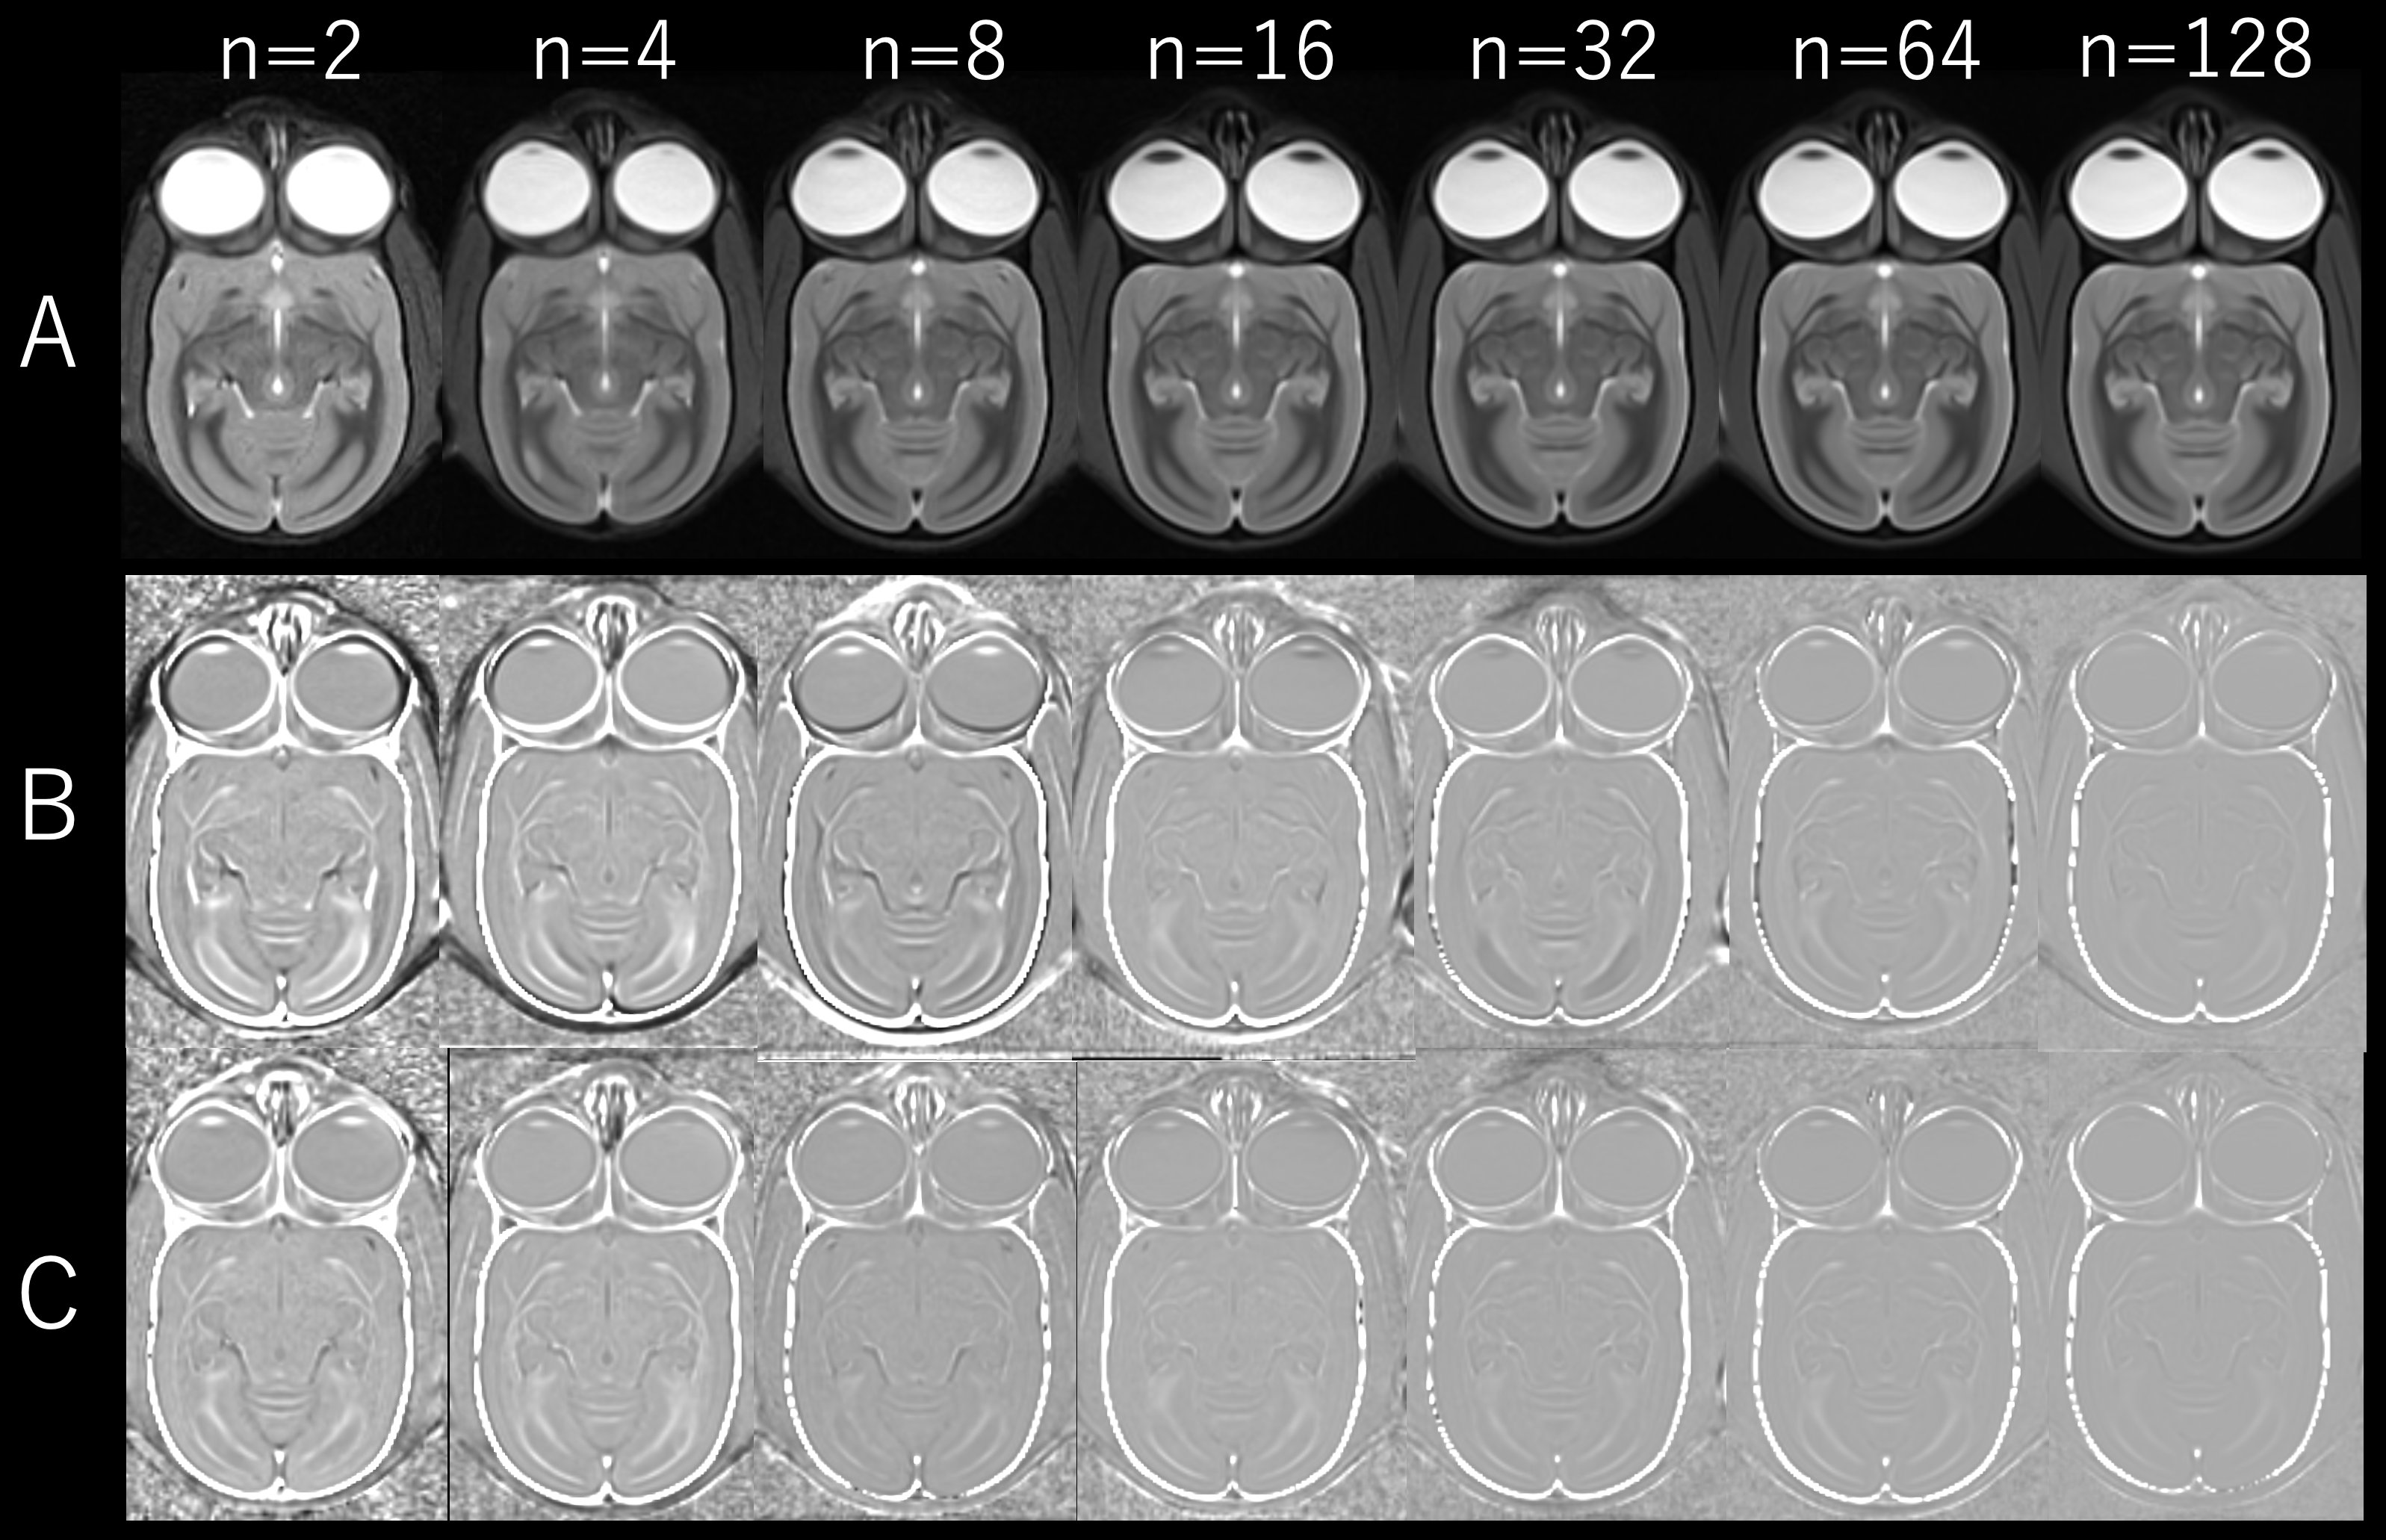
Figure 2. Average brain evaluation with different number of data
A shows the average brain images of the common marmoset with different number of data (from left to right: 2, 4, 8, 16, 32, 64, 128, etc.). B shows the processing of differences based on the average brain images created from 216 individuals with aligned head shapes and without brain shape deformation. C shows a case whereinthe head shapes were aligned using nonlinear transformation with brain shape deformation. We sought to evaluate the differences in contrast between brain regions.
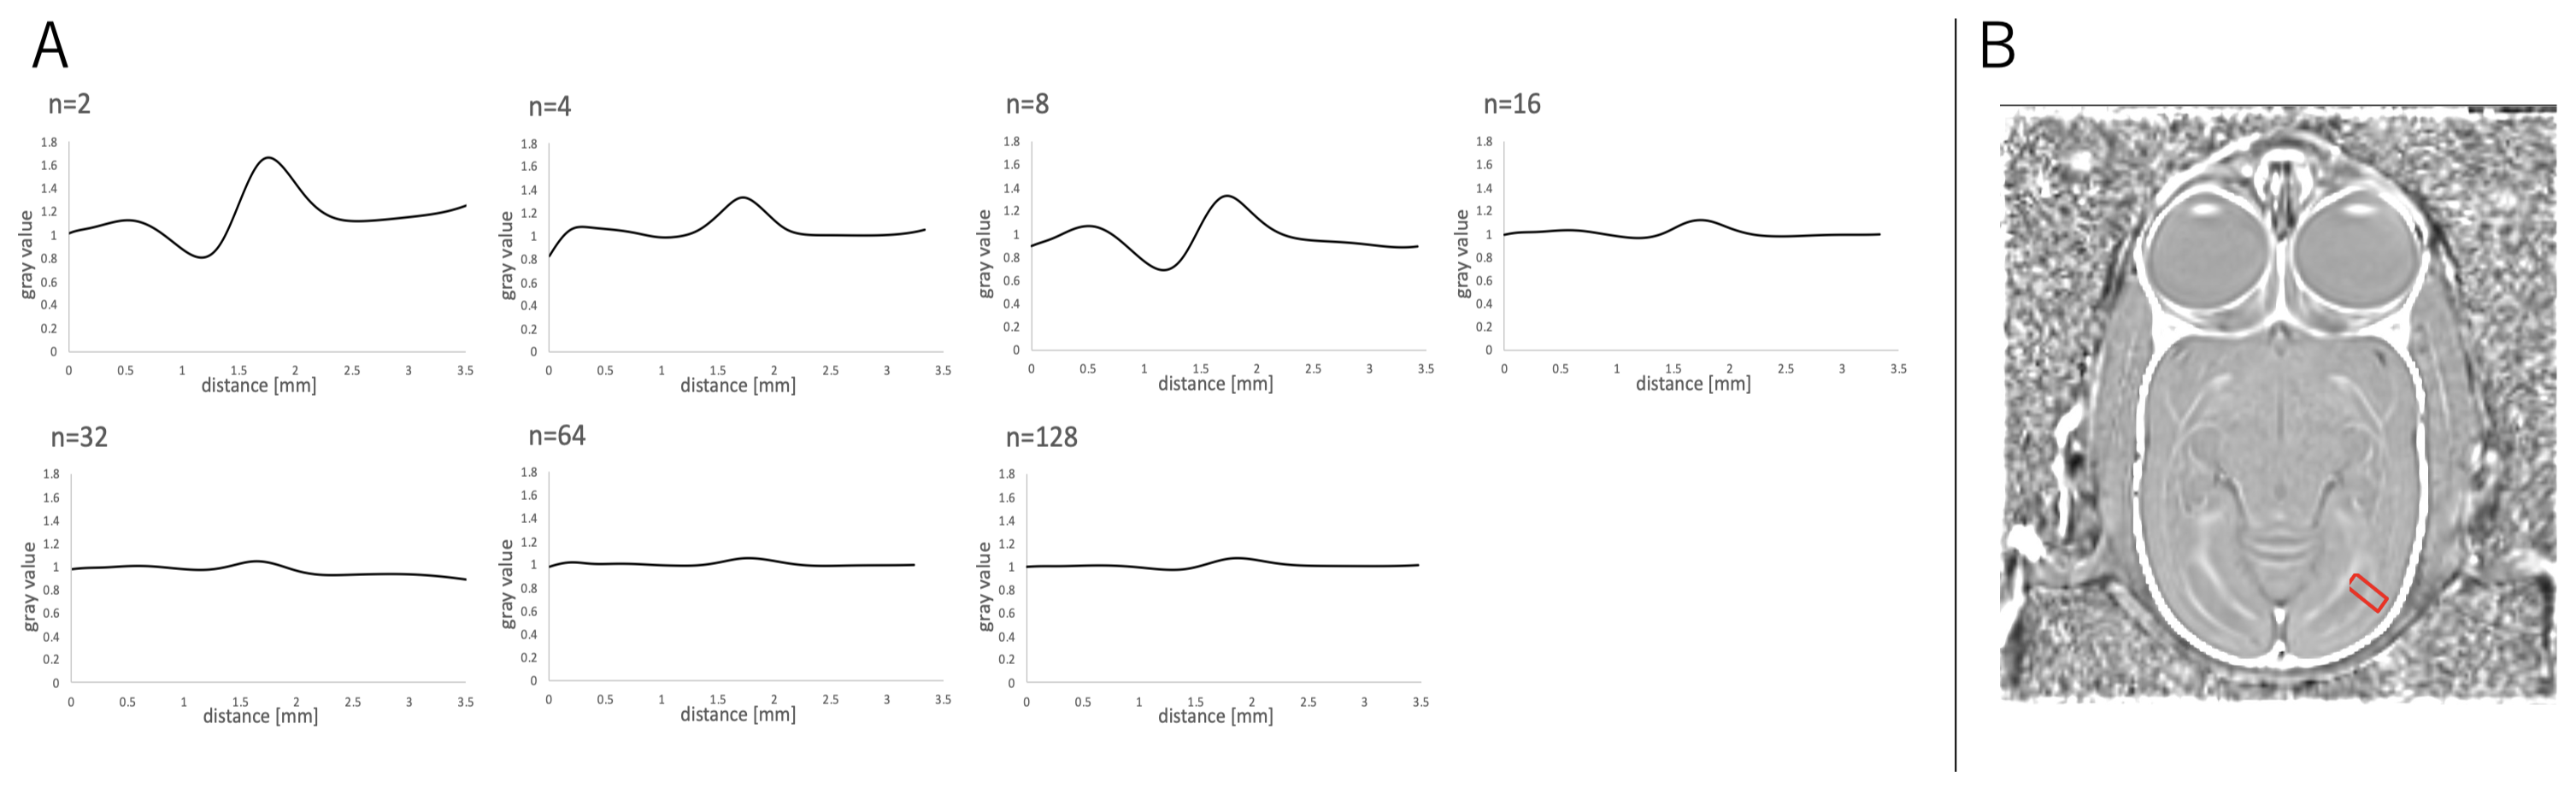
Figure 3. Evaluation of brain area boundaries in the average brain images according to the amount of data.
B narrow region of interest was defined as the outer (cortical) to inner (white matter) V1 area of the axial section obtained by differencing (B of Fig.2 ). In graph A, the vertical axis represents the change in signal intensity, whereas the horizontal axis represents the number of pixels. As the number of samples increased, the boundary deviation decreased and the plot profile became flatter.
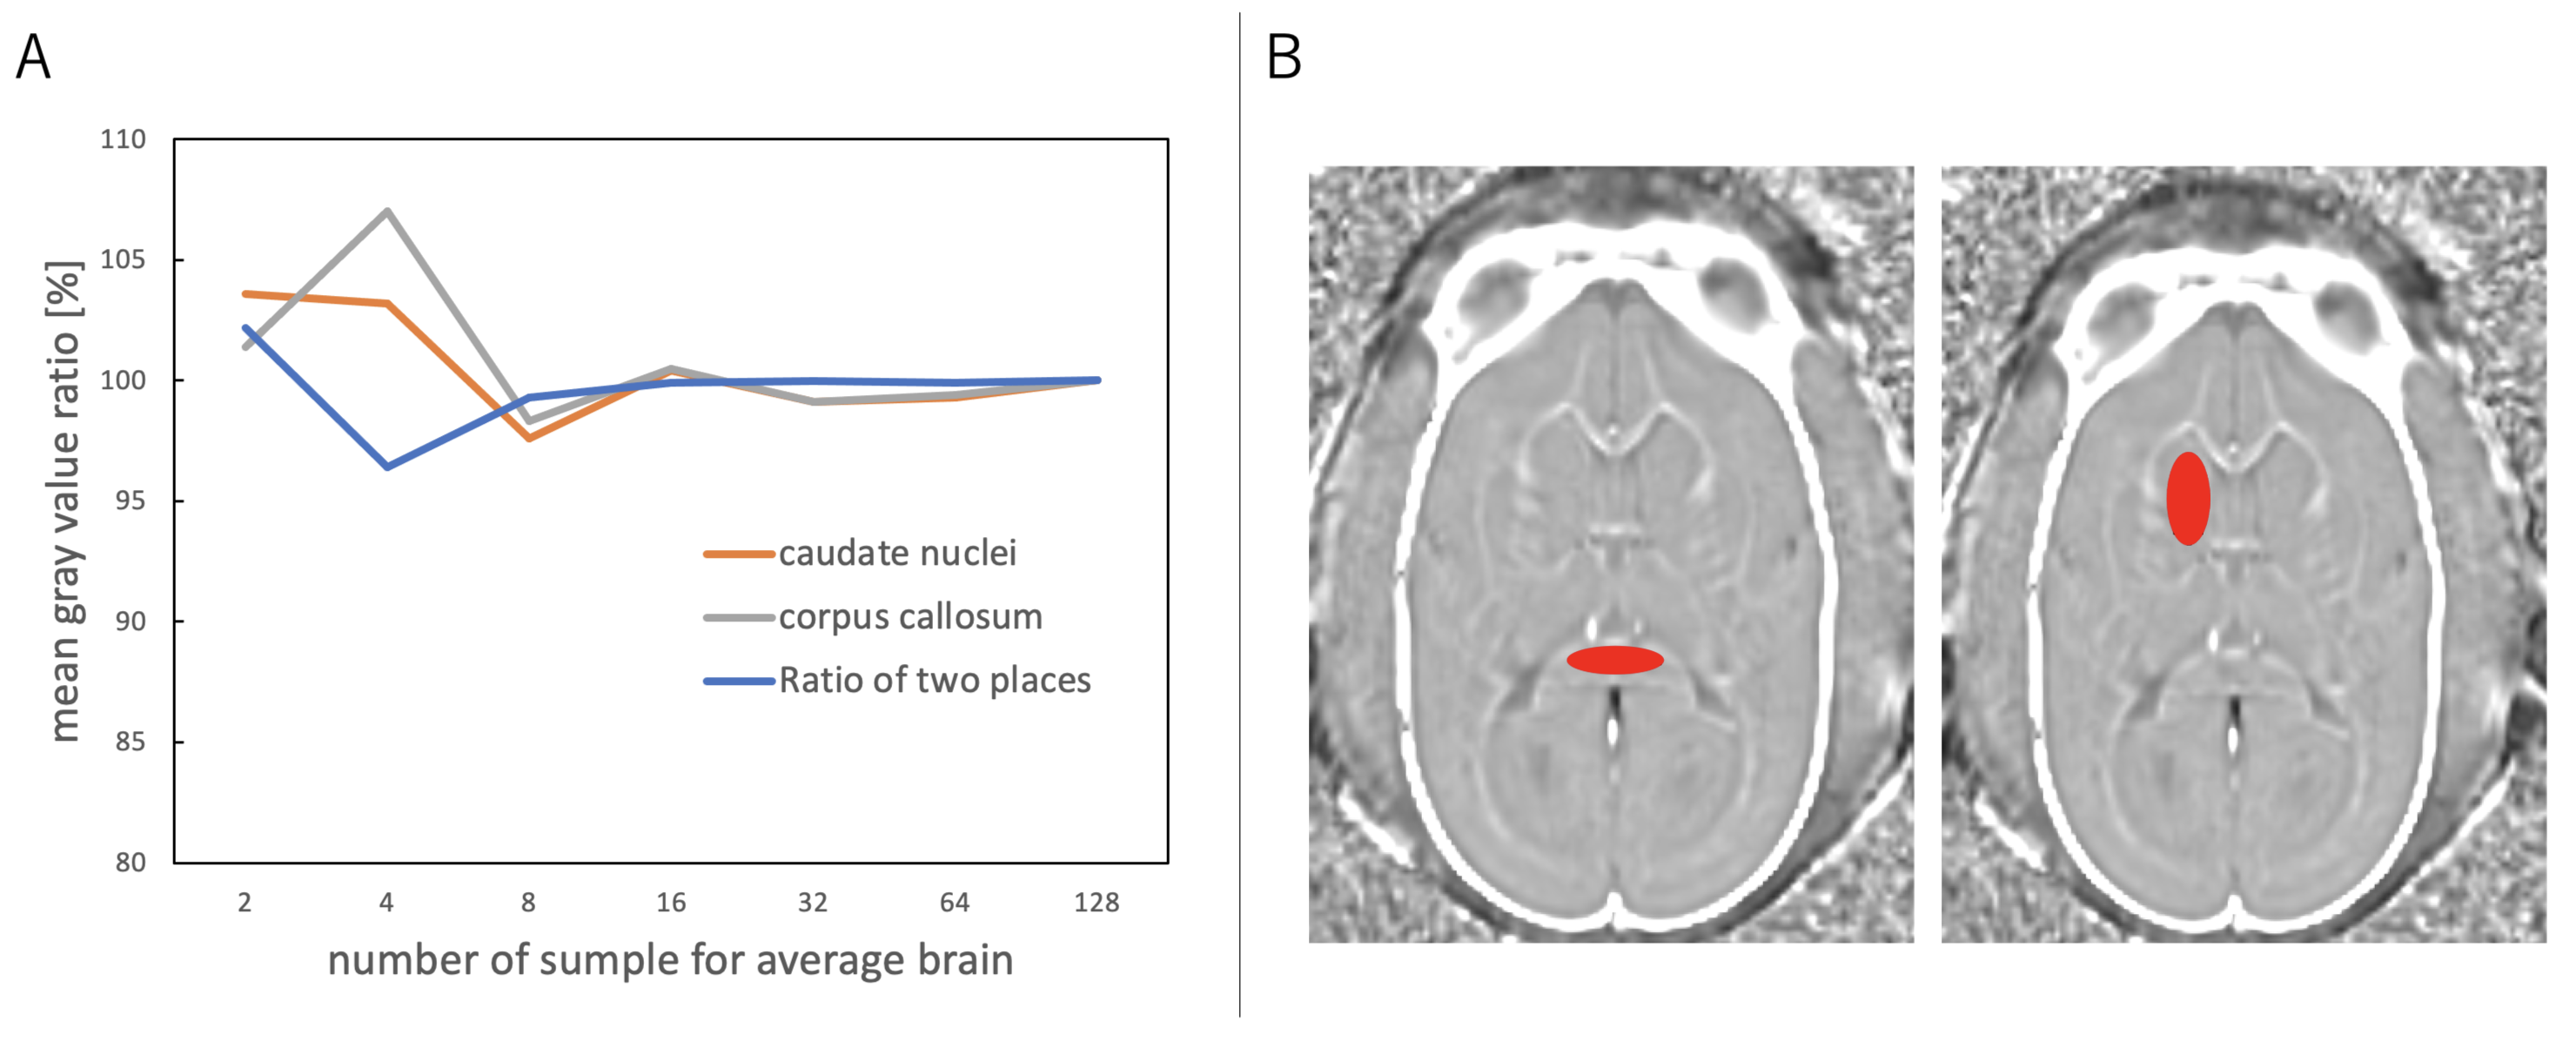
Figure 4. Evaluation of brain contrast in the average brain image with different number of data. Contrast differences between regions in the average brain image for different numbers of samples were examined.
Region of interests were set in the corpus callosum and caudate nucleus. Percentage change and mean of each were graphed. Percent change was calculated by taking the value of the average brain image (n = 128) as 100% (A). The region of interest was defined as the area of the corpus callosum, and the obtained values are plotted graphically (B).