4127
Development of a dynamic contrast-enhanced MRI based acquisition and analysis method for investigating the glymphatic system in rats1Bayer AG, Berlin, Germany
Synopsis
Keywords: Neurofluids, Neurofluids, Glymphatic System
Motivation: The glymphatic system’s role in metabolic waste removal in the brain is crucial. Impairment of the flow of cerebrospinal fluid (CSF) and interstitial fluid (ISF) has been linked to several neurological conditions.
Goal(s): Our aim is to develop a method combining contrast media administration, MRI, and postprocessing for detailed study of the glymphatic system in rats.
Approach: We investigated how administration routes with various invasiveness effect the distribution of contrast agent (CA) in the healthy rat brain and compared different data analysis methods.
Results: Only cisterna magna application showed satisfying results. Time series cluster analysis shows patterns in the contrast agent distribution dynamic.
Impact: A reliable MRI-based method for investigating the glymphatic system in rats will allow for the study of its role in several neurodegenerative and other diseases.
Introduction
The glymphatic system, comprising the flow of cerebrospinal fluid (CSF) and interstitial fluid (ISF), plays an important role in the removal of metabolic waste from the brain. It is altered in neurodegenerative diseases, in the presence of glioblastoma and in other pathologies1,2. Dynamic contrast-enhanced MRI (DCE-MRI) is suitable for visualizing the glymphatic system. However, we suspect that CA administration, MRI acquisition and analysis of the imaging data has a big impact on the CA distribution and the informative value of the resulting images. In a pilot study we investigated in healthy rats how three different CA administration routes, which involve different levels of invasiveness, effect the distribution of contrast media in the brain. We furthermore demonstrate different methods of quantitative analysis and clustering of the acquired time series imaging data.Methods
Nine Han-wistar rats were used in this study. Three different administration routes (three animals each) of gadobutrol contrast agent were used: Infusion into the cisterna magna (ICM, only available in terminal experiments), Infusion into the subarachnoid space (ISS, less invasive, available for longitudinal studies) and intravenous injection (IV, least invasive). For ICM and ISS, 0.5 µmol gadobutrol, dissolved in artificial CSF (total volume 20µl) was infused over 20 min via a small catheter, either through a hole in the skull into the subarachnoid space or via cisterna magna cannulation3. For IV bolus injection via the tail vein, 0.5 µmol gabobutrol was used. Animals were imaged using a 2D FLASH sequence for up to 3h after CA administration in a 4.7T MRI Scanner (Bruker BioSpin). Axial and sagittal acquisitions were interleaved. Animals were anesthetized with Xylazin and Ketamin and euthanized after the acquisition. ISS infusion could not be done inside the MRI scanner, because the delicate catheter positioning would have been corrupted. Instead, subarachnoid infusions and subsequent closing of the access was performed outside of the scanner. Consequently, the first image could only be acquired around 30 minutes after the start of ISS infusion. For the other two administration routes, the CA was given inside the MRI scanner, after the acquisition of native images.The images were registered using affine registration4. For each voxel, an enhancement time series was generated by subtracting the first images’ signal intensity from the subsequent intensities. K-means clustering was performed using a Euclidean metric with tslearn5 for python. The elbow method was used to find the number of clusters. Furthermore, from the acquired and registered MR images, time to peak (TTP) and temporal maximum intensity projection (MIP) maps were calculated.
Results
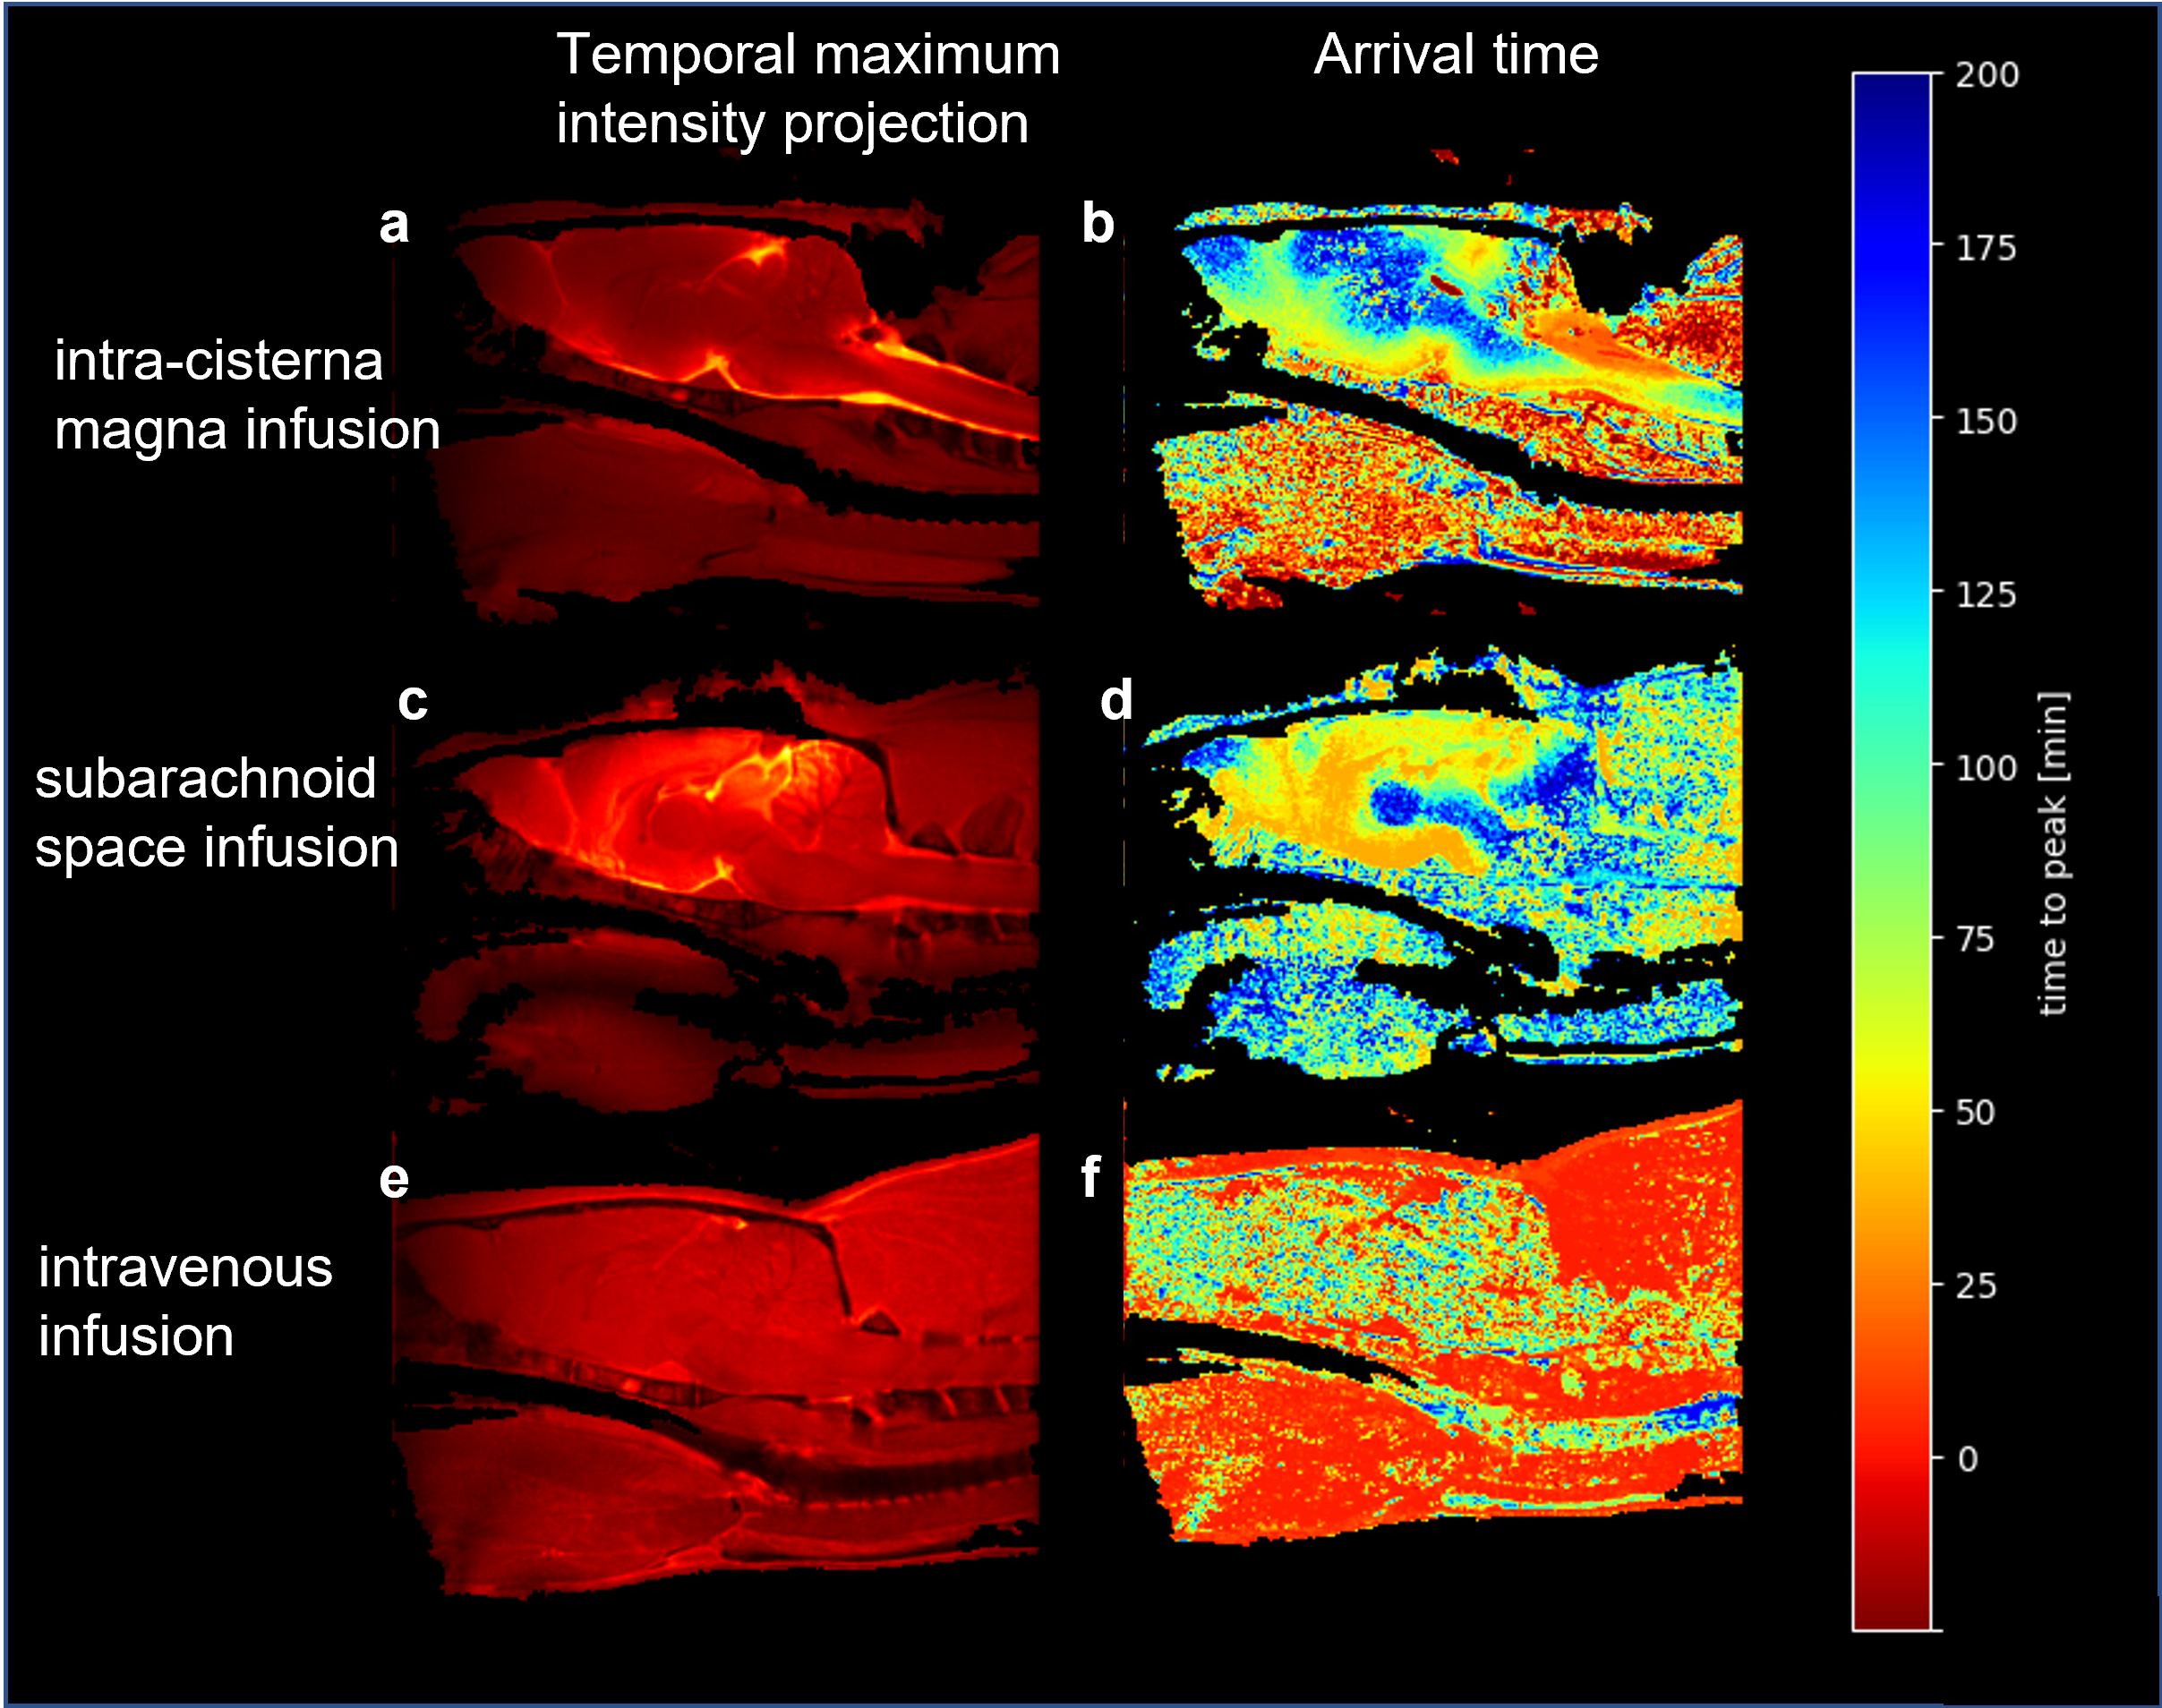
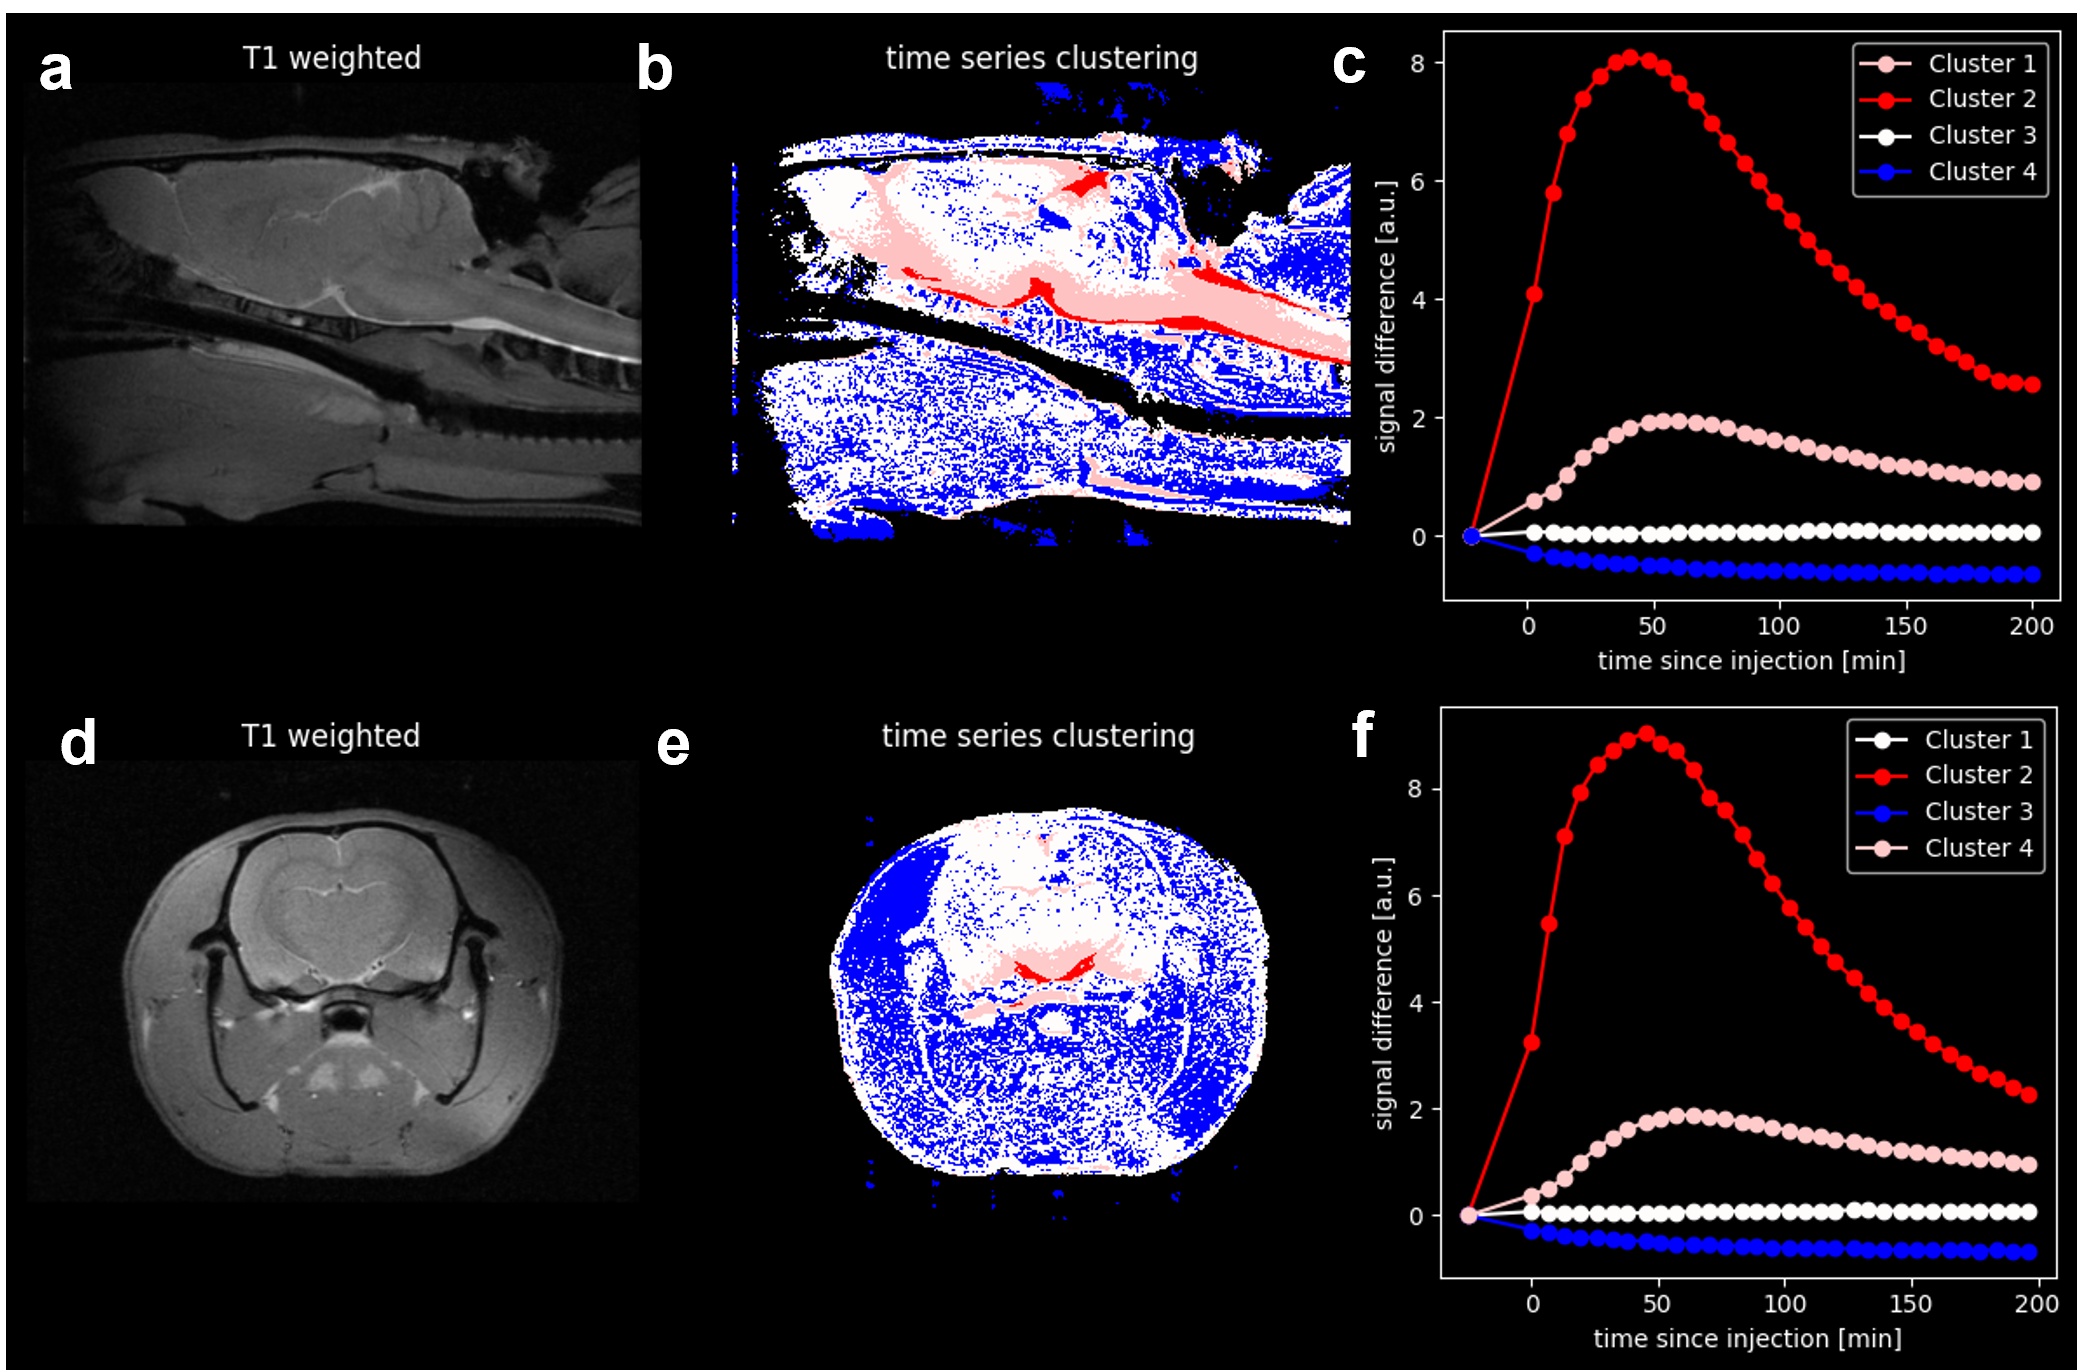
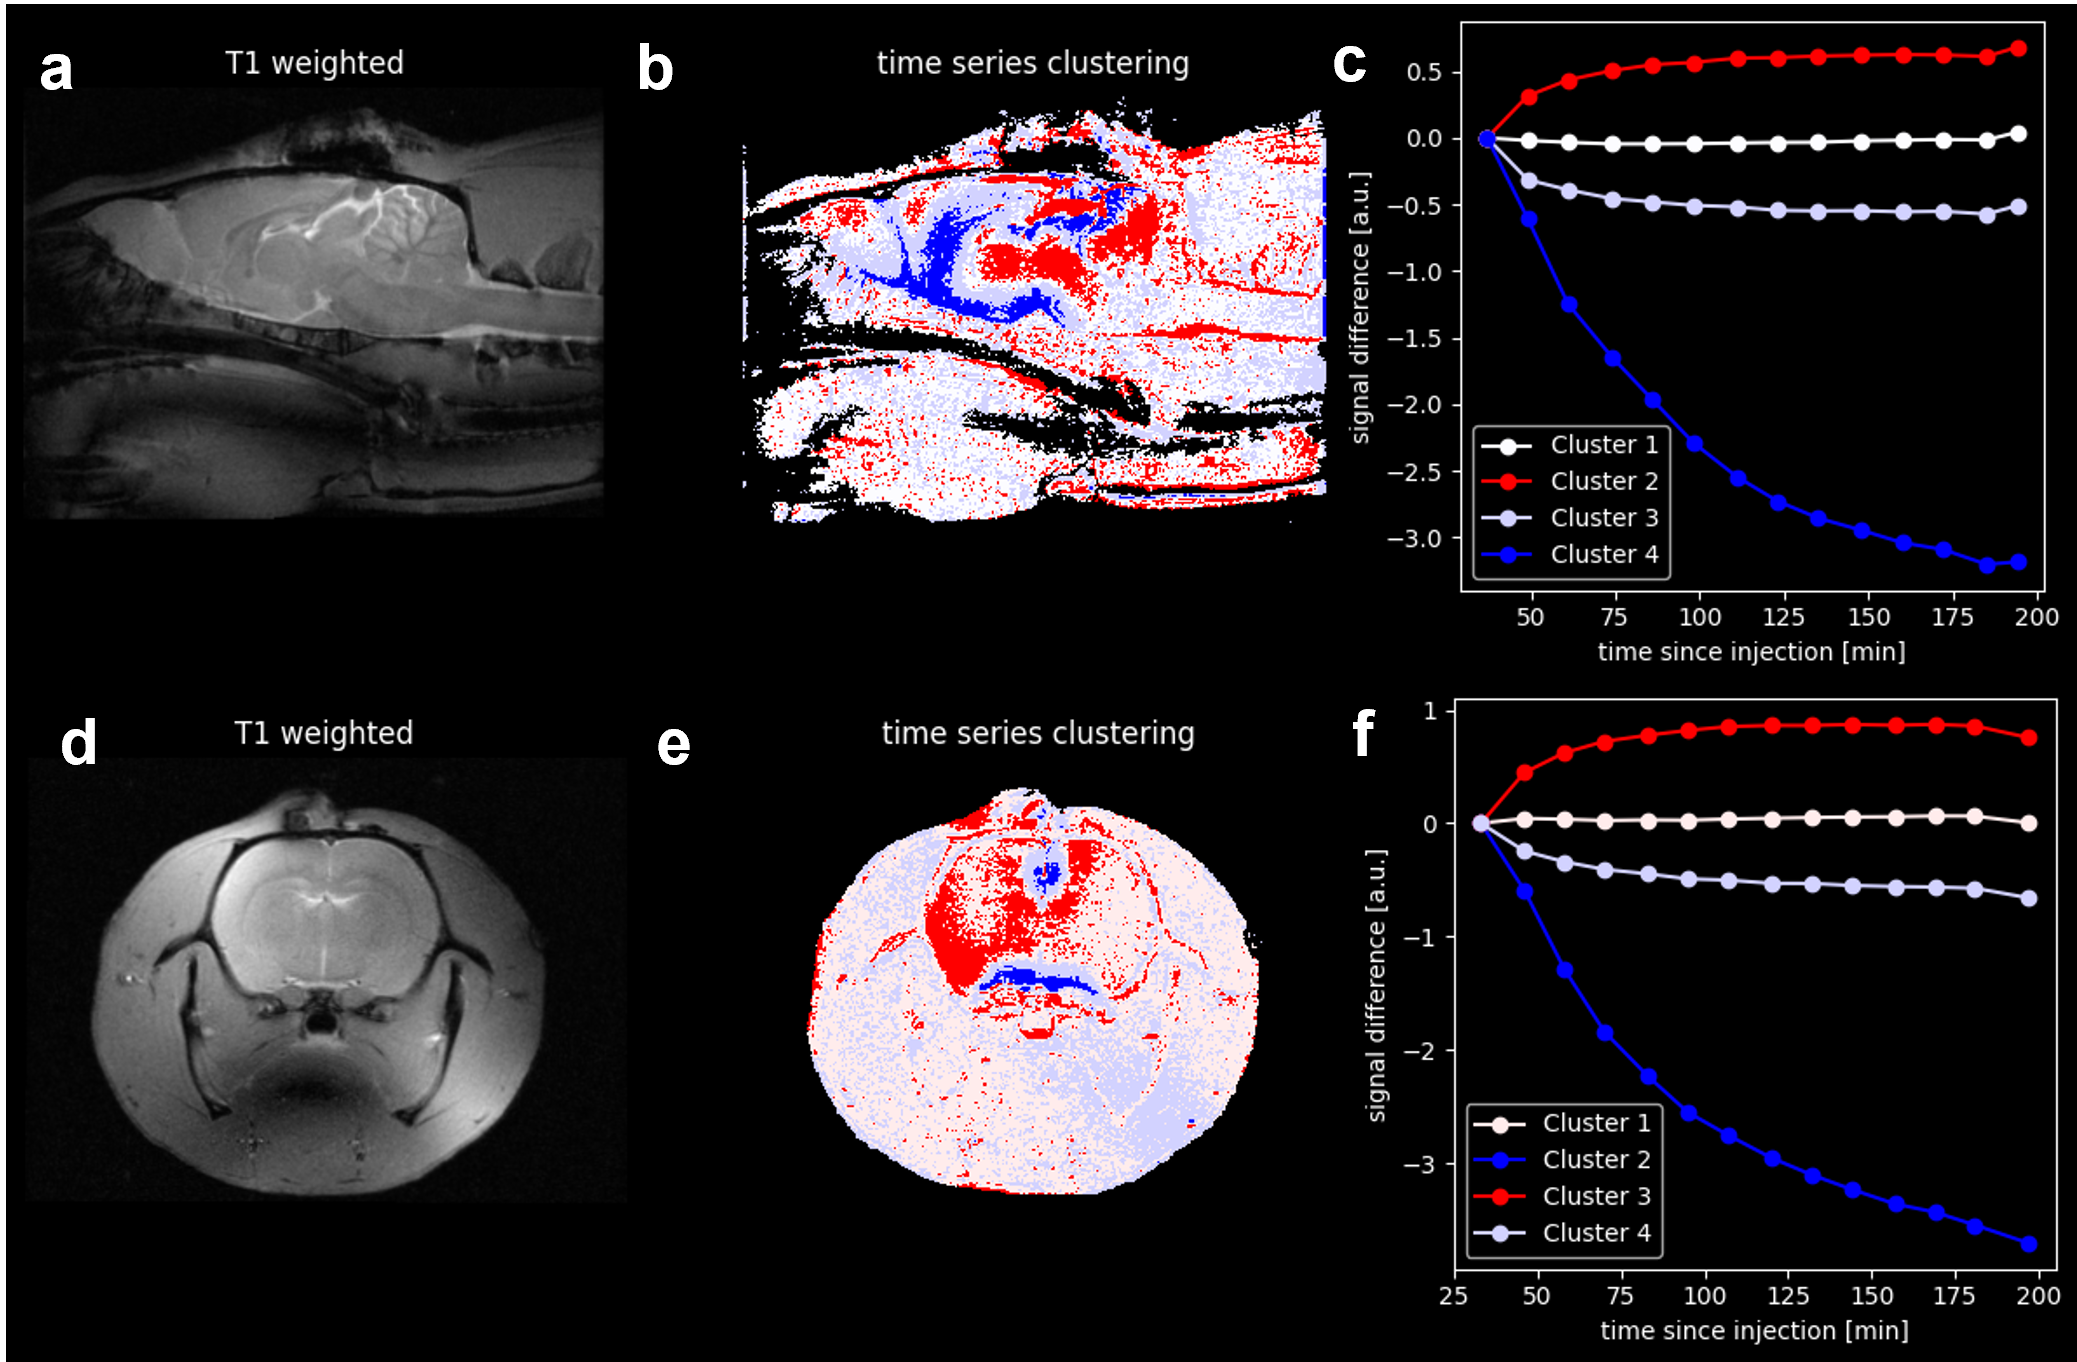
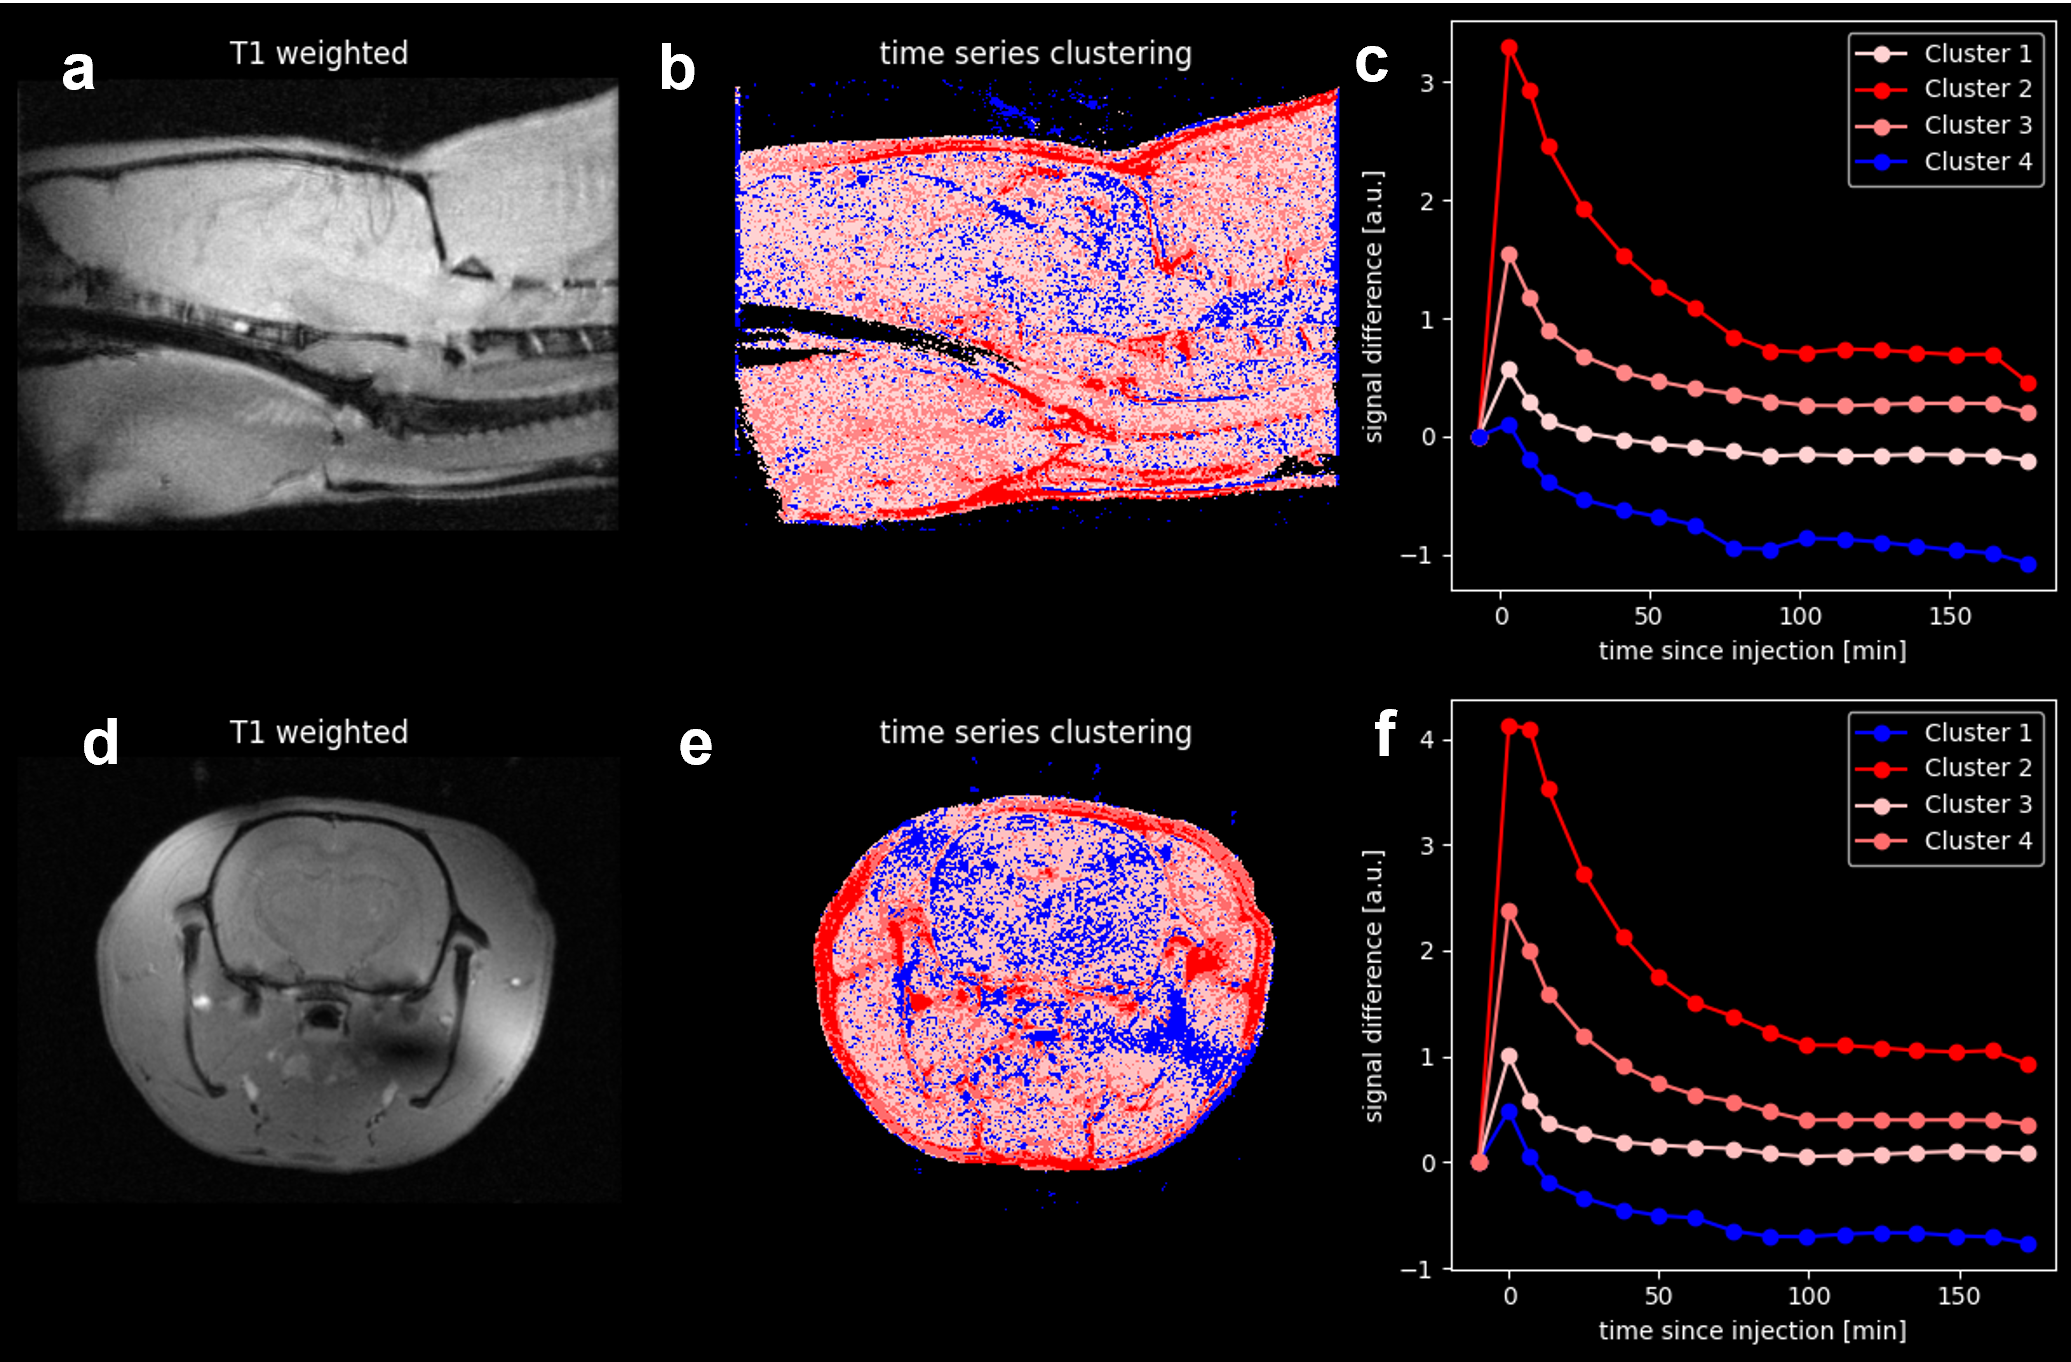
ISS infusion resulted in persistent, concentrated signal enhancements in the neocortex, and in deeper brain regions adjacent to the injection channel. ICM injection resulted in a differentiated signal enhancement in the whole brain. TTP maps (Fig.1) show, that for regions further away from the injection point the contrast arrival time becomes similar following ISS and ICM infusion. In a ROI in the olfactory bulb, the median time to peak after cisterna magna injection was 165 min and after subarachnoid injection 170 min (each value is the median of the mean value in the three rats). Following IV injection, no enhancement of the brain parenchyma could be observed once the initial vascular enhancement had vanished (Fig.1).With time series cluster analysis, regions with similar contrast dynamics were identified (Fig.2,3 and 4). For ISS infusion the early time points were missing due to the experimental circumstances, but nevertheless late signal enhancement in regions deep in the brain could be observed, similar to the late enhancement seen after ICM infusion (Fig.2 and 3). Clustering the IV injection signal intensities show that the maximum in different brain regions is reached shortly after injection, only the signal magnitude is varying, which is probably due varying vascular density (Fig.4).
Discussion
We saw late signal enhancement in the ISS and ICM infusion images that show glymphatic transport deep into the brain parenchyma. Unlike what is described in a DCE MRI study6 of the human glymphatic system, we could not observe glymphatic system activity following IV injection in the rats.Conclusion
Contrast agent infusion via the cisterna magna is the preferred application route for glymphatic system DCE-MRI in rats, because it shows enhancement deep in the brain parenchyma and the CA infusion itself does not show up in the brain as a hyperintense region as in subarachnoid infusion images. Time series clustering in combination with arrival time maps gave a complete picture of the flow of the CSF without the need to manually draw ROIs in the imaging data.Acknowledgements
The authors thank Robert Ivkic and Huyen Anh Nguyen for their motivation, excellent work, and technical assistance.References
1. Jessen, N. A., Munk, A. S. F., Lundgaard, I. & Nedergaard, M. The Glymphatic System: A Beginner’s Guide. Neurochem Res 40, 2583–2599 (2015).
2. Kaur, J. et al. Imaging glymphatic response to glioblastoma. Cancer Imaging 23, 107 (2023).
3. Ramos, M. et al. Cisterna Magna Injection in Rats to Study Glymphatic Function. in Astrocytes: Methods and Protocols (ed. Di Benedetto, B.) 97–104 (Springer, 2019).
4. Avants, B., Tustison, N. & Song, G. Advanced normalization tools (ANTS). Insight J 1–35, (2008).
5. Tavenard, R. et al. Tslearn, A Machine Learning Toolkit for Time Series Data. Journal of Machine Learning Research 21, 1–6 (2020).
6. Richmond, S. B. et al. Quantification approaches for magnetic resonance imaging following intravenous gadolinium injection: A window into brain-wide glymphatic function. European Journal of Neuroscience 57, 1689–1704 (2023).
Figures