4120
Application of zero-echo time pulse sequence for functional MRI.
Ayako Imamura1,2,3, Rikita Araki4, Yukari Takahashi3, Koichi Miyatake2, Fusao Kato3, Sakiko Honjoh2, and Tomokazu Tsurugizawa5,6
1Ph. D. Program in Humanics, University of Tsukuba, Tsukuba, Japan, 2International Institute for Integrative Sleep Medicine (WPI-IIIS), Tsukuba, Japan, 3Department of Neuroscience, The Jikei University School of Medicine, Tokyo, Japan, 4Bruker Japan K.K., Yokohama, Japan, 5Human Informatics and Interaction Research Institute, National Institute of Advanced Industrial Science and Technology (AIST), Tsukuba, Japan, 6Faculty of Engineering, University of Tsukuba, Tsukuba, Japan
1Ph. D. Program in Humanics, University of Tsukuba, Tsukuba, Japan, 2International Institute for Integrative Sleep Medicine (WPI-IIIS), Tsukuba, Japan, 3Department of Neuroscience, The Jikei University School of Medicine, Tokyo, Japan, 4Bruker Japan K.K., Yokohama, Japan, 5Human Informatics and Interaction Research Institute, National Institute of Advanced Industrial Science and Technology (AIST), Tsukuba, Japan, 6Faculty of Engineering, University of Tsukuba, Tsukuba, Japan
Synopsis
Keywords: Small Animals, Preclinical
Motivation: Zero-echo time (ZTE) sequence reduces susceptibility artifacts compared to echo planar imaging (EPI). However, the feasibility of ZTE for functional MRI (fMRI) has not been fully investigated.
Goal(s): Our goal was to assess the feasibility of ZTE for fMRI.
Approach: Time-course of ZTE, gradient echo (GE)-EPI, and spin echo (SE)-EPI signal changes by somatosensory stimulation was investigated. The functional connectivity in resting state ZTE, GE-EPI, SE-EPI was also compared.
Results: The results indicate that ZTE is useful for fMRI.
Impact: ZTE sequences realize the fMRI that is robust to susceptibility artifacts.
Introduction
The functional magnetic resonance imaging (fMRI) is essential for functional brain imaging in neuroscience. However, when using echo planar imaging (EPI), which is widely used in conventional fMRI studies, the researchers sometimes suffer from the susceptibility artifact1. MB-SWIFT2,3 and zero-echo time (ZTE)4 sequences show a remarkable reduction in sensitivity to magnetic susceptibility artifacts, motion-induced artifacts, and acoustic noise in rats and humans compared with EPI sequence. However, the feasibility of ZTE for fMRI has not been fully investigated. In this study, we assessed the feasibility of the ZTE sequence for fMRI in mice with conditions: neuronal activation in the somatosensory cortex by hind paw electrical stimulation and resting state.Methods
Animals17 C57BL/6J male mice (12 weeks or older) were allocated for the experiments: 5 for hindpaw electrical stimulation, 12 for resting state MRI. Mice were maintained in a temperature-controlled (36 degree) environment on a 12h/12h light/dark cycle. Protocols were approved by the institutional animal care and use committee in Jikei Medical School of medicine and in National Institute of Advanced Industrial Science and Technology.
fMRI experiment
The MRI experiments were conducted on a Bruker 9.4T scanner with a cryoprobe. Mice were anesthetized with medetomidine (0.05 mg/kg/h, i.p.) and with 0.5% isoflurane. The fMRI images with gradient-echo (GE-EPI) sequence were acquired with the following parameters, TR/TE = 3000/19 ms, spatial resolution = 150 x 150 x 500 μm3 / voxel. A spin-echo (SE-EPI) acquisition was performed with TR/TE = 3000/20 ms, spatial resolution = 150 x 150 x 500 μm3 / voxel. fMRI images with ZTE sequence were acquired with the following parameters, TR = 3000 ms, flip angle = 1 (ZTE-1) or 5 degrees (ZTE-5), spatial resolution = 234 x 234 x 500 μm3 / voxel. Resting state acquisition was performed for 15 min (300 volumes). For hindpaw electrical stimulation, the rectangle pulses with 0.3 ms duration, 2 mA current, and 10 Hz were applied five times for 15 s, separated by 45 s intervals.
Image processing
The preprocessing, involving the slice timing correction, spatial realignment, normalization, and smoothing were performed by SPM12. Resting state MRI images were then regressed out of averaged signals in the cerebrospinal fluid, the white matter, and the six head motion parameters. Detrending and temporal filtering (0.008 – 0.08 Hz) were then performed using CONN toolbox. Independent component analysis (ICA) was performed to extract the functional connectivity. The time-course of signal changes by hindpaw electrical stimuli within primary hindpaw somatosensory cortex was calculated by the original program.
Results & Discussion
The ZTE shows less image distortion and susceptibility artifacts (Figure. 1). The spatial signal-to-noise (SNR) ratio temporal SNR in the cortex of ZTE were significantly higher than SE-EPI and GE-EPI (Figure. 2). ICA shows the typical functional connectivity, such as default mode network (DMN), which is anterior-posterior connectivity along the axis of the cingulate and retrosplenial cortices, lateral cortical network (LCN), and bilateral secondary somatosensory cortex network (S2) in GE-EPI, SE-EPI, ZTE-1, and ZTE-5 (Figure.3). The hindpaw stimulation evoked positive signal changes in ZTE-5 and GE-EPI, while it evoked weak negative signal changes in ZTE-1 (figure.4). These results optimize the feasibility of ZTE-5 for the resting state and task-based fMRI. The ZTE is useful as a robust fMRI for magnetic susceptibility.Acknowledgements
No acknowledgment was found.References
- In, Myung-Ho, et al. "Correction of metal-induced susceptibility artifacts for functional MRI during deep brain stimulation." NeuroImage 158 (2017): 26-36.
- Lehto, Lauri J., et al. "MB-SWIFT functional MRI during deep brain stimulation in rats." Neuroimage 159 (2017): 443-448.
- Paasonen, Jaakko, et al. "Multi-band SWIFT enables quiet and artefact-free EEG-fMRI and awake fMRI studies in rat." NeuroImage 206 (2020): 116338.
- Ljungberg, Emil, et al. "Silent zero TE MR neuroimaging: Current state-of-the-art and future directions." Progress in Nuclear Magnetic Resonance Spectroscopy 123 (2021): 73-93.
Figures
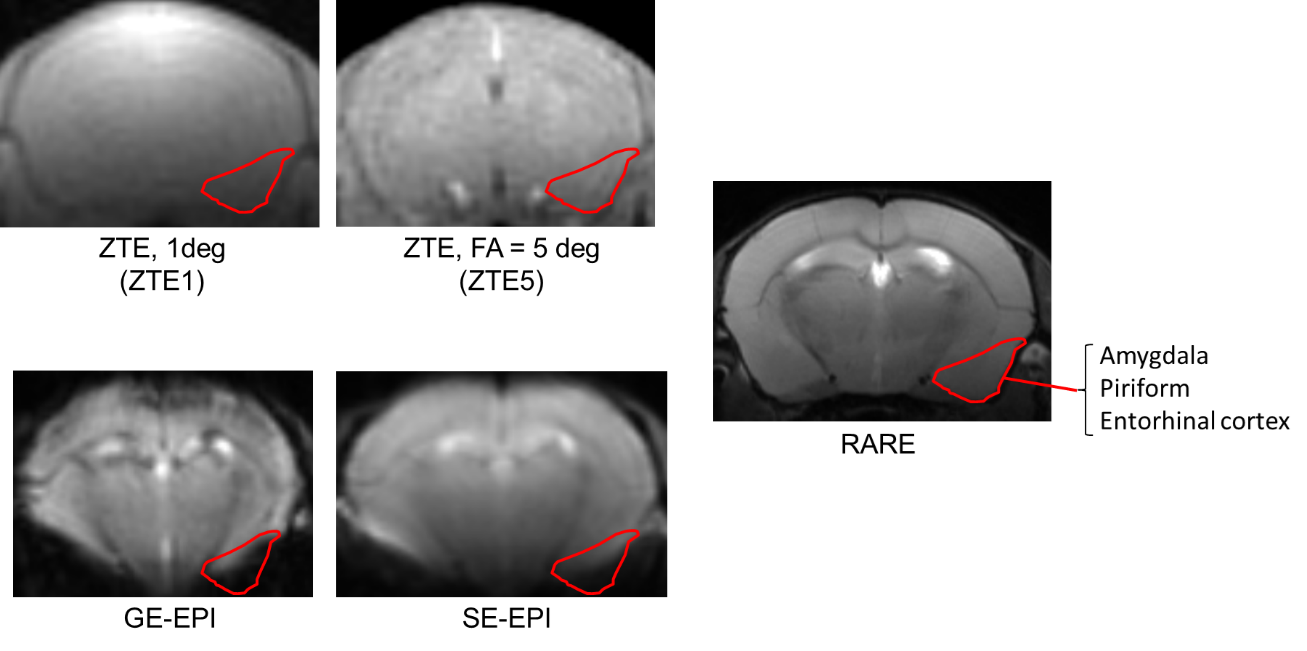
Representative images of GE-EPI, SE-EPI, ZTE-1, and ZTE-5, and
T2-weighted RARE.
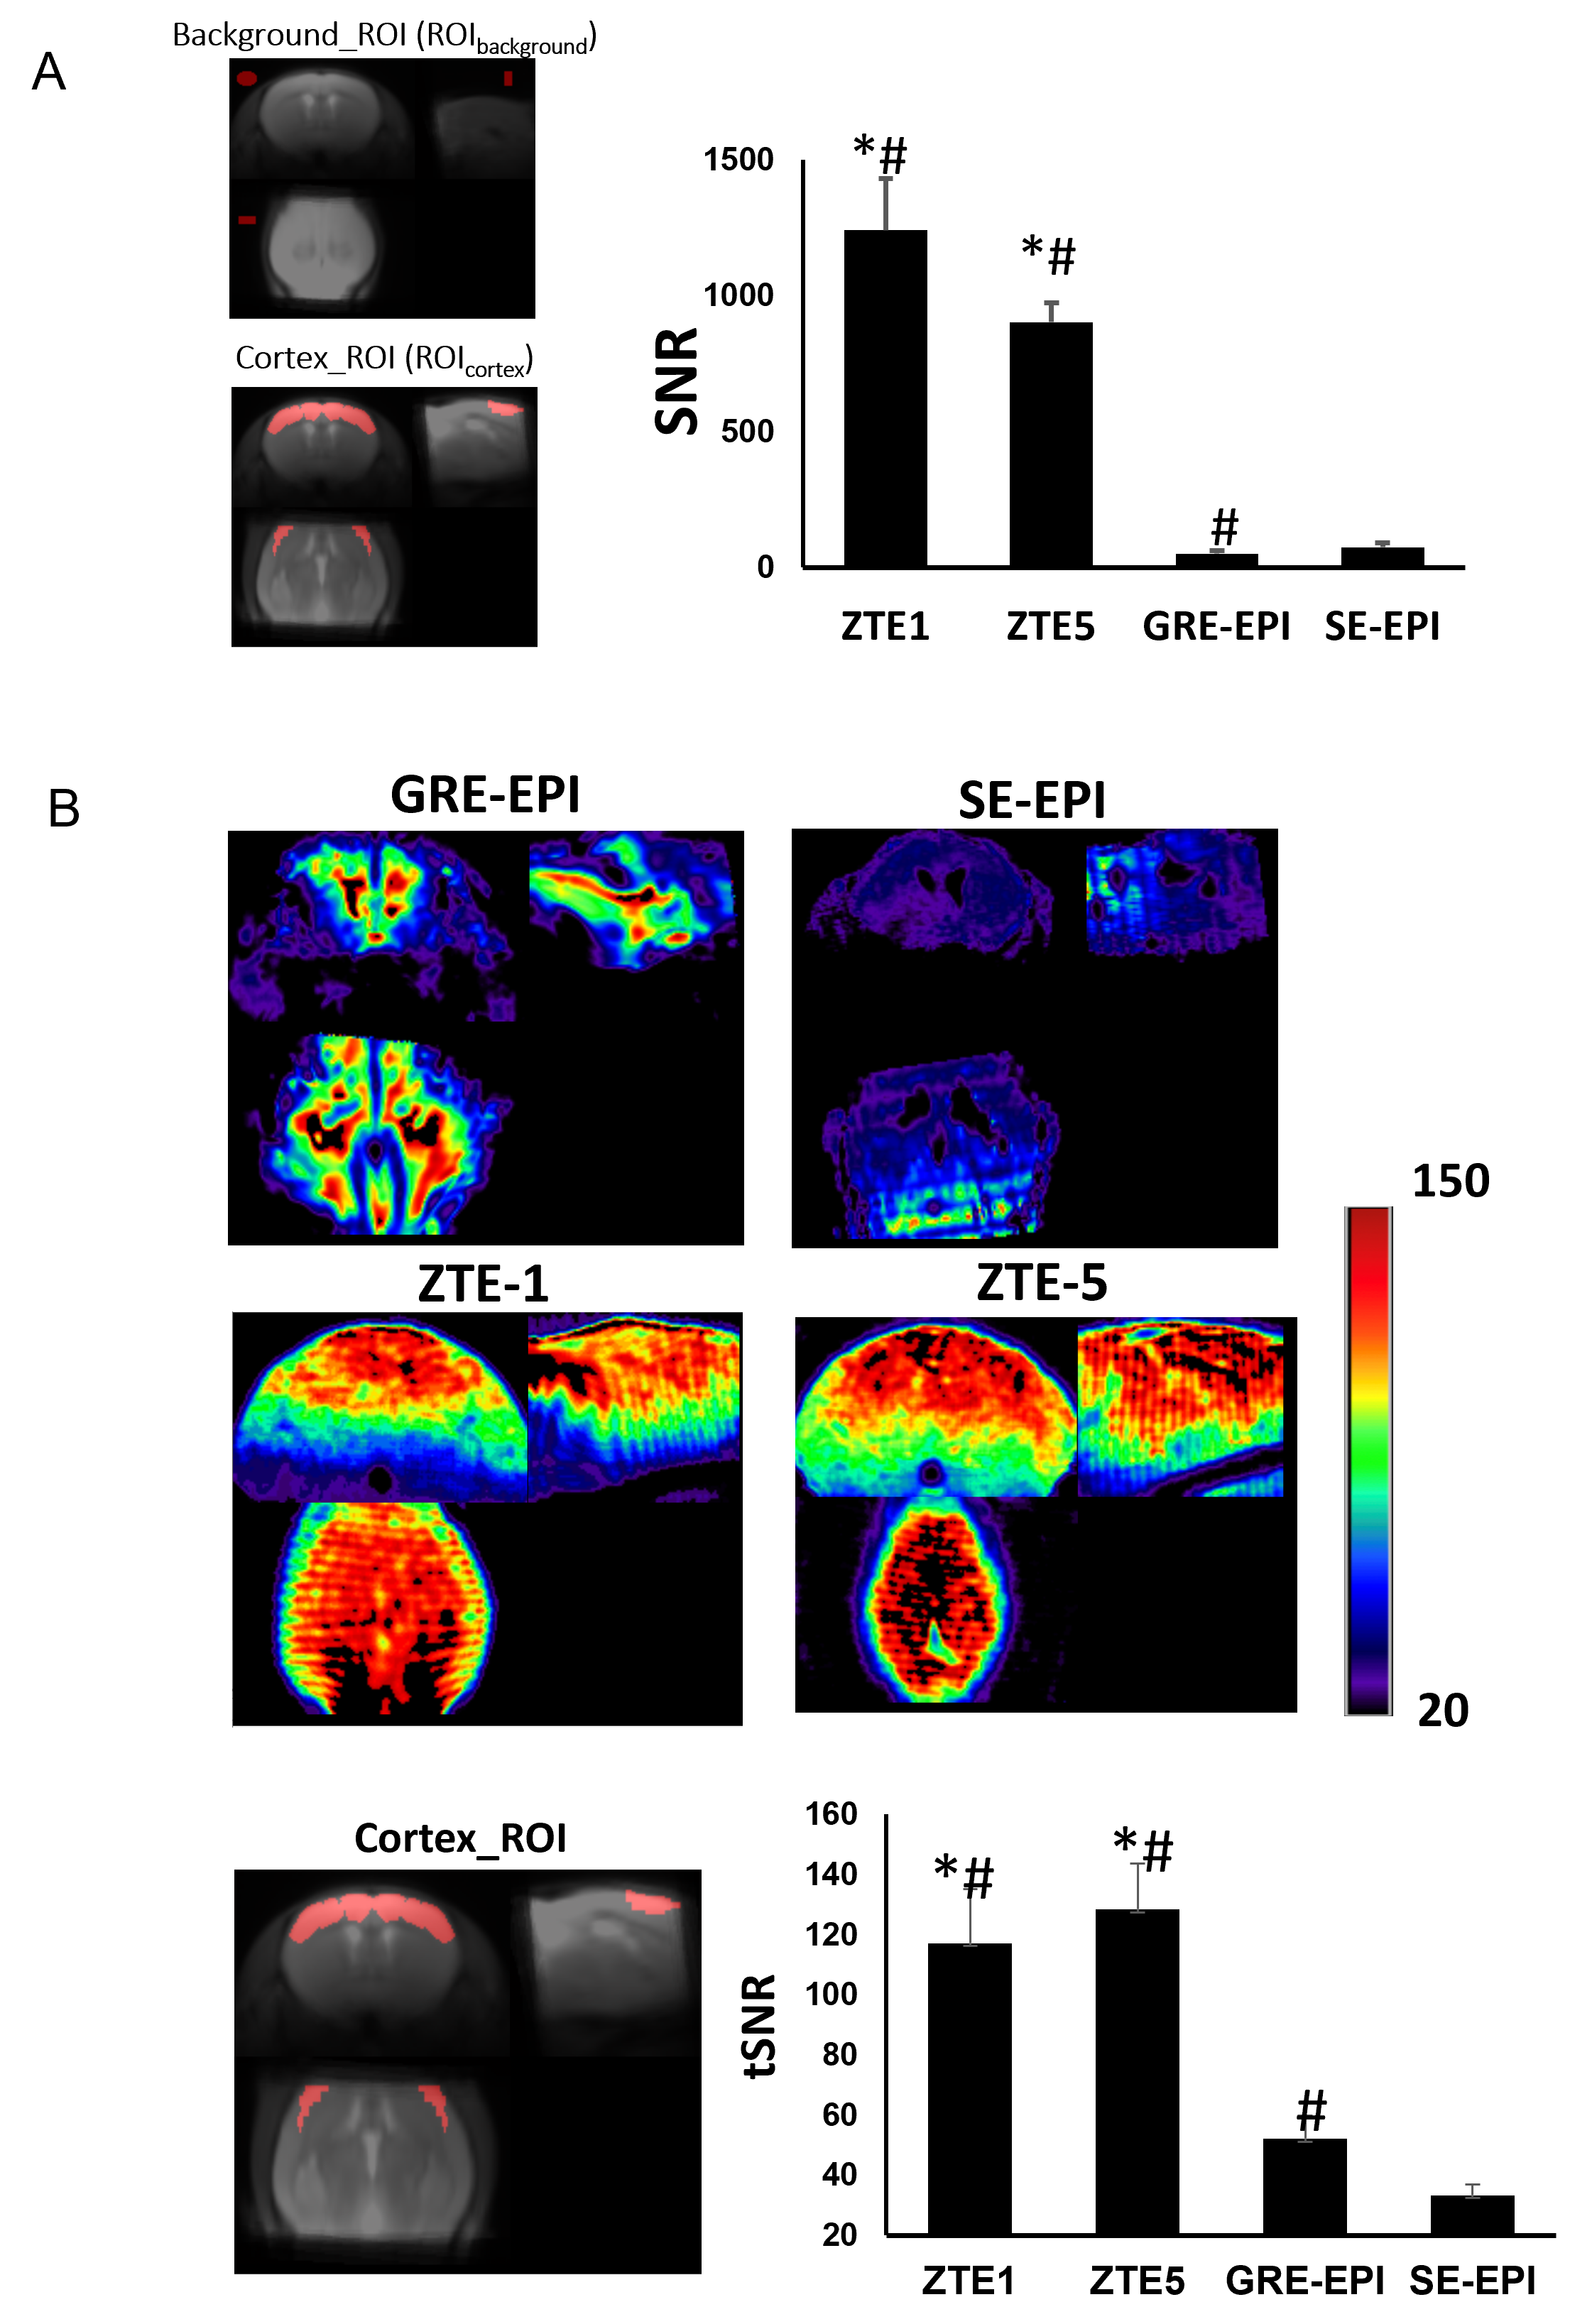
(A) The
tSNR map of SE-EPI, GE-EPI and ZTE images (*p
< 0.05 vs GE-EPI, # p < 0.05 vs SE-EPI, Bonferroni corrected) and (B) Averaged tSNR in the cortex in SE-EPI, GE-EPI and ZTE sequence.(*p
< 0.05 vs GE-EPI, # p < 0.05 vs SE-EPI, Bonferroni corrected)
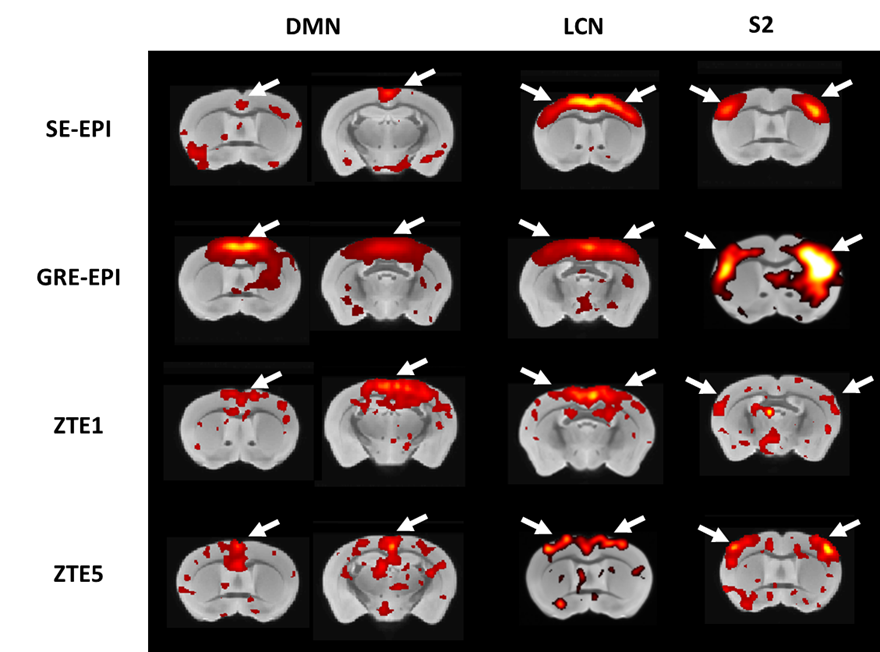
Functional
connectivity in SE-EPI, GE-EPI, ZTE-1, and ZTE-5. White arrows show the regions
included in functional connectivity.
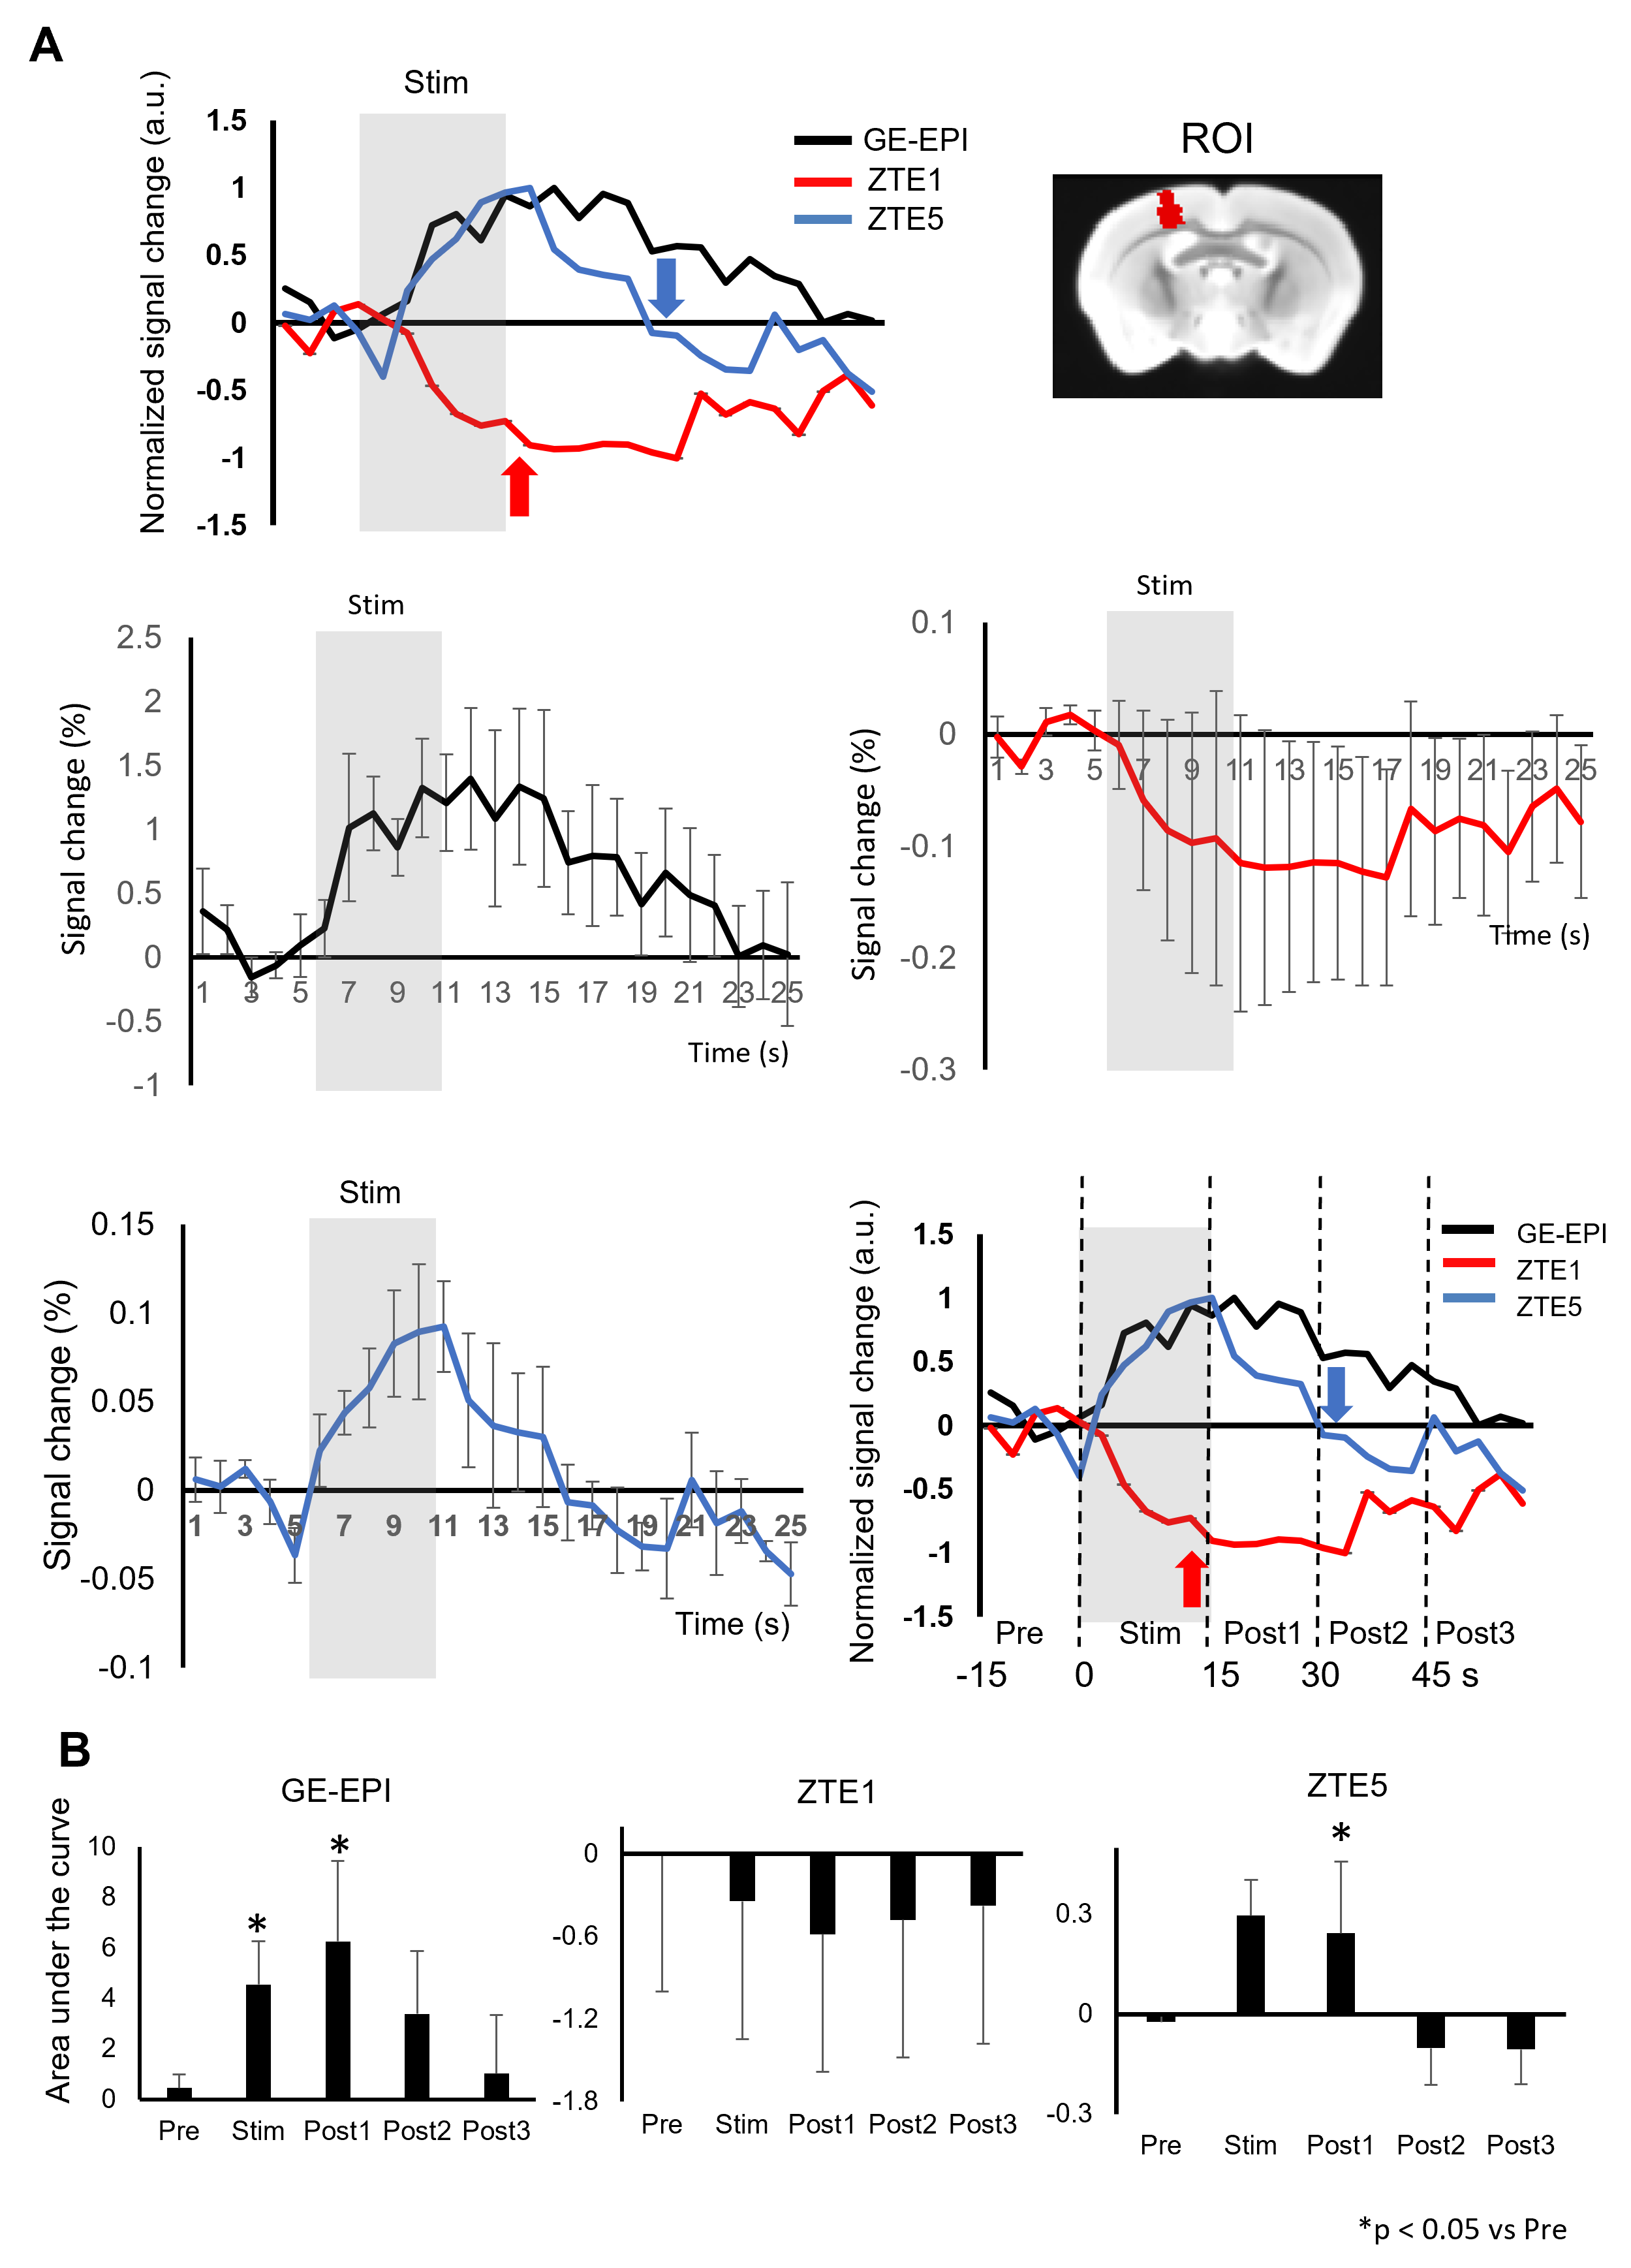
(A)Hind
paw sensory stimulation
Time-course
of signal change in the contralateral S1HL. (mean±SEM) (B) Area under the curve of time-course in each period.
DOI: https://doi.org/10.58530/2024/4120