4116
DTI and NODDI to monitor treatment effect for stroke in middle cerebral artery occlusion mouse model1University of Washington, Seattle, WA, United States
Synopsis
Keywords: Small Animals, Stroke
Motivation: Stroke is a serious medical condition that can lead to long-term disability and death, yet has limited treatment options.
Goal(s): This study aims to identify effective diffusion MRI biomarkers in monitoring treatment response with a repurposed drug for stroke.
Approach: In vivo diffusion tensor imaging (DTI) and neurite orientation dispersion and density imaging (NODDI) were performed on the mouse brain with middle cerebral artery occlusion (MCAO). Mice were imaged on the 14T MR system on day 7 post-MCAO, following a 7-day treatment regimen with either Senicapoc or vehicle.
Results: Certain DTI and NODDI parameters were found to demonstrate strong treatment effect.
Impact: Both DTI and NODDI maps may provide useful information in monitoring response to repurposed Senicapoc drug treatment for stroke.
Introduction
Stroke is a serious disease that can lead to long-term disability and death. It is the fifth leading cause of death in the United States. Treatment options for stroke are limited. Senicapoc drug is up-regulated in microglia/macrophage in stroked brain of rodents(1) and humans. Diffusion MRI has been used to diagnose stroke patients and monitor stroke recovery outcomes. Although DTI measures have shown moderate correlation with stroke outcomes(2), there remain some limitations of the DTI method in differentiating white matter integrity in regions of crossing fibers, trauma, and axonal remodeling(3). NODDI is a multi-compartment model that can differentiate 3 microstructural environments including intracellular, extracellular, and cerebral spinal fluid compartments. In this study, we used DTI and NODDI on the mouse brain with stroke in vivo to examine if DTI/NODDI parameters can identify the efficacy of Senicapoc in treating stroked brain.Methods
Middle cerebral artery occlusion (MCAO) was induced on the left hemisphere of the brain in 16 mice. Eight mice were treated with Senicapoc once every 12 hours for 7 days while the other 8 mice were treated with vehicle once every 12 hours for 7 days. All mice were scanned on a 14T MR system (Bruker, Billerica, MA, USA) at 7 days post-MCAO with 3 dimensional T2 weighted imaging (rapid acquisition with relaxation enhancement (RARE); repetition time (TR)/echo time (TE) = 1000/30 ms; field of view = 17 x 17 x 17 mm; matrix size = 256 x 64 x 32; RARE factor = 8; number of averages = 1) and diffusion tensor imaging - echo planar imaging (DTI-EPI) (TR/TE = 4000/17.8 ms ; number of slices = 15; slice thickness = 1 mm; field of view = 17 x 17 mm; matrix size = 128 x 128; number of segments = 4; number of averages = 1; diffusion direction = 30; b-values = 0, 1000, and 2000 s/mm2). NODDI maps were generated by NODDI Matlab Toolbox (version 1.0.5, http://mig.cs.ucl.ac.uk/index.php?n=Tutorial.NODDImatlab). The EPI images were corrected using the FSL tools (https://fsl.fmrib.ox.ac.uk/fsl/fslwiki). Using these tools, we calculated fractional anisotropy (FA), mean diffusivity (MD) and 3 eigenvalues, and NODDI parameters including Intracellular volume fraction (ficvf), free water fraction (fiso), and orientation dispersion index (odi). All the maps were co-registered into a common space with Advanced Normalization Tools (ANTs: https://stnava.github.io/ANTs/) software (version 2.3.4). A fractional anisotropy (FA) template was generated using the FA maps of all mice with the ANTs software. All measured DTI/NODDI data were compared between vehicle treated and treated with Senicapoc to examine a treatment effect using the 2-way ANOVA.Results
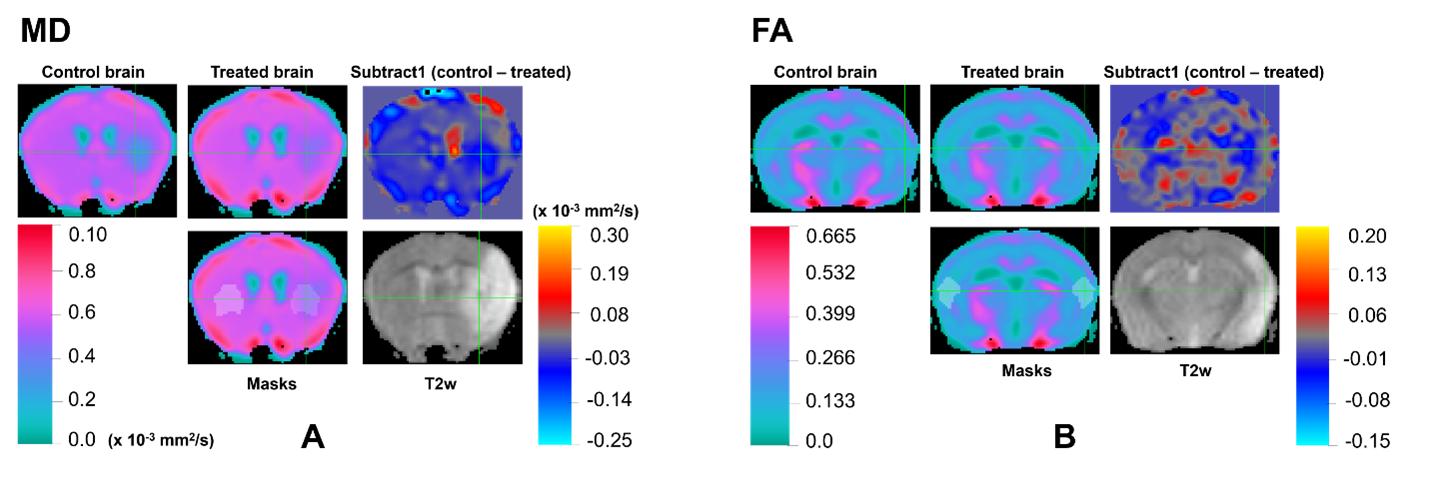
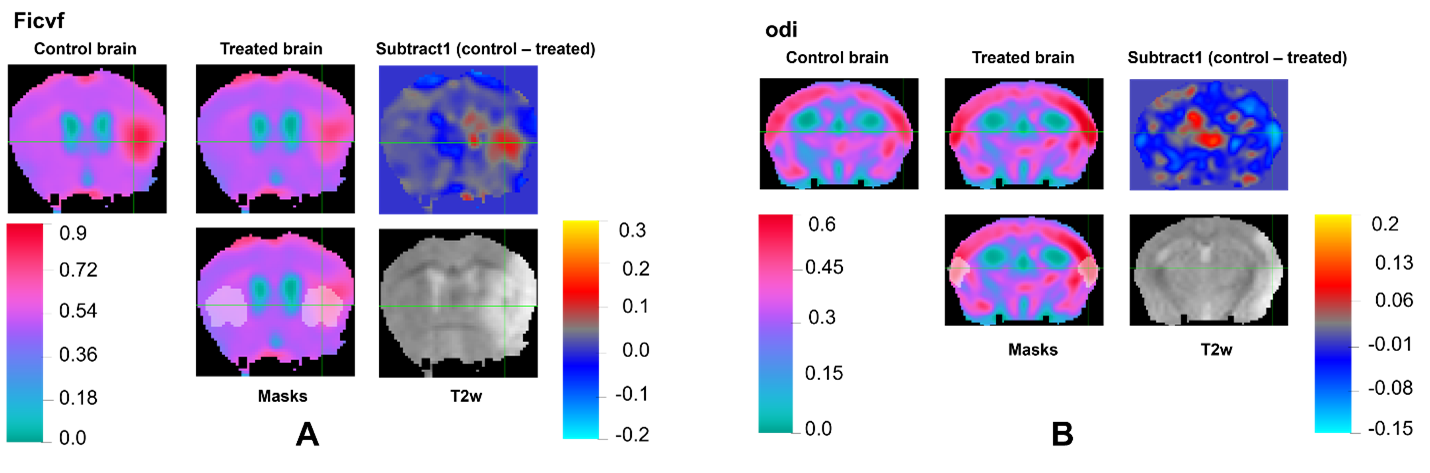
A strong treatment effect was observed between vehicle treated brains and Senicapoc treated brains in MD, FA, and eigenvalues of λ1 and λ2 measured in some infarct slices as well as two NODDI parameters including ficvf and odi measured in some slices of the infarct region.Axial diffusivity (λ1), λ2, MD, and FA values showed a strong treatment effect (p-values were 0.019, 0.029, 0.019, and 0.045, respectively) as shown in Fig. 1. Figure 2 shows a brain slice indicating infarct region on the left hemisphere and normal region on the right hemisphere. Parameter ficvf was increased in the infarct region of the brain and slightly reduced in the infarct region after the treatment with Senicapoc (see Fig. 2). Also, odi values were increased in the infarct region and further increased in the part of the infarct region after the treatment with Senicapoc (see Fig. 2). Parameters ficvf and odi showed a strong treatment effect (ficvf: p = 0.032 and odi: p = 0.028).
Discussion
MD values in the infarct region were reduced in comparison to those in the contralateral side. The reduced MD values were slightly increased from the Senicapoc treatment, demonstrating a potential treatment effect. FA values in the infarct region were decreased compared to those in its contralateral side. FA values were further reduced for brains treated with Senicapoc.The ficvf reduction after treatment with Senicapoc may show a potential treatment effect. There was an increase in odi values in the infarct region compared to contralateral healthy tissue. After the Senicapoc treatment, odi values were further increased. The changes in odi values were opposite to those in FA values. We have assessed DTI/NODDI parameters at 7 days post-MCAO and after treatments, but more studies would be needed to monitor how these diffusion parameters will change at later time points.
Conclusion
We demonstrated that the DTI/NODDI methods would be useful in diagnosing ischemic stroke and monitoring response against a repurposed Senicapoc drug in treating stroke.Acknowledgements
This work was supported by NIH R01 NS124627.References
1. Lee RD, Chen YJ, Nguyen HM, Singh L, Dietrich CJ, Pyles BR, Cui Y, Weinstein JR, Wulff H. Repurposing the K. Transl Stroke Res 2023.
2. Puig J, Blasco G, Schlaug G, Stinear CM, Daunis-I-Estadella P, Biarnes C, Figueras J, Serena J, Hernández-Pérez M, Alberich-Bayarri A, Castellanos M, Liebeskind DS, Demchuk AM, Menon BK, Thomalla G, Nael K, Wintermark M, Pedraza S. Diffusion tensor imaging as a prognostic biomarker for motor recovery and rehabilitation after stroke. Neuroradiology 2017;59(4):343-351.
3. Kaden E, Knösche TR, Anwander A. Parametric spherical deconvolution: inferring anatomical connectivity using diffusion MR imaging. Neuroimage 2007;37(2):474-488.
Figures