4114
The impact of high-fat, obesogenic diets on brain volume in a commercially available mouse model of fatty liver disease.1University of Maryland School of Medicine, Baltimore, MD, United States
Synopsis
Keywords: Small Animals, Metabolism
Motivation: Large-scale brain imaging studies have shown a significant association between altered brain structure in obesity. However, the exact biological processes remain elusive. Here, we use inbred mice, fed diets with pre-determined caloric contributions to elucidate diet-specific contributions to brain structure alterations in obesity.
Goal(s): The goal of this study is to perform morphometric analysis of the brains of a commercially available mouse model of obesity.
Approach: Mice were fed regular (5% fat), or obesogenic diets (40% fat). After 8 weeks all mice were scanned using MRI.
Results: Obese mice show volume reduction, but not statistically significant. Neocortical volumes were larger in obese mice.
Impact: The use of commercially available, diet-induced, obese mouse models provides an opportunity for the neuroimaging community to produce consistent structural and functional to support the assertion that obesity may be a ‘brain disease’.
Introduction
The obesity pandemic is well underway, with mounting evidence that weight gain in developed countries continuing to rise1. Unfortunately, obesity is a multi-factorial disease, with both genetic and environmental factors reciprocally affecting the outcome of weight gain2. The availability of off-the-shelf models of mice fed obesogenic diets is a valuable resource to define nutrient-based features of obesity3. These mouse models are usually derived from inbred, genetically identical mice, fed diets with pre-determined caloric contributions from specific nutrient groups. In this study, we undertake a morphometric analysis of the brains of a commercially available mouse model of obesity. Here, we use widely available magnetic resonance imaging (MRI) techniques to measure a) global brain volume and b) volume of specific brain regions, in mice fed obesogenic diets compared to chow-fed controls.Materials and methods
6-week-old C57BL/6NTac male mice were fed regular chow diet (5053; LabDiet, 5% dietary fat; 3.42 kcal/g) as controls. In contrast, the obese group were fed high fat, high fructose diet (Research Diets, D09100310, 40% fat, 22% fructose and 2% cholesterol). After 8 weeks all mice were scanned using a horizontal bore Bruker Biospec 7T.A 2D coronal T2-weighted (T2w) structural MRI scan with Repetition Time (TR) of 2500ms, an Echo Time (TE) of 30ms, number of averages of 6, a flip angle of 90 degrees, a Field of View (FOV) of 18mm x 18mm, with the phase encoding direction in the coronal plane. The in-plane resolution was 0.12mm x 0.12mm, while the slice thickness was 0.5mm with no gap between slices. The acquired data matrix dimensions were 150 x 150 x 26. All individual T2-weighted (T2w) images were converted into NIfTI format using the "dcm2nii" tool, part of the Advanced Normalization Tools (ANTs) suite4. 15 Control and 15 obese mice were randomly selected for the creation of a population averaged T2w brain template. Finally, all individual T2w brain images in this study were non-linearly registered to the population T2w brain template using ANTs' SyN algorithm, incorporating both affine and deformable transformations and optimizing with mutual information.
Results
8 weeks of obesogenic, high fat diet resulted in grossly evident difference in the appearance of mice compared to chow-fed controls. Predictably, body weights of obese mice were significantly greater, approximately 13% heavier than chow-fed equivalents. (Fig. 1)To ensure that brain volume measurements were consistent across all animals, we further restricted our analysis to coronal slices ranging from 3 to 22, progressing from caudal to rostral regions. Within this defined coronal slice range, we computed the total number of voxels encompassed by the brain mask. This voxel count was then multiplied by the image resolution to determine the whole brain volume. Here, we observed a whole brain volume reduction in obese mice but not significant (T = -0.760, p = 0.4524).
Additionally, we partitioned the coronal slices into three segments: posterior (slices 3-7), middle (slices 8-19), and frontal (slices 20-22). The volumes within these segmented regions were also calculated to provide a more detailed assessment of brain volume distribution. Group comparison between controls and obese mice showed significant decrease in posterior area (T=-2.947, p = 0.0058) and frontal area volumes (T = -2.374, p = 0.023) and an increase but not significant in the middle area volume (T = 0.624, p = 0.5365), summarized in Fig. 2.
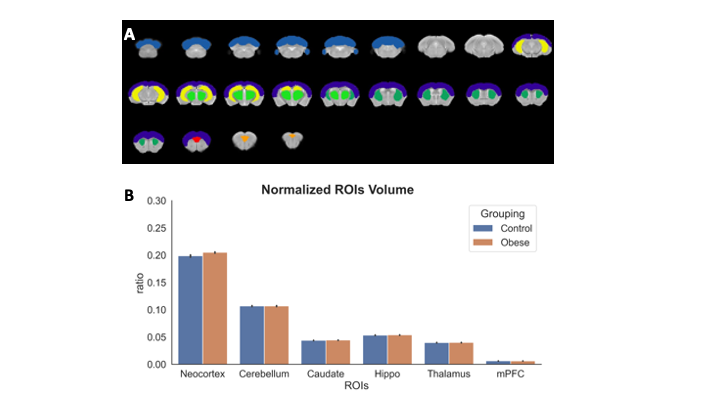
As whole brain volumes were only minimally altered in obese mice vs. controls, we proceeded to ask if the volumes of specific brain regions might be more significantly changed. Here, we focused on the cerebellum, cerebral cortex/neocortex, hippocampus, thalamus, CPU (caudate and putamen), and prefrontal cortex.The volume of the neocortex in obese animals were significantly larger than that of controls. In contrast, no other region displayed a statistically significant difference in terms of regional volumes between the two groups tested. This is shown in Fig. 3
Discussion and Conclusions
In this study, we examined the relationship between brain volumes and obesity, in miceBased on large-scale studies in humans, we tested the hypothesis that obesity in mice is associated with a decrease in cortical volumes5. However, we did not find support for this hypothesis. In fact, we report an increase in neocortical volumes in obese mice. The inconsistencies between mouse and human data may point to differential contributions of diet-only drivers of obesity, vs. other factors that promote weight gain. The paradigm of using mouse model with neuroimaging allows the investigation of individual factors that impact weight gain, using radiological tools to elucidate a radiological signature of modulators of obesity.
Acknowledgements
This work was supported in part by NIH grant R21CA245492. We acknowledge the support of the University of Maryland, Baltimore, Institute for Clinical & Translational Research (ICTR) and the National Center for Advancing Translational Sciences (NCATS) Clinical Translational Science Award (CTSA) grant number 1UL1TR003098. We also acknowledge the support of the National Cancer Institute-Cancer Center Support Grant (CCSG) - P30CA134274, as well as the Maryland Department of Health’s Cigarette Restitution Fund Program CH-649-CRF. The authors thank the staff support from the Shared Service of the University of Maryland Marlene and Stewart Greenebaum Comprehensive Cancer Center.References
1 Malik, V. S., Willet, W. C. & Hu, F. B. Nearly a decade on - trends, risk factors and policy implications in global obesity. Nat Rev Endocrinol 16, 615-616, doi:10.1038/s41574-020-00411-y (2020).
2 Bluher, M. Obesity: global epidemiology and pathogenesis. Nat Rev Endocrinol 15, 288-298, doi:10.1038/s41574-019-0176-8 (2019).
3 Nakamura, A. & Terauchi, Y. Lessons from mouse models of high-fat diet-induced NAFLD. Int J Mol Sci 14, 21240-21257, doi:10.3390/ijms141121240 (2013).
4 Avants, B. B., Epstein, C. L., Grossman, M. & Gee, J. C. Symmetric diffeomorphic image registration with cross-correlation: evaluating automated labeling of elderly and neurodegenerative brain. Med Image Anal 12, 26-41, doi:10.1016/j.media.2007.06.004 (2008).
5 Dekkers, I. A., Jansen, P. R. & Lamb, H. J. Obesity, Brain Volume, and White Matter Microstructure at MRI: A Cross-sectional UK Biobank Study. Radiology 291, 763-771, doi:10.1148/radiol.2019181012 (2019).
Figures
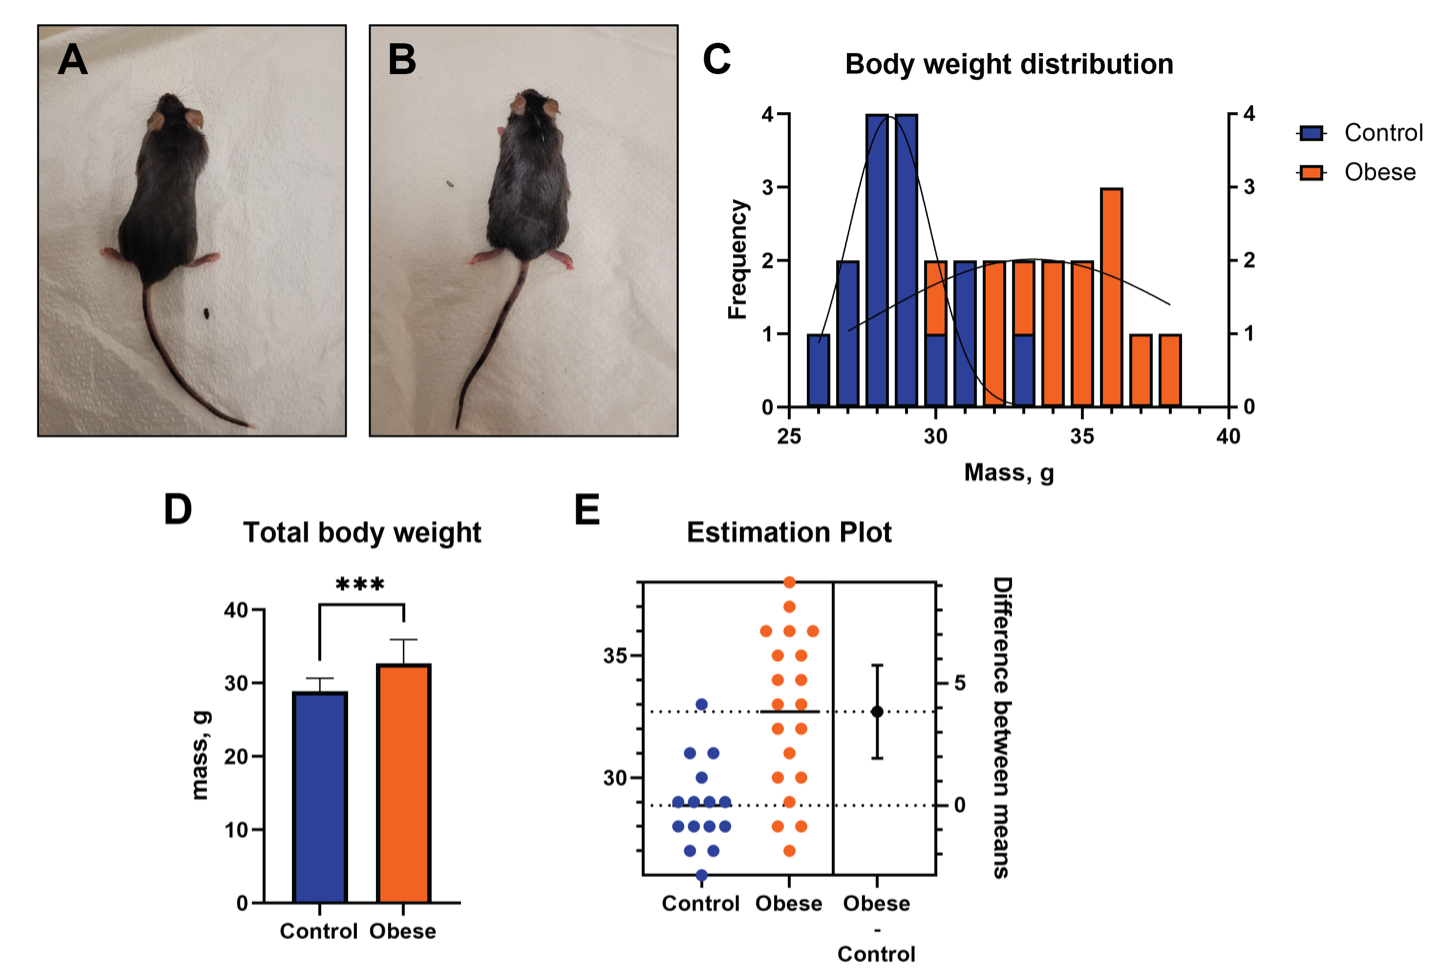
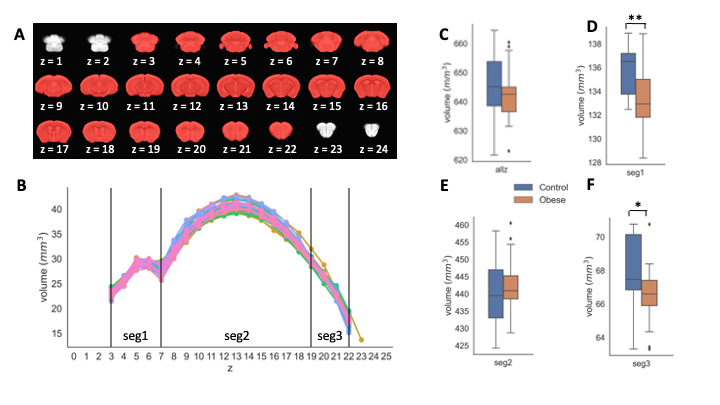
Figure 2: (A) Representative images of a coronal sections with slices selected for analysis highlighted in red. (B) Refinement obrain regions divided in three sections: a) posterior (slices 3-7), b) mid-brain (slices 8-19) and c) frontal (slices 20-22). (C) Brain volumes trended lower in obese mice, but not achieving statistical significance (p = 0. 4524). (D) (E) (F) Volumes of Seg 1 and Seg3 in obese mice are reduced (p = 0.0058 and p = 0.023, respectively). Seg2 brain volumes trended higher in obese mice vs. controls, but this change was not statistically significant (p = 0.624).