4112
Delayed CSF clearance may provide a more sensitive disease marker than blood-CSF-barrier impairment in an Alzheimer’s disease mouse model1Department of Biomedical Engineering, Johns Hopkins University, Baltimore, MD, United States, 2F.M. Kirby Research Center for Functional Brain Imaging, Kennedy Krieger Institute, Baltimore, MD, United States, 3Neurosection, Division of MRI Research, Department of Radiology, Johns Hopkins University, Baltimore, MD, United States, 4Department of Psychiatry and Behavioral Sciences, Johns Hopkins University, Baltimore, MD, United States, 5Center for Biomedical Imaging, NYU Grossman School of Medicine, New York, NY, United States, 6Department of Neurology, Johns Hopkins University, Baltimore, MD, United States
Synopsis
Keywords: Neurofluids, DSC & DCE Perfusion, Alzheimer' Disease; CSF clearance; GBCA
Motivation: Accumulation of abnormal proteins in AD has been linked with barrier breakdown between blood and tissue or CSF, and impaired clearance from the brain.
Goal(s): To use GBCA-induced signal changes in ventricular CSF following intravenous injection and its decay over time as indices to study the integrity of blood-CSF barrier (BCSFB) and GBCA clearance via CSF, respectively.
Approach: Dynamic-susceptibility-contrast-in-the-CSF (cDSC) MRI was performed in the 3xTg-AD mouse model.
Results: Impaired clearance in AD mice became significant at 8 months. The amount of GBCA crossing BCSFB appeared similar between AD and WT mice at these early stages.
Impact: Our results suggest that delayed CSF clearance may provide a more sensitive marker for AD, and parameters measured during the clearance phase may be more robust than measures obtained immediately after GBCA administration.
INTRODUCTION:
Accumulation of abnormal proteins such as amyloid-β (Aβ) and tau in brain tissue is a pathological hallmark for Alzheimer’s disease (AD)1-3. It has been linked with two key hypotheses: breakdown of barriers between blood and brain tissue or CSF space, and impaired clearance of such proteins from the brain. Indeed, many studies have provided evidence for both hypotheses34. However, the relationship and relative contributions from the two potential mechanisms are still not clearly defined. In this study, we employed a Gadolinium-based contrast agent (GBCA) used in routine clinical MRI examinations and a recently developed dynamic-susceptibility-contrast-in-the-CSF (cDSC) MRI method5 to measure dynamic signal changes in ventricular CSF in a well-established AD mouse model. The blood-CSF barrier (BCSFB) in the ventricles is considered a key site for substance exchange between blood and CSF. It is formed with a monolayer of choroidal epithelial cells with tight junctions permeable to GBCAs in rodents6. The GBCA-induced MR signal changes in ventricular CSF immediately following injection and its decay over time were used as indices to study the integrity of BCSFB and the clearance of GBCA via CSF circulation in the brain, respectively.METHODS:
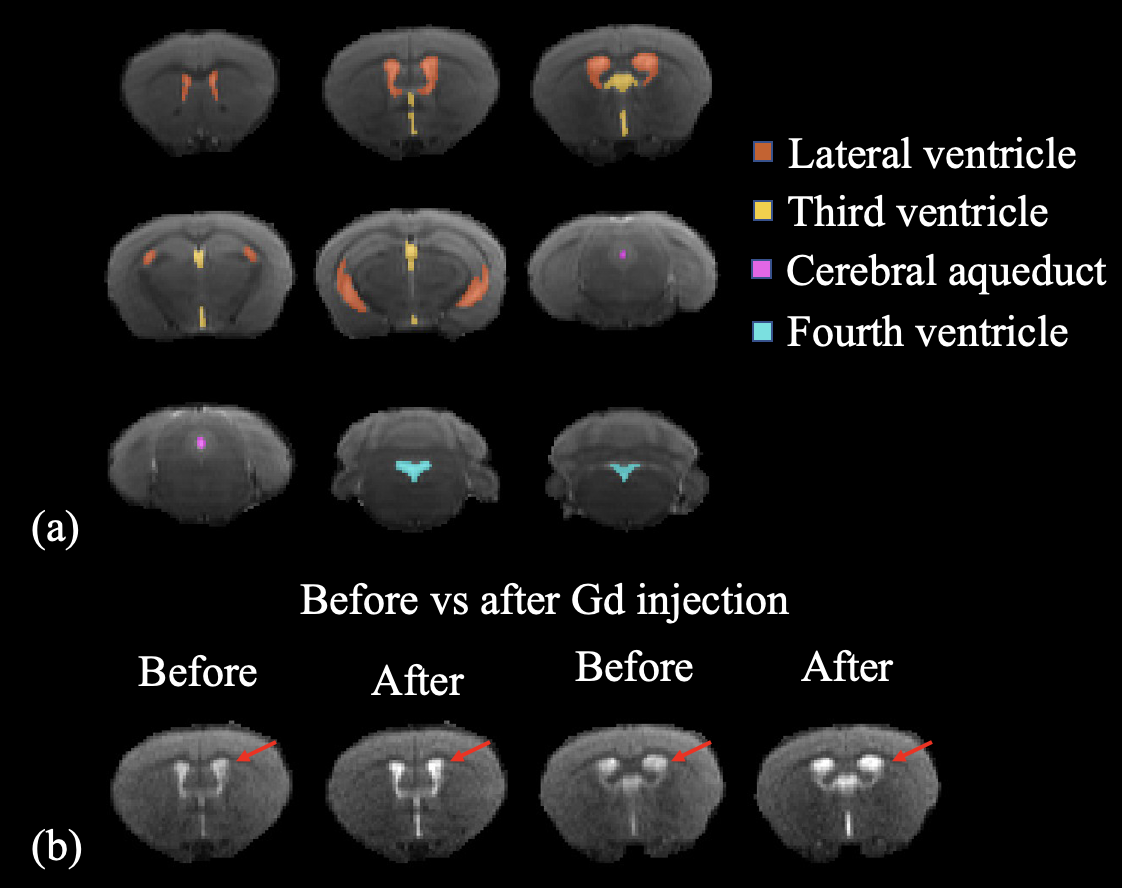
The 3xTg-AD mouse model was used: 12 WT and 10 AD mice at 3 months of age, 5 WT and 5 AD mice at 8 months. MRI: 11.7T Bruker scanner with a 72mm quadrature volume resonator as a transmitter and a 4-element (2×2) phased array coil as a receiver. Anesthesia was induced with 2% isoflurane in medical air and maintained with 1% isoflurane in oxygen and air (1:3) during MRI. In each mouse, cDSC MRI (fast-spin-echo, TR/TE=3000/30ms, voxel=0.2×0.2×0.5mm3, 3 shots) was performed continuously for 180min after GBCA administration (Omniscan, 4mL/kg, intravenous tail vein injection). Analysis: SPM is used for slice timing correction and ANTs for motion correction. The ventricle was manually divided into four regions-of-interest (ROI): lateral-ventricle (LV), third-ventricle (V3), cerebral-aqueduct (AQ), and fourth-ventricle (V4) (Fig.1a). Maximum signal change (∆𝑆𝑚𝑎𝑥), clearance rate (𝑘CL, calculated using linear regression, min-1) and signal change at 3-hour (10 dynamics, ∆𝑆3h) were calculated from the measured time courses in each ROI. Statistics: Effect-size was estimated with Cohen’s d, and t-test was used for group comparisons.RESULTS:
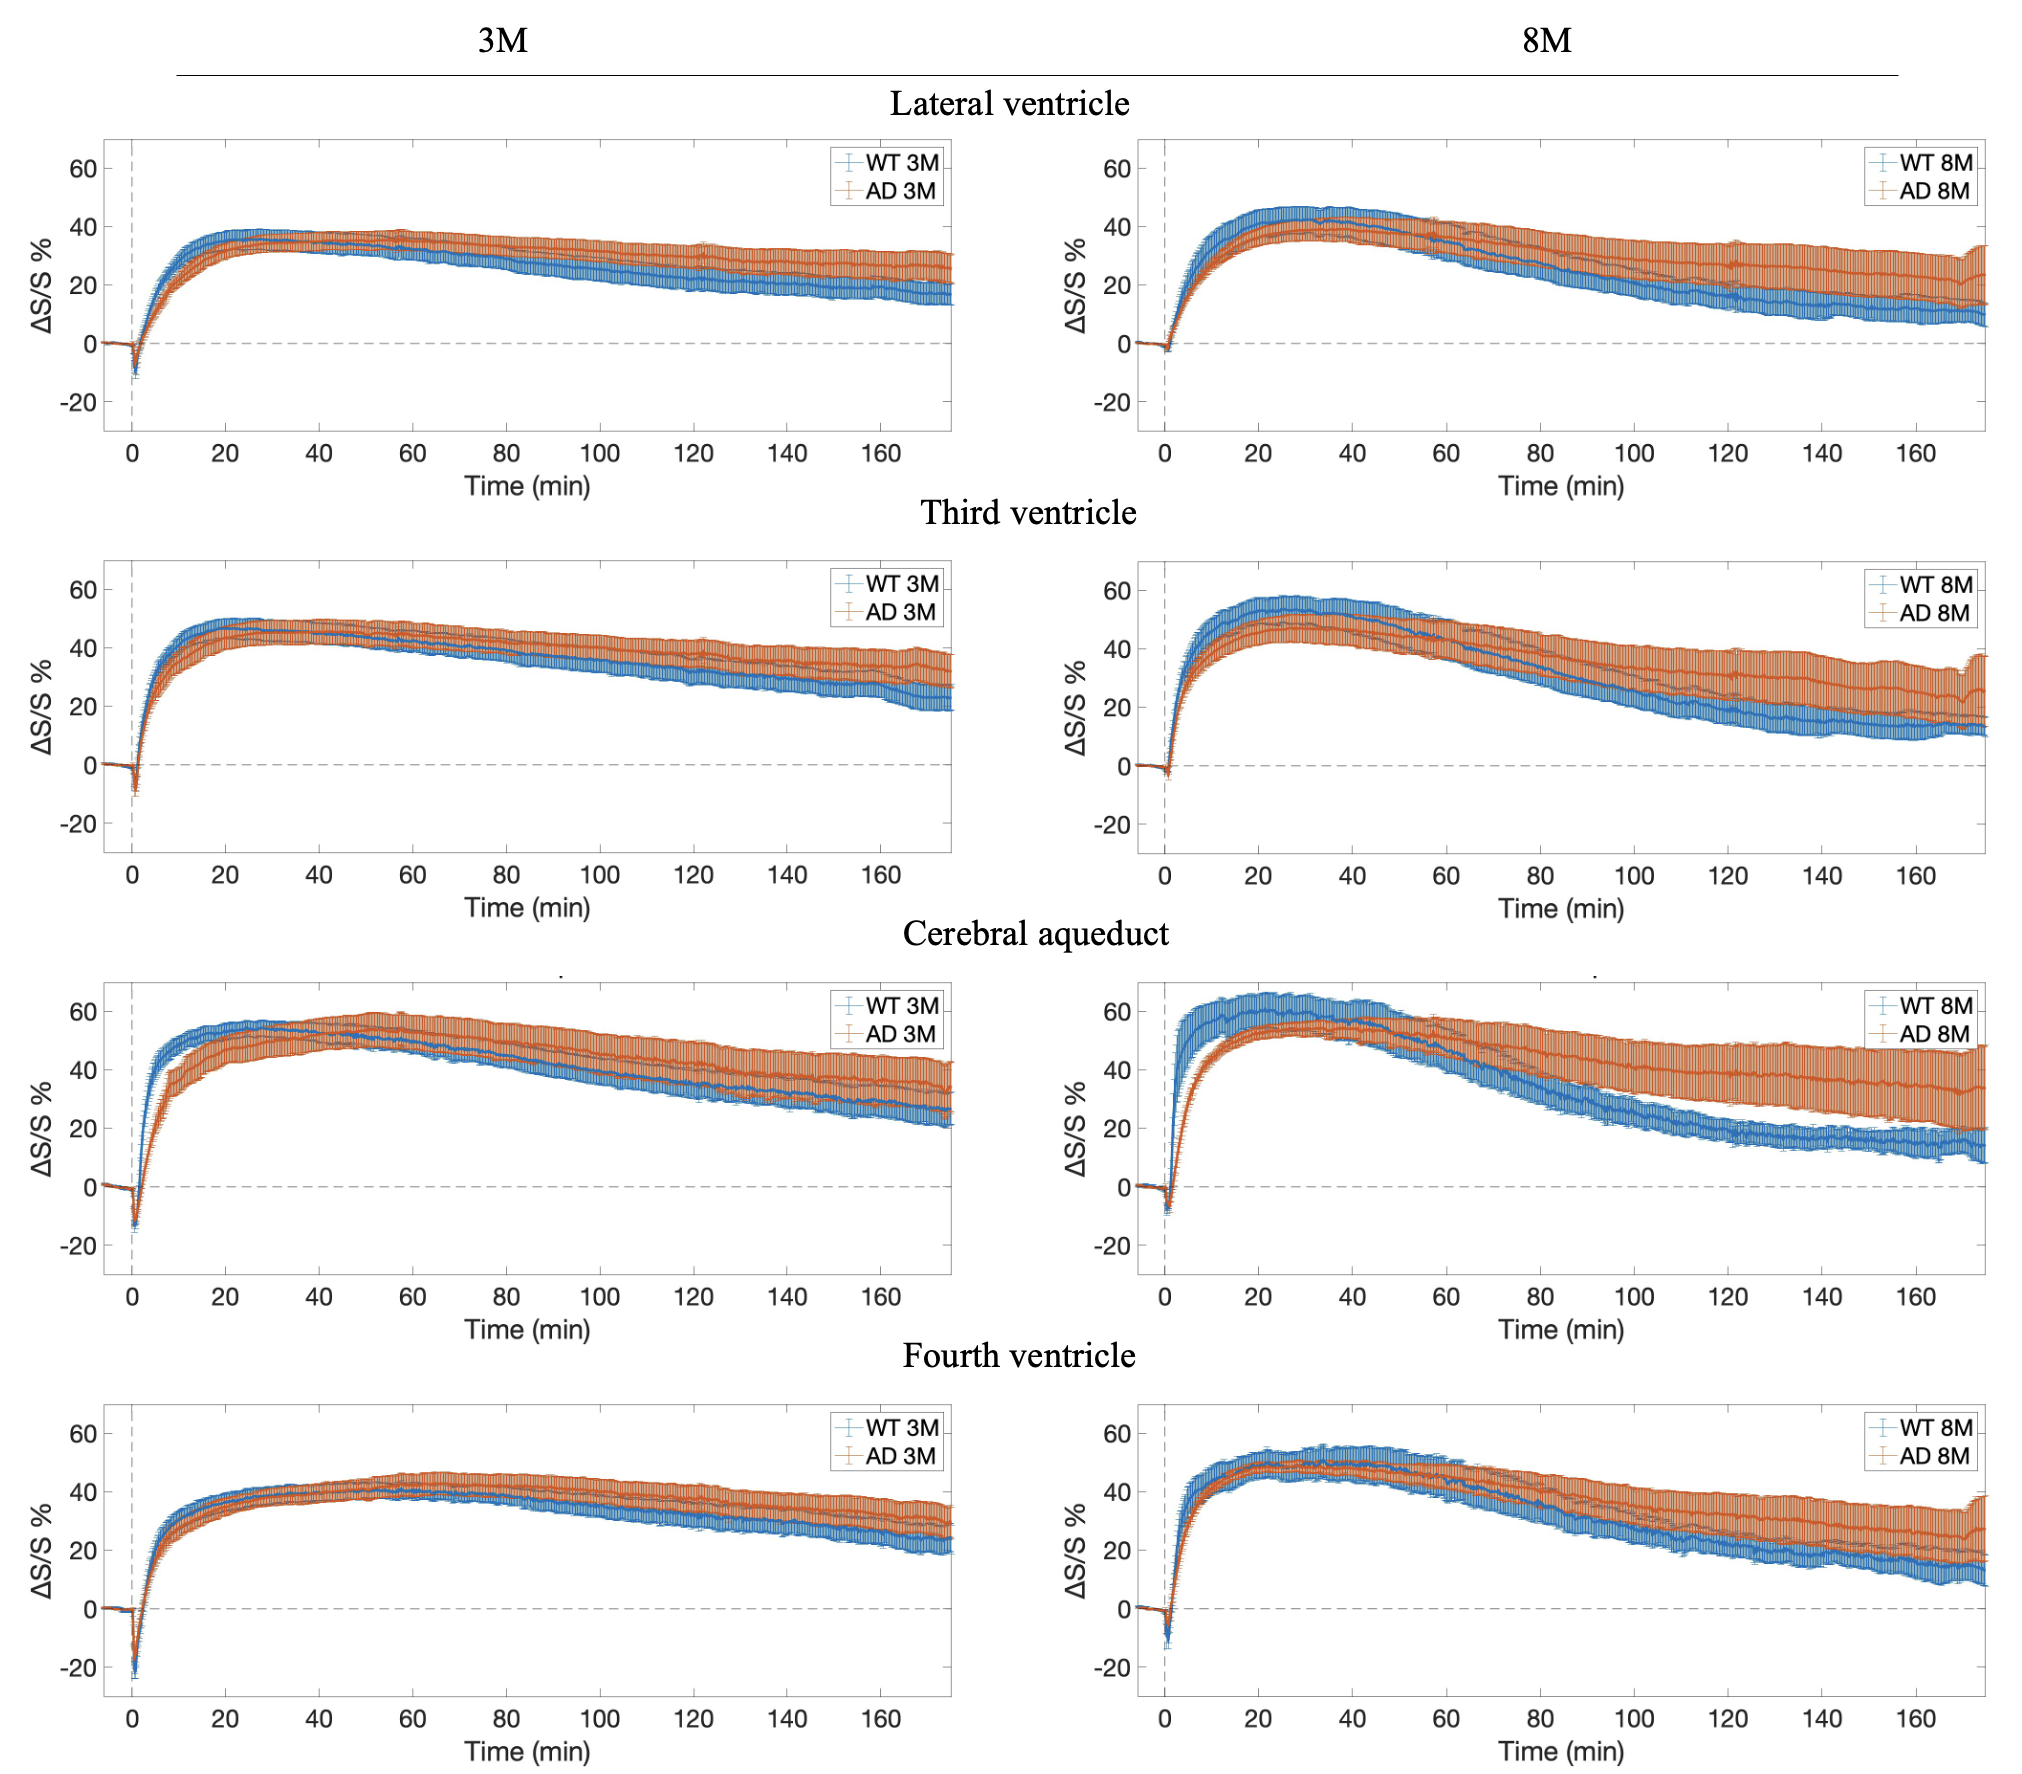
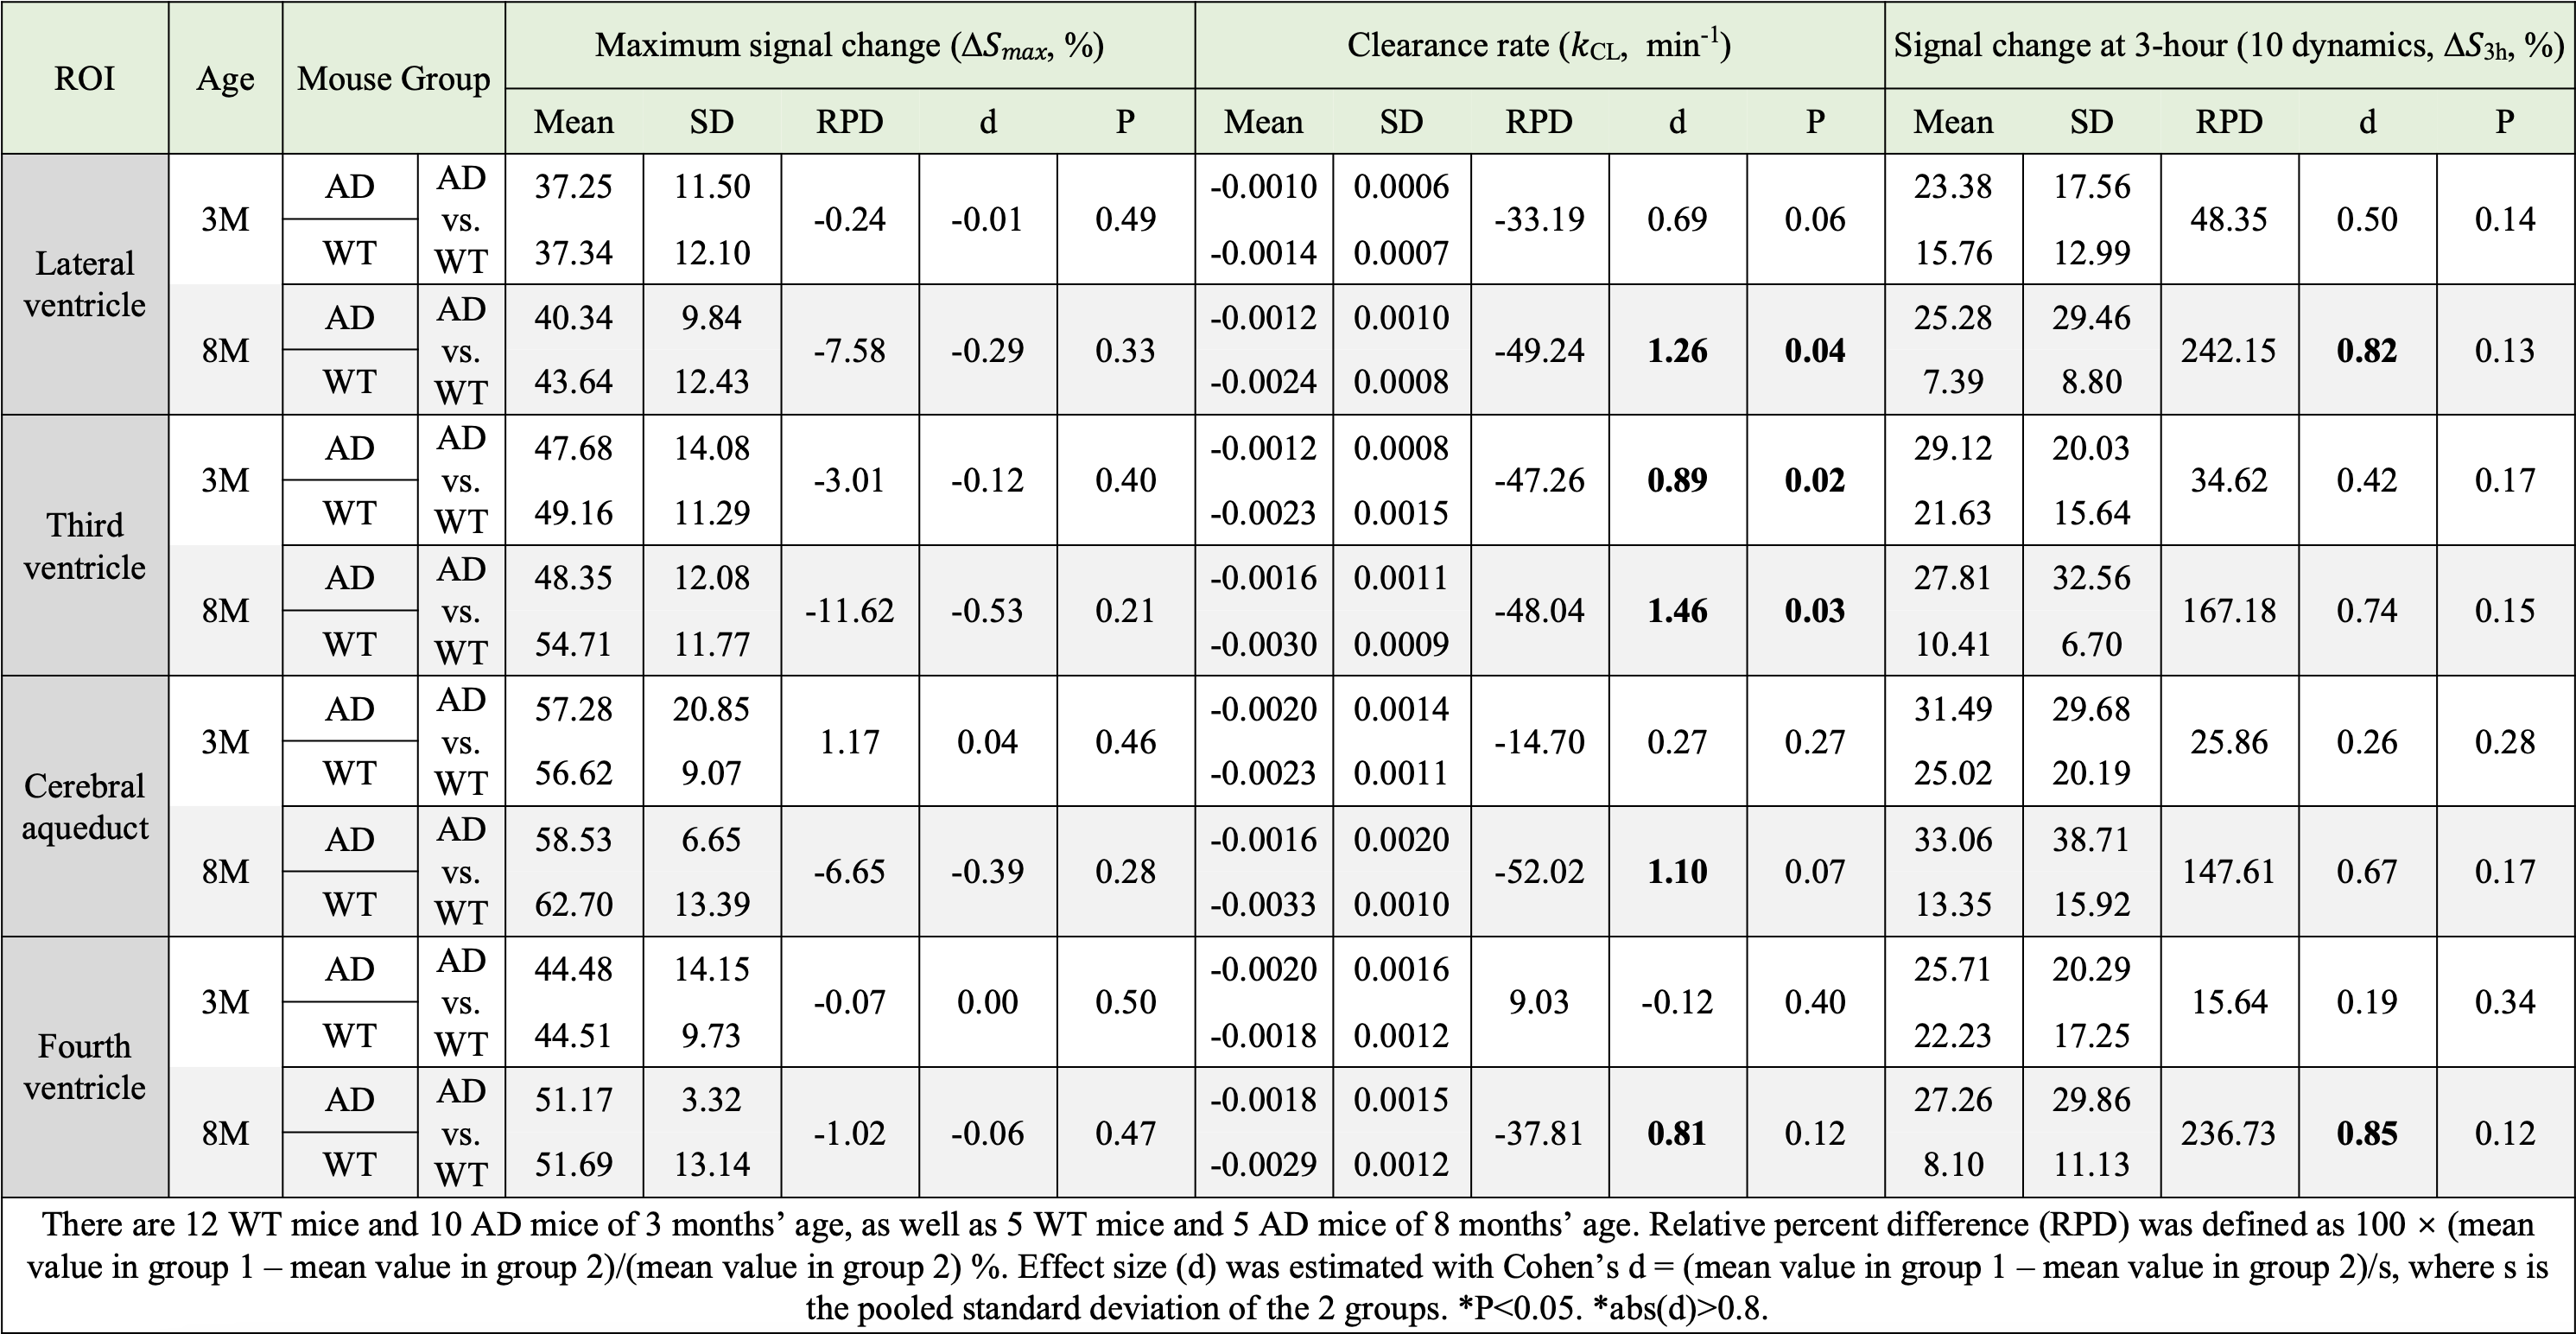
Fig.1b shows representative cDSC MRI images before and after GBCA injection. GBCA-induced signal enhancement was observed in the ventricle in all mice. Group averaged GBCA-induced signal change time courses from each ROI are shown in Fig.2. Table 1 summarizes quantitative results extracted from the time courses. After GBCA injection, maximum signal change (∆𝑆𝑚𝑎𝑥) was slightly lower in AD compared to WT mice in all ROIs at both ages but with no statistical significance. During the clearance phase, clearance rate (𝑘CL) was slower in AD compared to WT, with a significant decrease in LV and V3 at 8 months and in V3 at 3 months. ∆𝑆3h was higher in AD than WT mice in all ROIs at both ages, but none reached statistical significance. Both parameters calculated from the clearance phase (𝑘CL and ∆𝑆3h) showed much greater effect size than ∆𝑆𝑚𝑎𝑥 measured from the initial period in all ROIs at both ages. Longitudinally, all measures showed increased effect sizes at 8 months compared to 3 months.DISCUSSION & CONCLUSION:
The parameter ∆𝑆𝑚𝑎𝑥 was measured during the initial signal increase period after GBCA injection, which may be predominantly affected by the amount of GBCA crossing the BCSFB and entering the ventricle. On the other hand, both kCL and ∆𝑆3h were calculated using data acquired after 1-hour post-GBCA. Thus, they are expected to reflect primarily the clearance of GBCA from the ventricle. The 3xTg-AD mice showed brain intracellular Aβ accumulation but were cognitively normal at 3-4 months. At 8 months, considered early clinical stage, Aβ accumulation and cognitive impairment were present, but no tau tangles. Our data showed that impaired clearance (kCL) became significant in AD mice at 8 months, but the amount of GBCA crossing the BCSFB (∆𝑆𝑚𝑎𝑥) appeared to be similar between AD and WT mice at these early stages. This implies that parameters measured during the clearance phase may provide more sensitive markers for AD than measures obtained immediately after GBCA administration. Subsequent studies are ongoing to characterize these changes at later stages of AD in these mice.Acknowledgements
No acknowledgement found.References
1. Huang, J. et al. Altered D-glucose in brain parenchyma and cerebrospinal fluid of early Alzheimer’s disease detected by dynamic glucose-enhanced MRI. Sci. Adv. 6, eaba3884 (2020).
2. Chen, L. et al. D-Glucose uptake and clearance in the tauopathy Alzheimer’s disease mouse brain detected by on-resonance variable delay multiple pulse MRI. J. Cereb. Blood Flow Metab. 41, 1013–1025 (2021).
3. Tarasoff-Conway, J. M. et al. Clearance systems in the brain—implications for Alzheimer disease. Nat. Rev. Neurol. 11, 457–470 (2015).
4. Benveniste, H. et al. The Glymphatic System and Waste Clearance with Brain Aging: A Review. Gerontology 65, 106–119 (2019).
5. Cao, D. et al. Fast whole brain MR imaging of dynamic susceptibility contrast changes in the cerebrospinal fluid (cDSC MRI). Magn. Reson. Med. 84, 3256–3270 (2020).
6. Jost, G. et al. Penetration and distribution of gadolinium-based contrast agents into the cerebrospinal fluid in healthy rats: a potential pathway of entry into the brain tissue. Eur. Radiol. 27, 2877–2885 (2017).
Figures