4111
Modeling Behavior, Functional Connectomics, and Proteomics in a Mouse Model of Alzheimer’s Disease1Neuroscience, BAYLOR COLLEGE OF MEDICINE, Houston, TX, United States, 2Integrative Physiology, BAYLOR COLLEGE OF MEDICINE, Houston, TX, United States
Synopsis
Keywords: Small Animals, Alzheimer's Disease, resting state fMRI, Functional Connectivity, Spatial Proteomics
Motivation: Alzheimer's Disease (AD) is a devastating neurodegenerative disease that affects 50 million people worldwide.
Goal(s): Advancements in neuroimaging techniques that can detect deficits prior to significant accumulation of pathology and cognitive decline would aid in early detection, diagnosis, and possible therapeutic intervention.
Approach: Resting state fMRI studies have identified early functional connectivity (FC) deficits in memory-related brain regions, preceding cognitive impairment, making it a promising clinical marker for AD.
Results: Using an AD mouse model, our study has identified unique patterns of FC changes across disease progression. Using machine learning we are working to establish relationships between neuroimaging and cognitive and proteomic changes.
Impact: This study aims to uncover dynamic alterations in functional connectivity and the link to cognitive and proteomic changes using a mouse model of Alzheimer's Disease. These findings offer potential insights for early detection and diagnostic advancements in Alzheimer's Disease research.
Introduction
Alzheimer's disease (AD) is a progressive neurodegenerative disease characterized by a gradual decline in cognitive function and memory. It is distinguished by the presence of abnormal protein aggregates, including amyloid beta (Aβ) plaques and neurofibrillary tau tangles, which disrupt neuronal function and ultimately lead to cell death1-3. AD is the leading cause of dementia worldwide, affecting nearly 50 million individuals4. Currently, the definitive diagnosis of AD requires post-mortem examination of brain tissue. In living patients, a probable AD diagnosis can be established through cognitive assessments, blood tests for plasma amyloid beta (Aβ), and PET imaging. While these tools combined form an effective diagnostic model, they are not capable of early AD detection5. Advancements in neuroimaging techniques capable of detecting deficits prior to significant pathological accumulation and cognitive decline would significantly aid in early detection, diagnosis, and potential therapeutic intervention. Resting state functional magnetic resonance imaging (rs-fMRI) has revealed deficits in functional connectivity in brain regions crucial for memory functions in both AD patients and mouse models. These deficits precede cognitive dysfunction, making rs-fMRI a promising clinical marker of AD6,7. Resting state functional connectivity (rsFC) assesses spontaneous, coordinated brain activity in the absence of external stimulation. Using fMRI, blood-oxygen-level-dependent (BOLD) signal fluctuations, reflecting neural activity, can be measured in various brain regions. Analyzing correlations in BOLD signals uncovers functional connections between regions8. This study aims to characterize alterations in functional connectivity (FC) and investigate the relationship between FC and cognitive decline in AD using the Cg-Tg(APPswe,PSEN1dE9)85Dbo mouse model (an Aβ mouse model of AD). Importantly, awake, unanesthetized imaging was employed to avoid potential confounding effects of anesthesia. To elucidate the mechanisms underlying changes in FC, NanoString technology was used to conduct proteomic analyses of nine distinct brain regions involved in learning and memory processes. These investigations were conducted at three age points: pre-plaque formation (3 months), initiation of plaque formation (6 months), and after extensive plaque formation (10 months) to gain a comprehensive understanding of disease progression.Methods
Morris Water Maze was used to test spatial memory performance. Mice underwent 2 blocks of 4 training trials per day for 4 days. Latency to escape was recorded. On Day 4, a probe trial assessed quadrant preference. Trajectories were tracked with EthoVision. To acclimate mice for awake imaging, mice underwent a five-day acclimation paradigm to the imaging holder and scanner environment. Acclimation times increased from 10 minutes on day 1 to 50 minutes on day 5. Imaging was performed using a 9.4T Bruker MRI. rs-fMRI assessed connectivity between 66 brain regions. Data was preprocessed in SPM v12, including realignment and warping to a template. CONN Toolbox v19 was used to quantify functional connectivity between all regions of interest. To perform spatial proteomics with Nanostring, animals were first cardiac perfused, brains were sectioned, frozen, and sent for analysis. GeoMx Mouse Protein Assays for NGS provided spatial proteomic data, utilizing oligotagged antibodies and morphology markers for ROI selection. Oligos were released upon UV exposure, then quantified using nCounter. (Figure 1)Results and Discussion
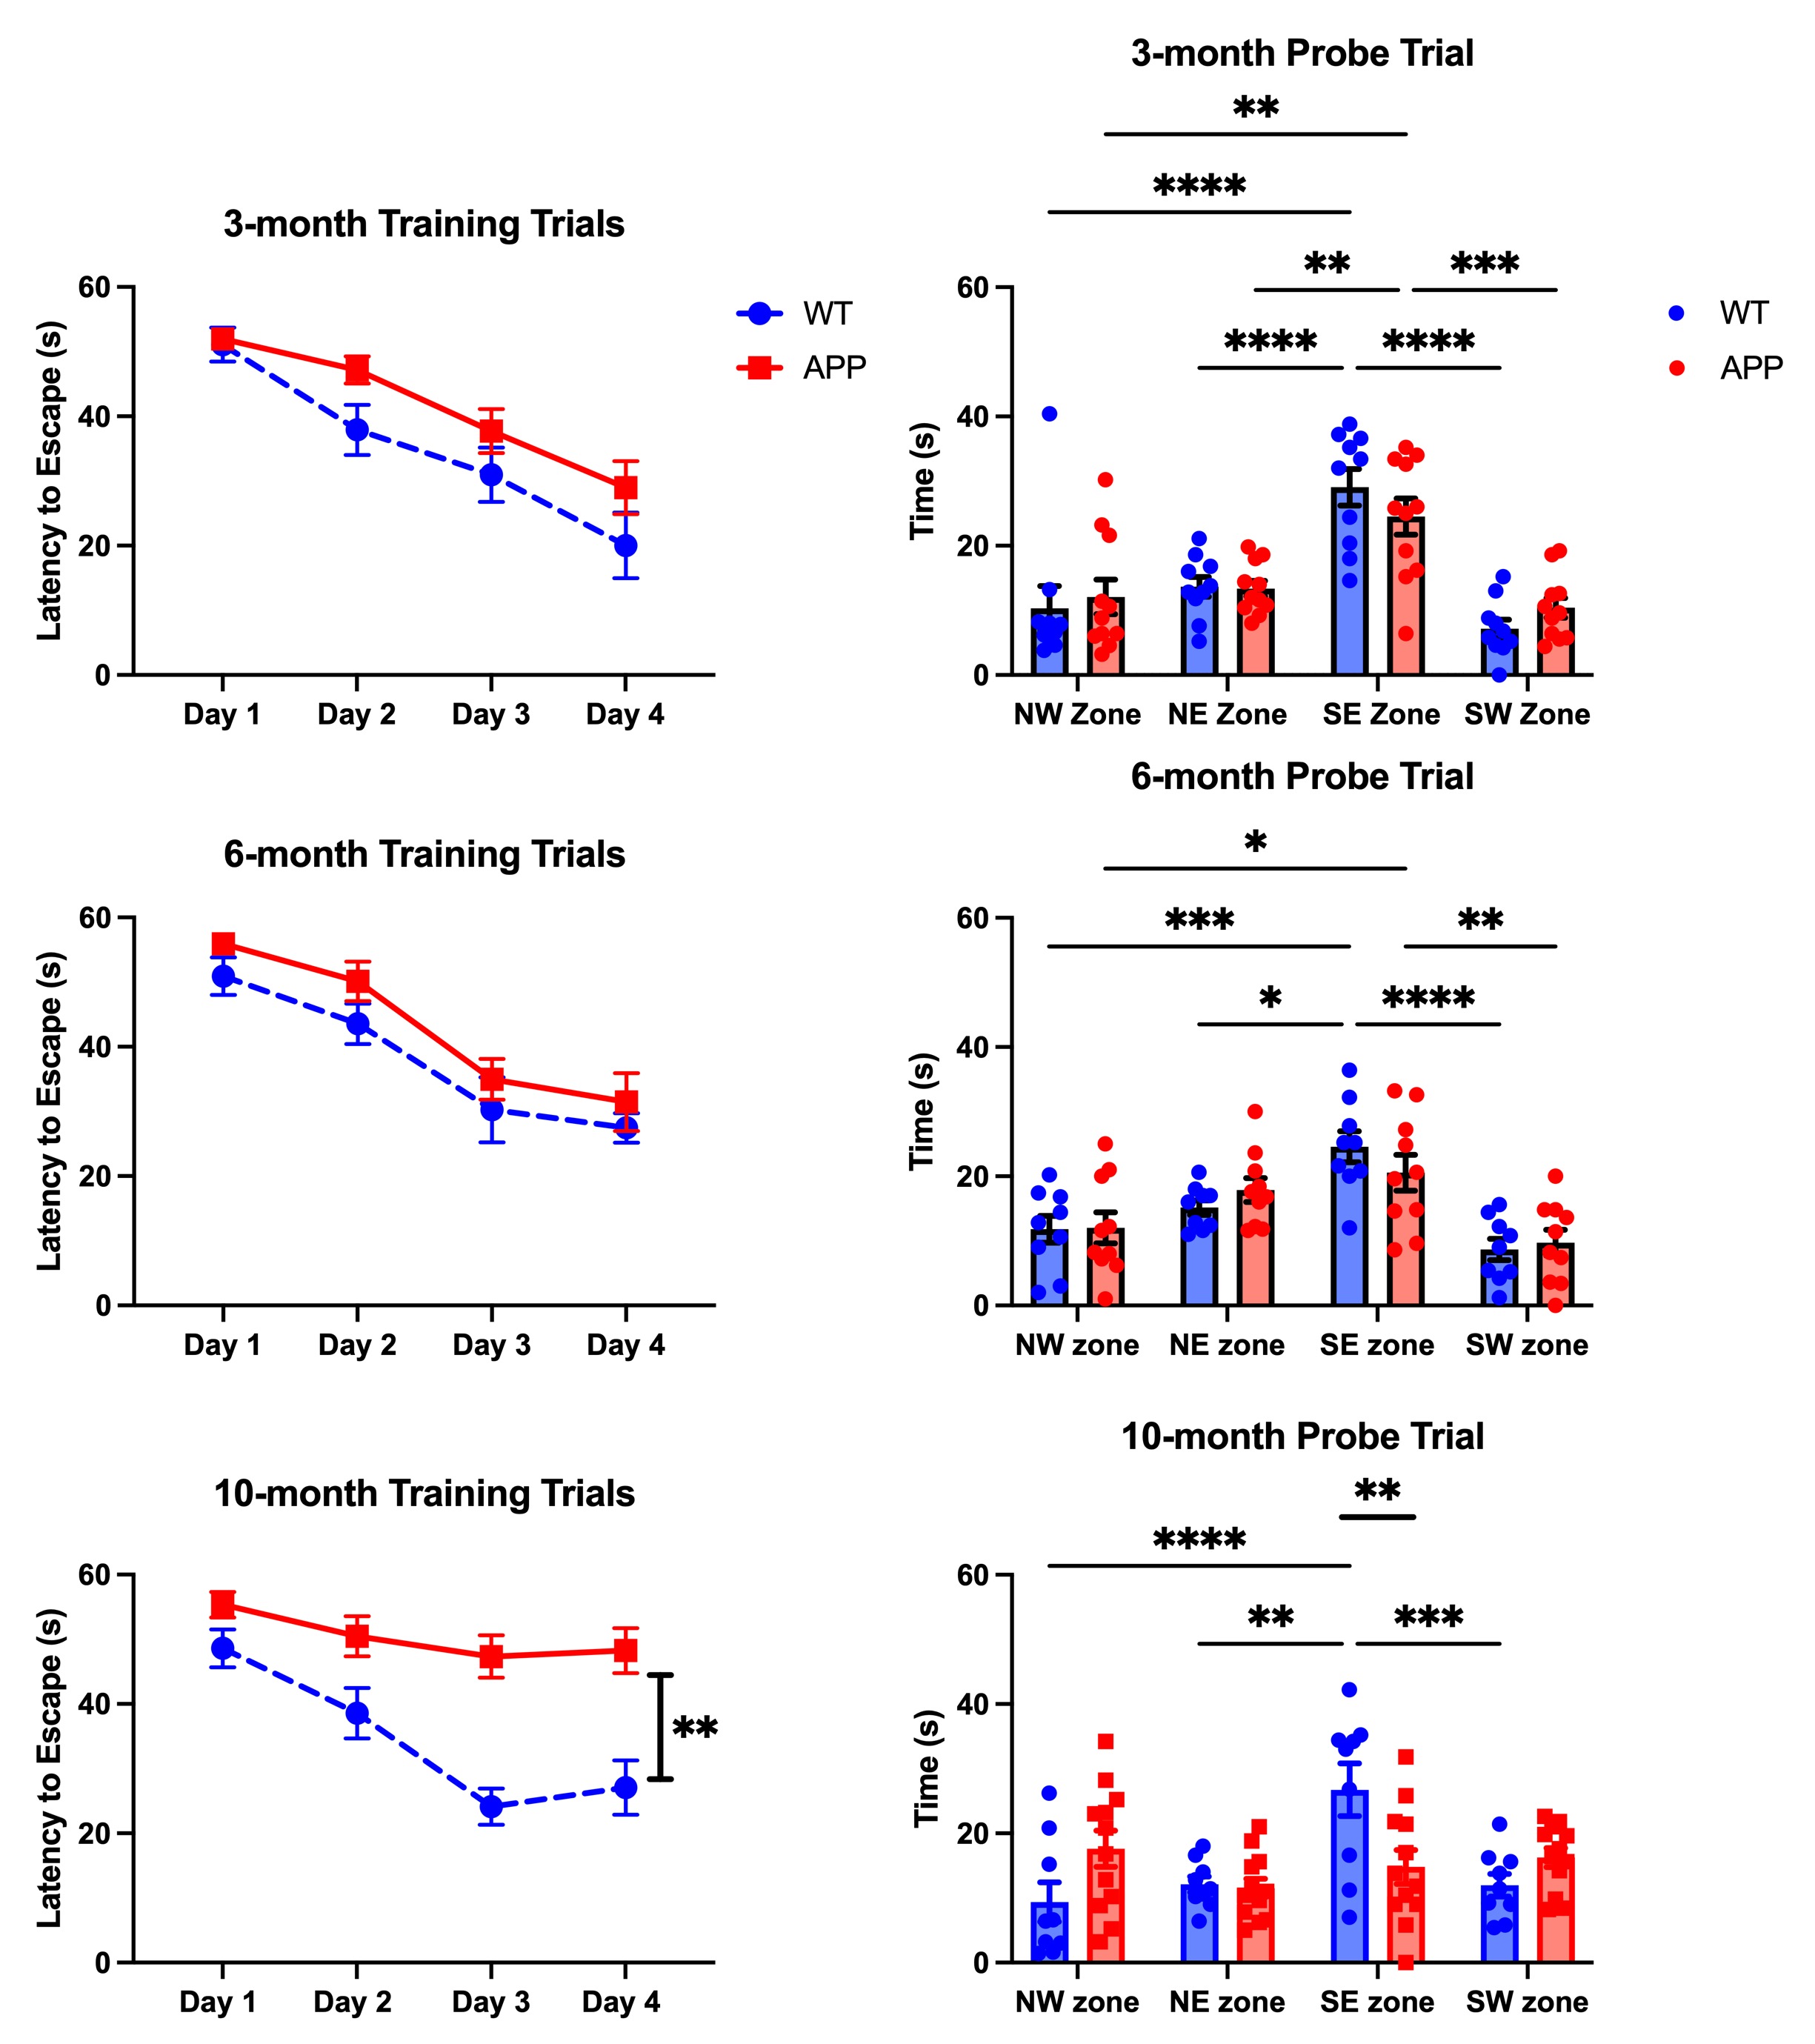
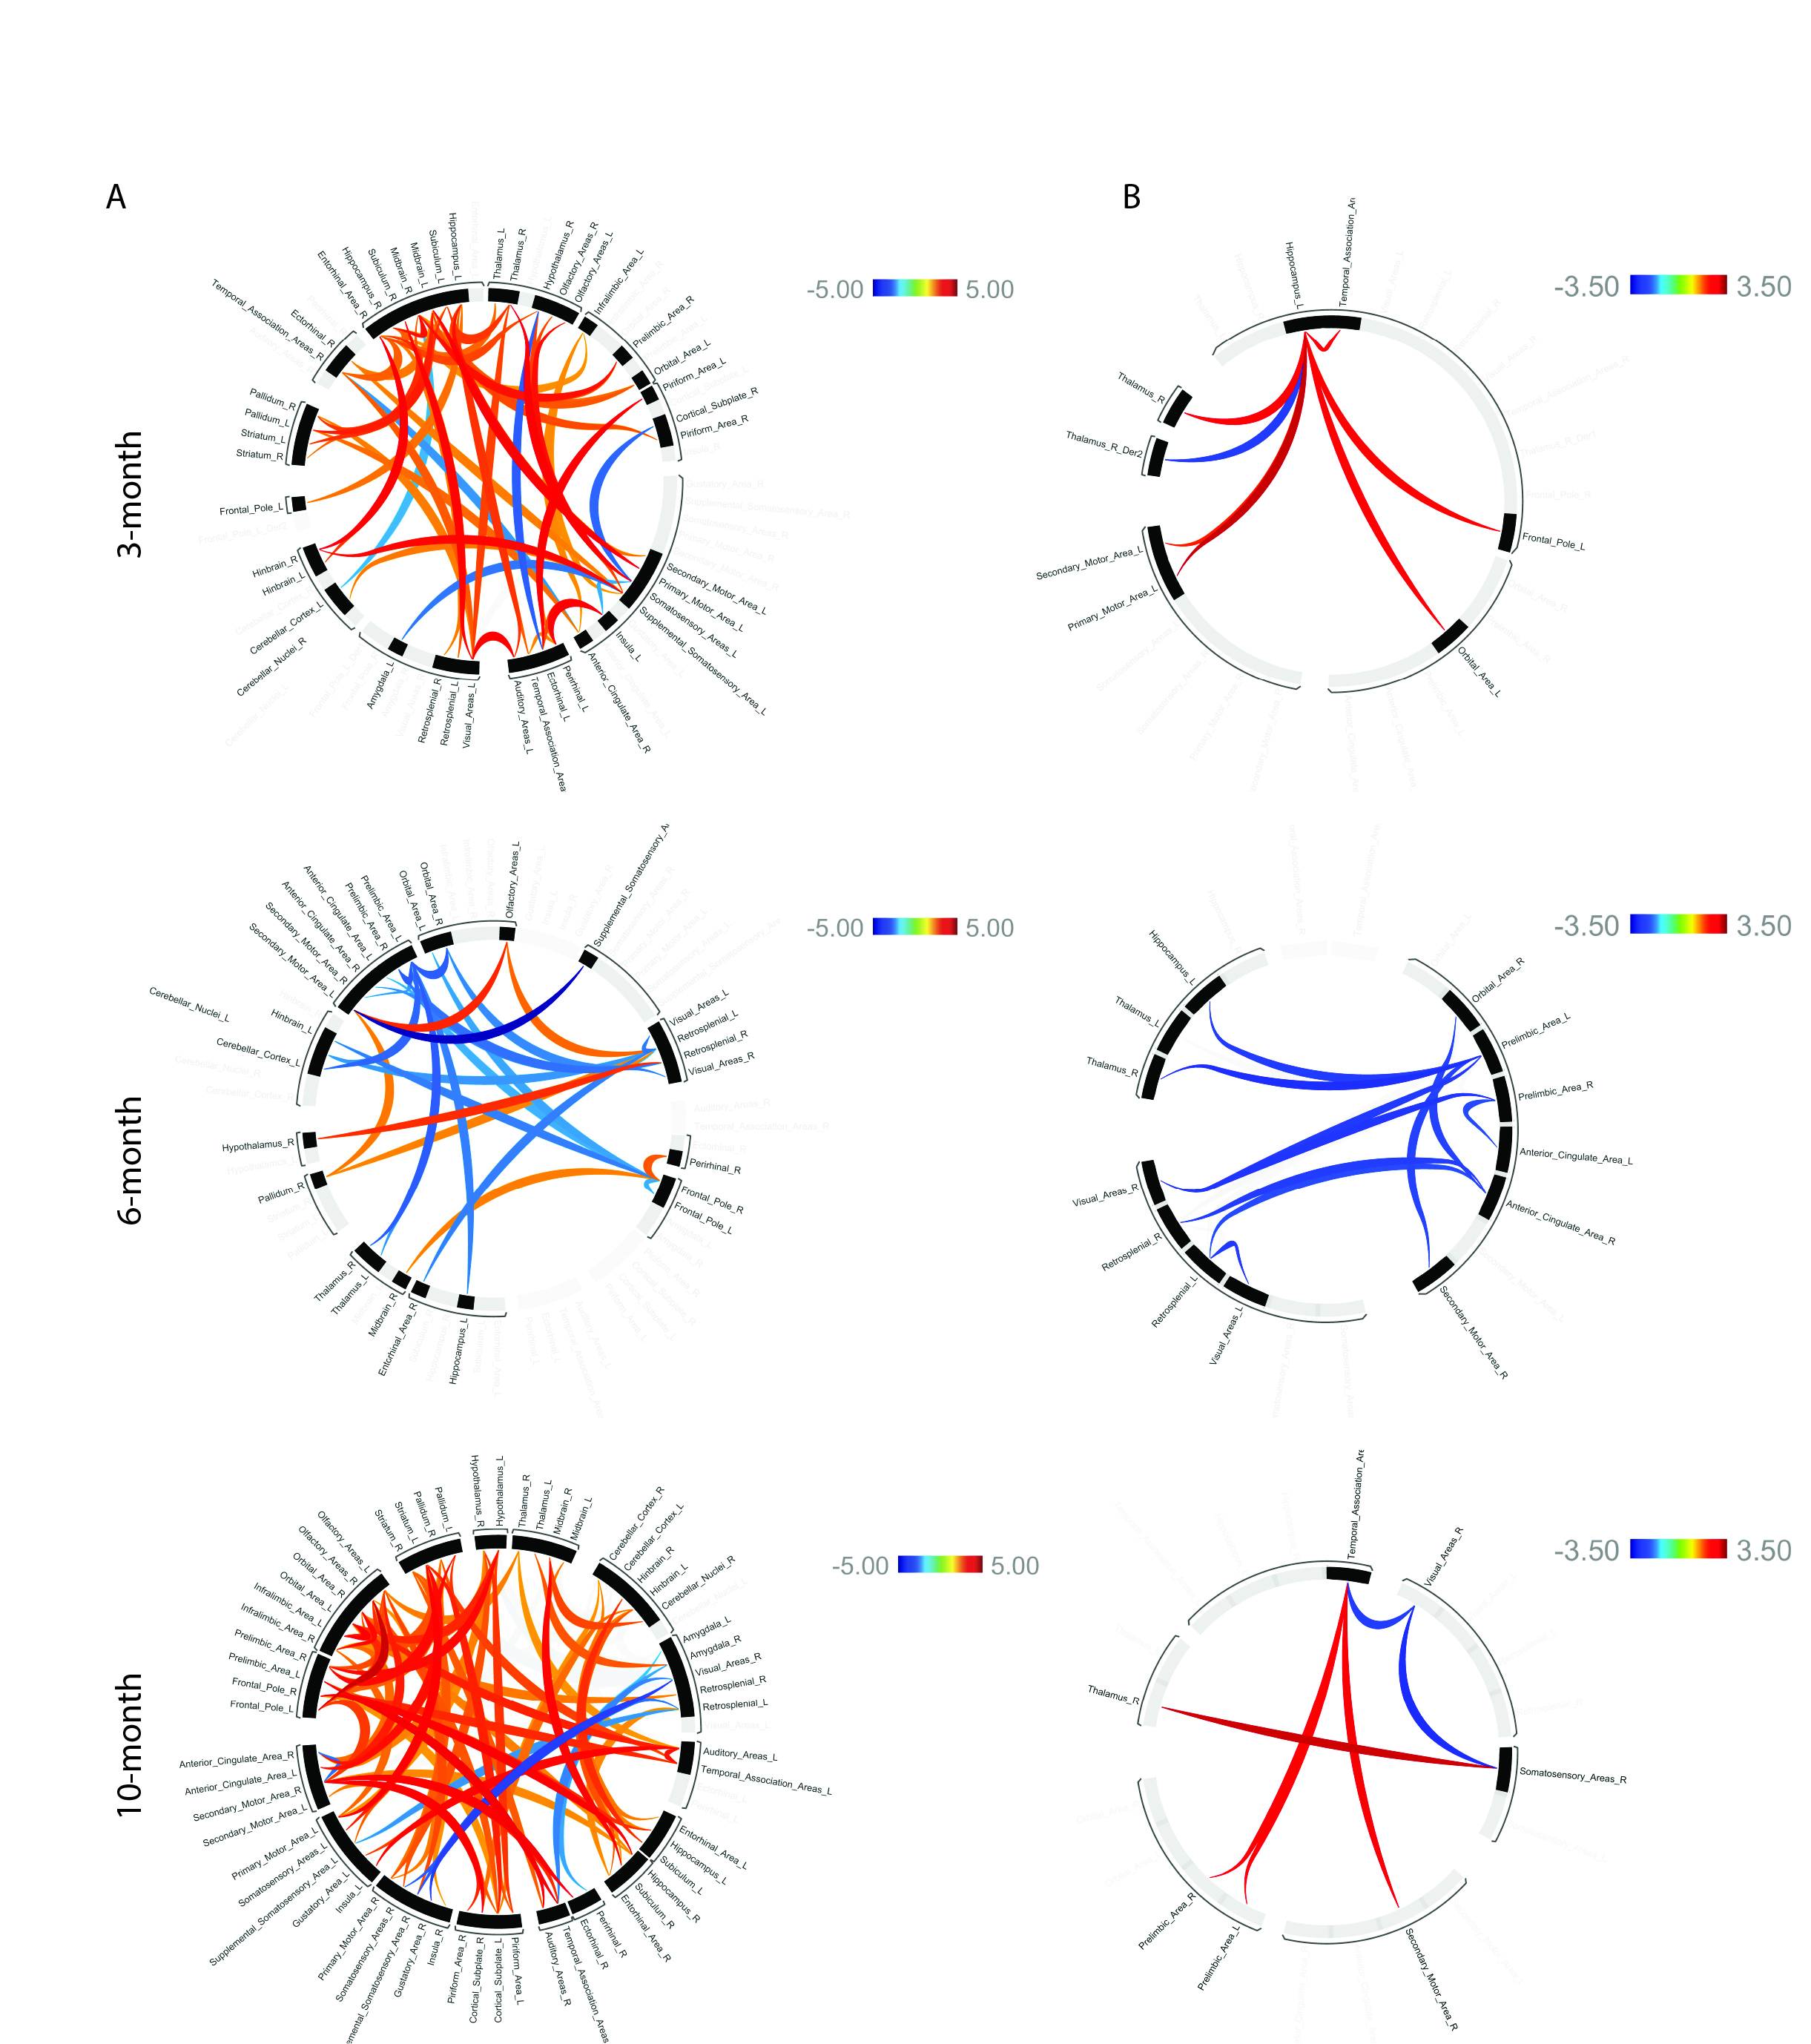
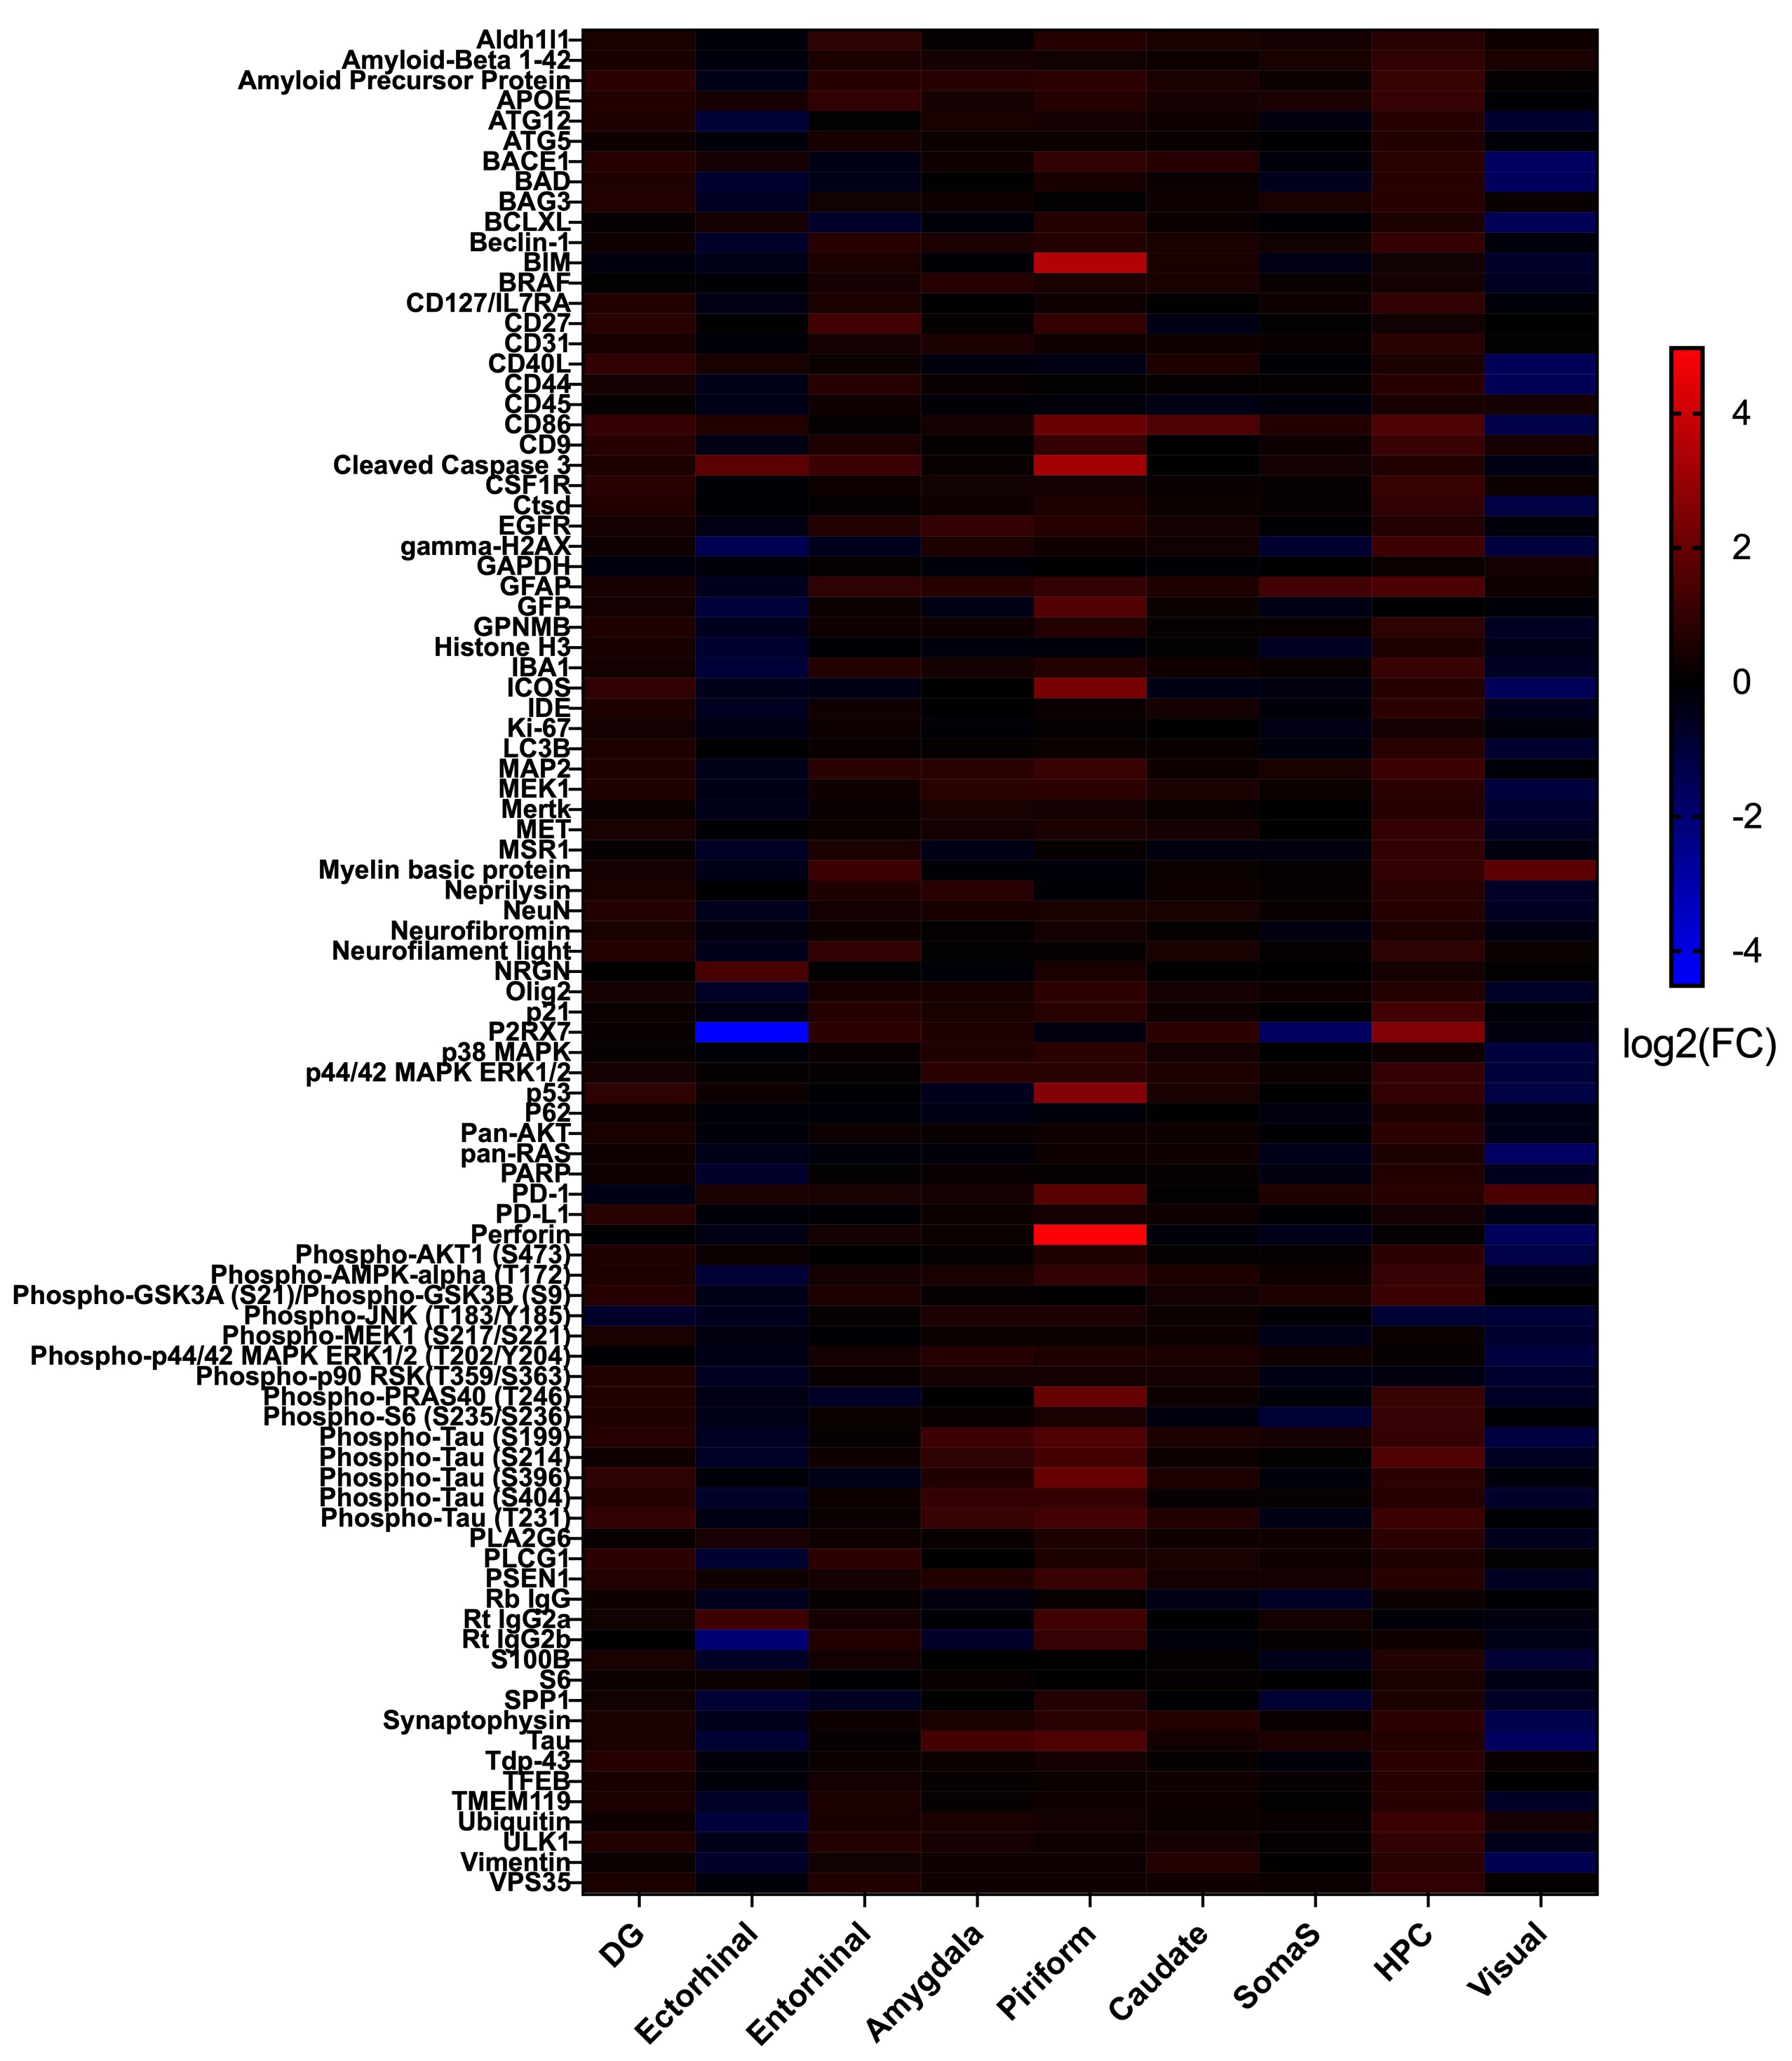
APP/PS1 and wildtype mice were tested for spatial learning deficits in the Morris Water Maze at 3, 6, and 10 months. Memory deficits emerged at 6 months and persisted at 10 months (Figure 2). Following behavioral tasks, the same mice underwent rs-fMRI to assess connectivity changes, focusing on learning/memory regions and the Default Mode Network (DMN), a network of regions more active during times of rest. The 3-month cohort showed hyperconnectivity in areas including the hippocampus, temporal association areas, and retrosplenial cortex and hypoconnectivity in the ectorhinal cortex and anterior cingulate cortex. The 6-month cohort exhibited hyperconnectivity in the hypothalamus and perirhinal cortex, and hypoconnectivity in the hippocampus, anterior cingulate cortex, and retrosplenial cortex. The 10-month cohort displayed hyperconnectivity in the hippocampus, retrosplenial cortex, and ectorhinal cortex, and hypoconnectivity in the amygdala, insula, and temporal association areas. Overall, hyperconnectivity was observed before plaque accumulation, shifting towards hypoconnectivity as plaques formed. After significant plaque formation at 10 months, hyperconnectivity reemerged (Figure 3A). These connectivity patterns were consistent in the analysis of the DMN (Figure 3B). Proteomic analysis of the 6-month cohort in nine memory-related brain regions revealed distinct protein expression profiles in APP/PS1 mice compared to controls in both AD pathology and immune response panels (Figure 4). Future work includes using machine learning to determine directional relationships from these readouts. For the first time, the relationship between behavior, functional connectivity, and proteomic profiles are being investigated in a mouse model of AD. This may lead to breakthroughs in early detection and clinical diagnostics for patients with AD.Acknowledgements
This project was funded by NIH R56AG071152 and supported by SAIF at Texas Children's Hospital.
Figure 1 created using Biorender.
References
1. Lopez, Jose A. Soria, Hector M. González, and Gabriel C. Léger. Alzheimer's disease. Handbook of clinical neurology 167 (2019): 231-255.
2. Selkoe, Dennis J. The molecular pathology of Alzheimer's disease. Neuron 6.4 (1991): 487-498.
3. DeTure, Michael A., and Dennis W. Dickson. The neuropathological diagnosis of Alzheimer’s disease. Molecular neurodegeneration 14.1 (2019): 1-18.
4. Kumar, Anil, et al. Alzheimer disease. (2018).
5. Atri, Alireza. The Alzheimer’s disease clinical spectrum: diagnosis and management. Medical Clinics 103.2 (2019): 263-293.
6. Shah, D. et al. Resting state FMRI reveals diminished functional connectivity in a mouse model of amyloidosis. PLoS One 8, e84241 (2013).
7. Greicius, M. D., Srivastava, G., Reiss, A. L. & Menon, V. Default-mode network activity distinguishes Alzheimer’s disease from healthy aging: evidence from functional MRI. Proc. Natl. Acad. Sci. USA 101, 4637–4642 (2004).
8. Logothetis, Nikos K., and Brian A. Wandell. Interpreting the BOLD signal. Annu. Rev. Physiol. 66 (2004): 735-769.
Figures
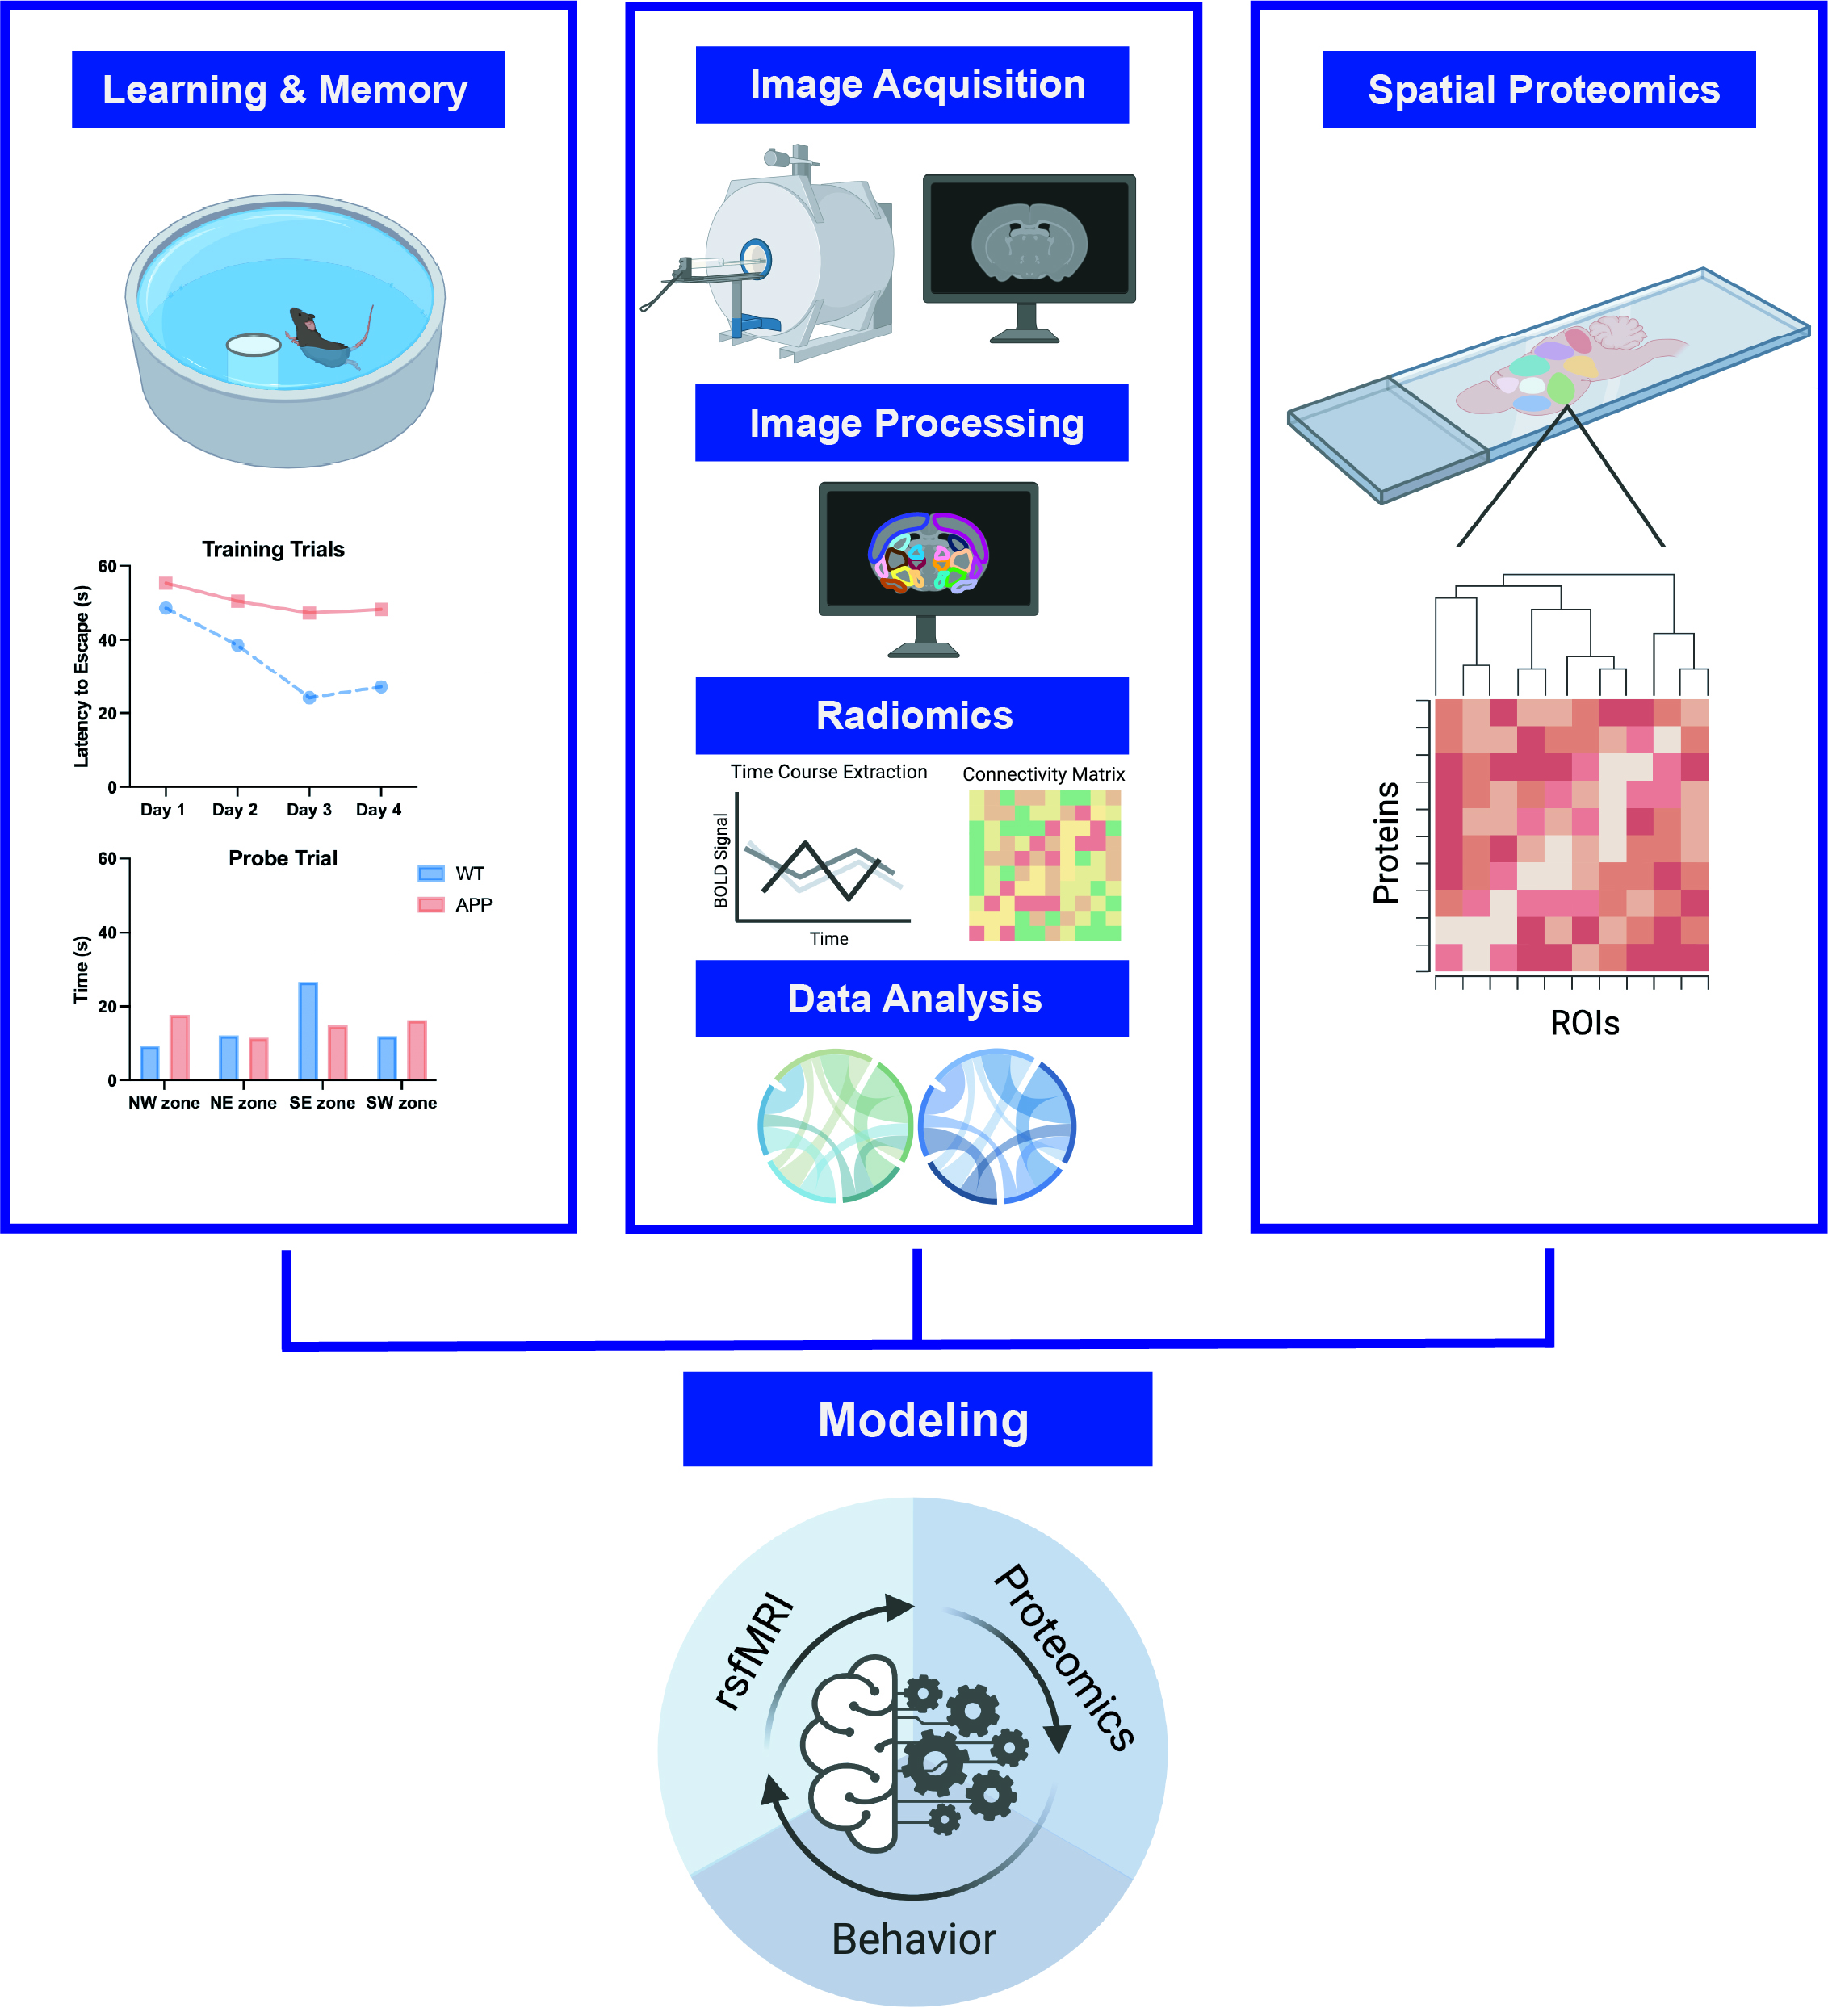
Figure 1: Methods Overview. Learning and memory assays, rs-fMRI, and spatial proteomics are performed in the same APP/PS1 mice and wild type controls. Morris Water Maze was conducted to test spatial memory, followed by rs-fMRI in awake mice to assess changes in functional connectivity and spatial proteomics in 9 memory-related regions of interest using NanoString technology. Using a machine learning model, the relationship between all variables will be assessed.