4110
Correlation between intra-axonal T2 and histological axon diameter in rat brain1Cardiff University Brain Research Imaging Centre (CUBRIC), Cardiff University, Cardiff, United Kingdom, 2Image Sciences Institute, University Medical Center Utrecht, Utrecht, Netherlands, 3Bioimaging and Flow Cytometry Facility, University of Leeds, Leeds, United Kingdom, 4Astbury CryoEM facility, Astbury Centre for Structural Molecular Biology, University of Leeds, Leeds, United Kingdom, 5University of Leeds Astbury Centre for Structural Molecular Biology and the School of Molecular and Cellular Biology, University of Leeds, Leeds, United Kingdom, 6Signal Processing Laboratory 5 (LTS5), Ecole Polytechnique Fédérale de Lausanne (EPFL), Lausanne, Switzerland, 7Leeds Institute of Cardiovascular and Metabolic Medicine, University of Leeds, Leeds, United Kingdom
Synopsis
Keywords: Biology, Models, Methods, Validation, Axon Diameter, Diffusion-Relaxation, Relaxometry, data analysis
Motivation: Alteration of the axon radii has been previously linked with neurodevelopmental disorders and neurologic pathologies. The possibility of resolving submicrometric axon diameter yields the potential to open new diagnostic avenues.
Goal(s): Validation of the previously presented surface-based relaxation model, assessing the feasibility of estimating axon diameter based on intra-axonal transverse relaxation times.
Approach: Correlating diffusion-relaxation MRI data acquired in an ex-vivo rat sample and axon diameter measures based on histology data in the Corpus Callosum.
Results: The results confirm the previously reported linear relationship between intra-axonal T2 and axon diameter as estimated based on histology.
Impact: This first direct validation experiment of the relationship between intra-axonal T2 and axon diameter employing a surface-based relaxation model could pave the way for a novel biomarker in neurological disease.
Introduction
In-vivo quantification of submicrometric axon diameters has been an attractive yet uniquely challenging endeavour. Alteration of the axon radii has been linked with multiple neurological pathologies1,2. State-of-the-art models based on diffusion MRI (dMRI)3–6 require strong diffusion gradients and have a practical resolution limit (~2µm)7. Recent work has proposed an alternative strategy relying on a surface-based relaxation mechanism8, where water molecules proximal to axonal membranes lose phase coherence, leading to faster signal attenuation9,10. In human brain, a linear relationship between intra-axonal T2 and inner axon radius8,11 was found. However, in previous studies, multiple in-vivo diffusion-T2 datasets were correlated to histology samples from a different post-mortem human brain. Here, to overcome previous limitations, we present a proof of concept pre-clinical study, combining ex vivo diffusion-relaxation MRI data and confocal microscopy data from the same samples, providing the first direct validation experiment of the relationship between intra-axonal T2 and axon diameterMethods
MRI data acquisition and analysis: One rat brain was perfusion fixed and embedded in agarose gel for MRI. All animal procedures were performed in accordance with United Kingdom Home Office authorization. Data were acquired on a Bruker Biospec 7T MRI scanner (Gmax = 1.5 T/m). An EPI diffusion-relaxation protocol was used varying TE = [60,75,90,105,120] ms and b-values = [0,50,1000,3000,30000] s/mm2 with 125$$$\times$$$125 µm in-plane resolution, matrix size 140$$$\times$$$140, and 600 µm slice thickness and TR = 2500 ms. A set of 150 diffusion encoding directions with two repetitions were used at b = 30000 s/mm2. The gradient duration was 8 ms and the separation was 20 ms. Assuming the b = 30000 s/mm2 suppresses the signal arising from the extracellular space, the intra-axonal T2 was computed from12 :$$ \bar{S}(\mathrm{TE}) = C_a \cdot e^{-\mathrm{TE}/\mathrm{T_2}} $$
where $$$\bar{S}$$$ is the directionally-averaged dMRI signal for each TE and $$$C_a$$$ is a constant.
Four Regions of Interest (ROIs) were manually drawn on the Corpus Callosum (CC) using the fractional anisotropy (FA) map with Fsleyes13, matching the CC sectors of the histology samples (Figure 1). Mean Intra-axonal T2 per ROI was used in the analysis.
Histology: 50 µm thick sagittal sections were cut on a Vibratome (VT1000S, Leica). Immunofluorescent labels were used to stain for neurofilaments (Neurofilament 160/200 monoclonal antibody Immunohistochemistry) and imaged on a confocal microscope with Airyscan (Zeiss Laser Scanning Microscope-880). Four fields of view (FOV) of 66.4$$$\times$$$66.4 µm were acquired along four regions of the CC (Figure 1). For each MRI ROI, two different FOVs were taken on different tissue slices. The inner axon radius was estimated on Maximum Intensity Projection images (Figure 1) based on the long axes of fitted ellipsoids in ImageJ14. The volume-weighted effective axon radius per ROI was estimated as8 $$$r_{eff}=\langle r^2 \rangle / \langle r \rangle $$$.
Correlation and calibration:
Using a surface-based relaxation model as described in8, we related the intra-axonal T2 and axon radius r:
$$\frac{1}{T_2} = \frac{1}{T_{2c}} + \frac{2 \rho}{r}, $$
where $$$T_{2c}$$$ is the cytoplasmic T2 and $$$\rho$$$ is the surface relaxation.
We first determine $$$T_{2c}$$$ and $$$\rho$$$ by correlating the intra-axonal T2 and histological radius from the histological sample “Histology 1”. Subsequently, we compared the estimated T2-based axon radius with the second histological sample “Histology 2”.
Results
Figure 2 shows the distributions of intra-axonal T2 times for each ROI and histological axon radius distributions for each FOV. The correlation coefficient for the model calibration (Figure 3) was 0.56 (p-value=0.4). The $$$T_{2c}$$$ was 176 ms, and the $$$\rho$$$ was 0.0011 µm/ms. The linear relationship between the histological and T2-based radii is depicted in Figure 4. The correlation coefficient was 0.49 (p-value=0.5). The predicted T2-based effective axon radius and the effective radii from the two histology samples are depicted in Figure 5.Discussion
We investigated, for the first time, the relationship between intra-axonal T2 and inner axon radius in a pre-clinical setting using diffusion-relaxation and histological data from the same sample. Overall, the results confirm the trend previously reported8,11, however, we observed some variability between T2-estimation and histological measurements of the inner radius, especially in ROI1 and ROI4, which could be due to partial volume effects. $$$T_{2c}$$$ and $$$\rho$$$ were found to be similar to in-vivo studies8,11. The radii determined by histology are well aligned with previous studies5,15. However, modest differences in the histological radii of the different CC regions could have challenged the calibration. This work presents a necessary step towards validating the surface-based relaxation model8. Future work should further elucidate the sources of variance and extend the experiment to more samples.Acknowledgements
This project was funded by Wellcome Trust PhD scholarship. CMWT was supported by the Dutch Research Council (NWO, 17331) and the Wellcome Trust (215944/Z/19/Z). We acknowledge the Bioimaging and Flow Cytometry Facility, Leeds for access to the LSM880 and Airyscan confocal microscope funded by Wellcome Trust WT104918MA. Erick J. Canales-Rodríguez was supported by the Swiss National Science Foundation (SNSF), Ambizione grant PZ00P2_185814.
References
1. Raven EP, Veraart J, Kievit RA, et al. In vivo evidence of microstructural hypo-connectivity of brain white matter in 22q11.2 deletion syndrome. Molecular Psychiatry 2023. July 2023:1-11. doi:10.1038/s41380-023-02178-w
2. Huang SY, Fan Q, Machado N, et al. Corpus callosum axon diameter relates to cognitive impairment in multiple sclerosis. Ann Clin Transl Neurol. 2019;6(5):882-892. doi:10.1002/ACN3.760
3. Assaf Y, Blumenfeld-Katzir T, Yovel Y, Basser PJ. Axcaliber: A method for measuring axon diameter distribution from diffusion MRI. Magn Reson Med. 2008;59(6):1347-1354. doi:10.1002/MRM.21577
4. Alexander DC, Hubbard PL, Hall MG, et al. Orientationally invariant indices of axon diameter and density from diffusion MRI. Neuroimage. 2010;52(4):1374-1389. doi:10.1016/J.NEUROIMAGE.2010.05.043
5. Veraart J, Nunes D, Rudrapatna U, et al. Noninvasive quantification of axon radii using diffusion MRI. Elife. 2020;9. doi:10.7554/ELIFE.49855
6. Pizzolato M, Canales-Rodríguez EJ, Andersson M, Dyrby TB. Axial and radial axonal diffusivities and radii from single encoding strongly diffusion-weighted MRI. Med Image Anal. 2023;86:102767. doi:10.1016/j.media.2023.102767
7. Dyrby TB, Søgaard L V., Hall MG, Ptito M, Alexander DC. Contrast and stability of the axon diameter index from microstructure imaging with diffusion MRI. Magn Reson Med. 2013;70(3):711-721. doi:10.1002/MRM.24501
8. Barakovic M, Pizzolato M, Tax CMW, et al. Estimating axon radius using diffusion-relaxation MRI: calibrating a surface-based relaxation model with histology. Front Neurosci. 2023;17:1209521. doi:10.3389/FNINS.2023.1209521
9. Zimmerman JR, Brittin WE. Nuclear magnetic resonance studies in multiple phase systems: Lifetime of a water molecule in an adsorbing phase on silica gel. Journal of Physical Chemistry. 1957;61(10):1328-1333. doi:10.1021/J150556A015/ASSET/J150556A015.FP.PNG_V03
10. Brownstein KR, Tarr CE. Spin-lattice relaxation in a system governed by diffusion. Journal of Magnetic Resonance (1969). 1977;26(1):17-24. doi:10.1016/0022-2364(77)90230-X
11. Dell’Acqua VP, Tax CMW, Molendowska M, et al. Assessing the robustness of the correlation between intra-axonal T2 and axon diameter across participants. In: Proc. Intl. Soc. Mag. Reson. Med. 31. 2023:2028.
12. McKinnon ET, Jensen JH. Measuring intra-axonal T2 in white matter with direction-averaged diffusion MRI. Magn Reson Med. 2019;81(5):2985-2994. doi:10.1002/MRM.27617
13. Smith SM, Jenkinson M, Woolrich MW, et al. Advances in functional and structural MR image analysis and implementation as FSL. Neuroimage. 2004;23(SUPPL. 1):S208-S219. doi:10.1016/J.NEUROIMAGE.2004.07.051
14. Schneider CA, Rasband WS, Eliceiri KW. NIH Image to ImageJ: 25 years of image analysis. Nature Methods 2012 9:7. 2012;9(7):671-675. doi:10.1038/nmeth.2089
15. Kim JHY, Ellman A, Juraska JM. A re-examination of sex differences in axon density and number in the splenium of the rat corpus callosum. Brain Res. 1996;740(1-2):47-56. doi:10.1016/S0006-8993(96)00637-3
Figures
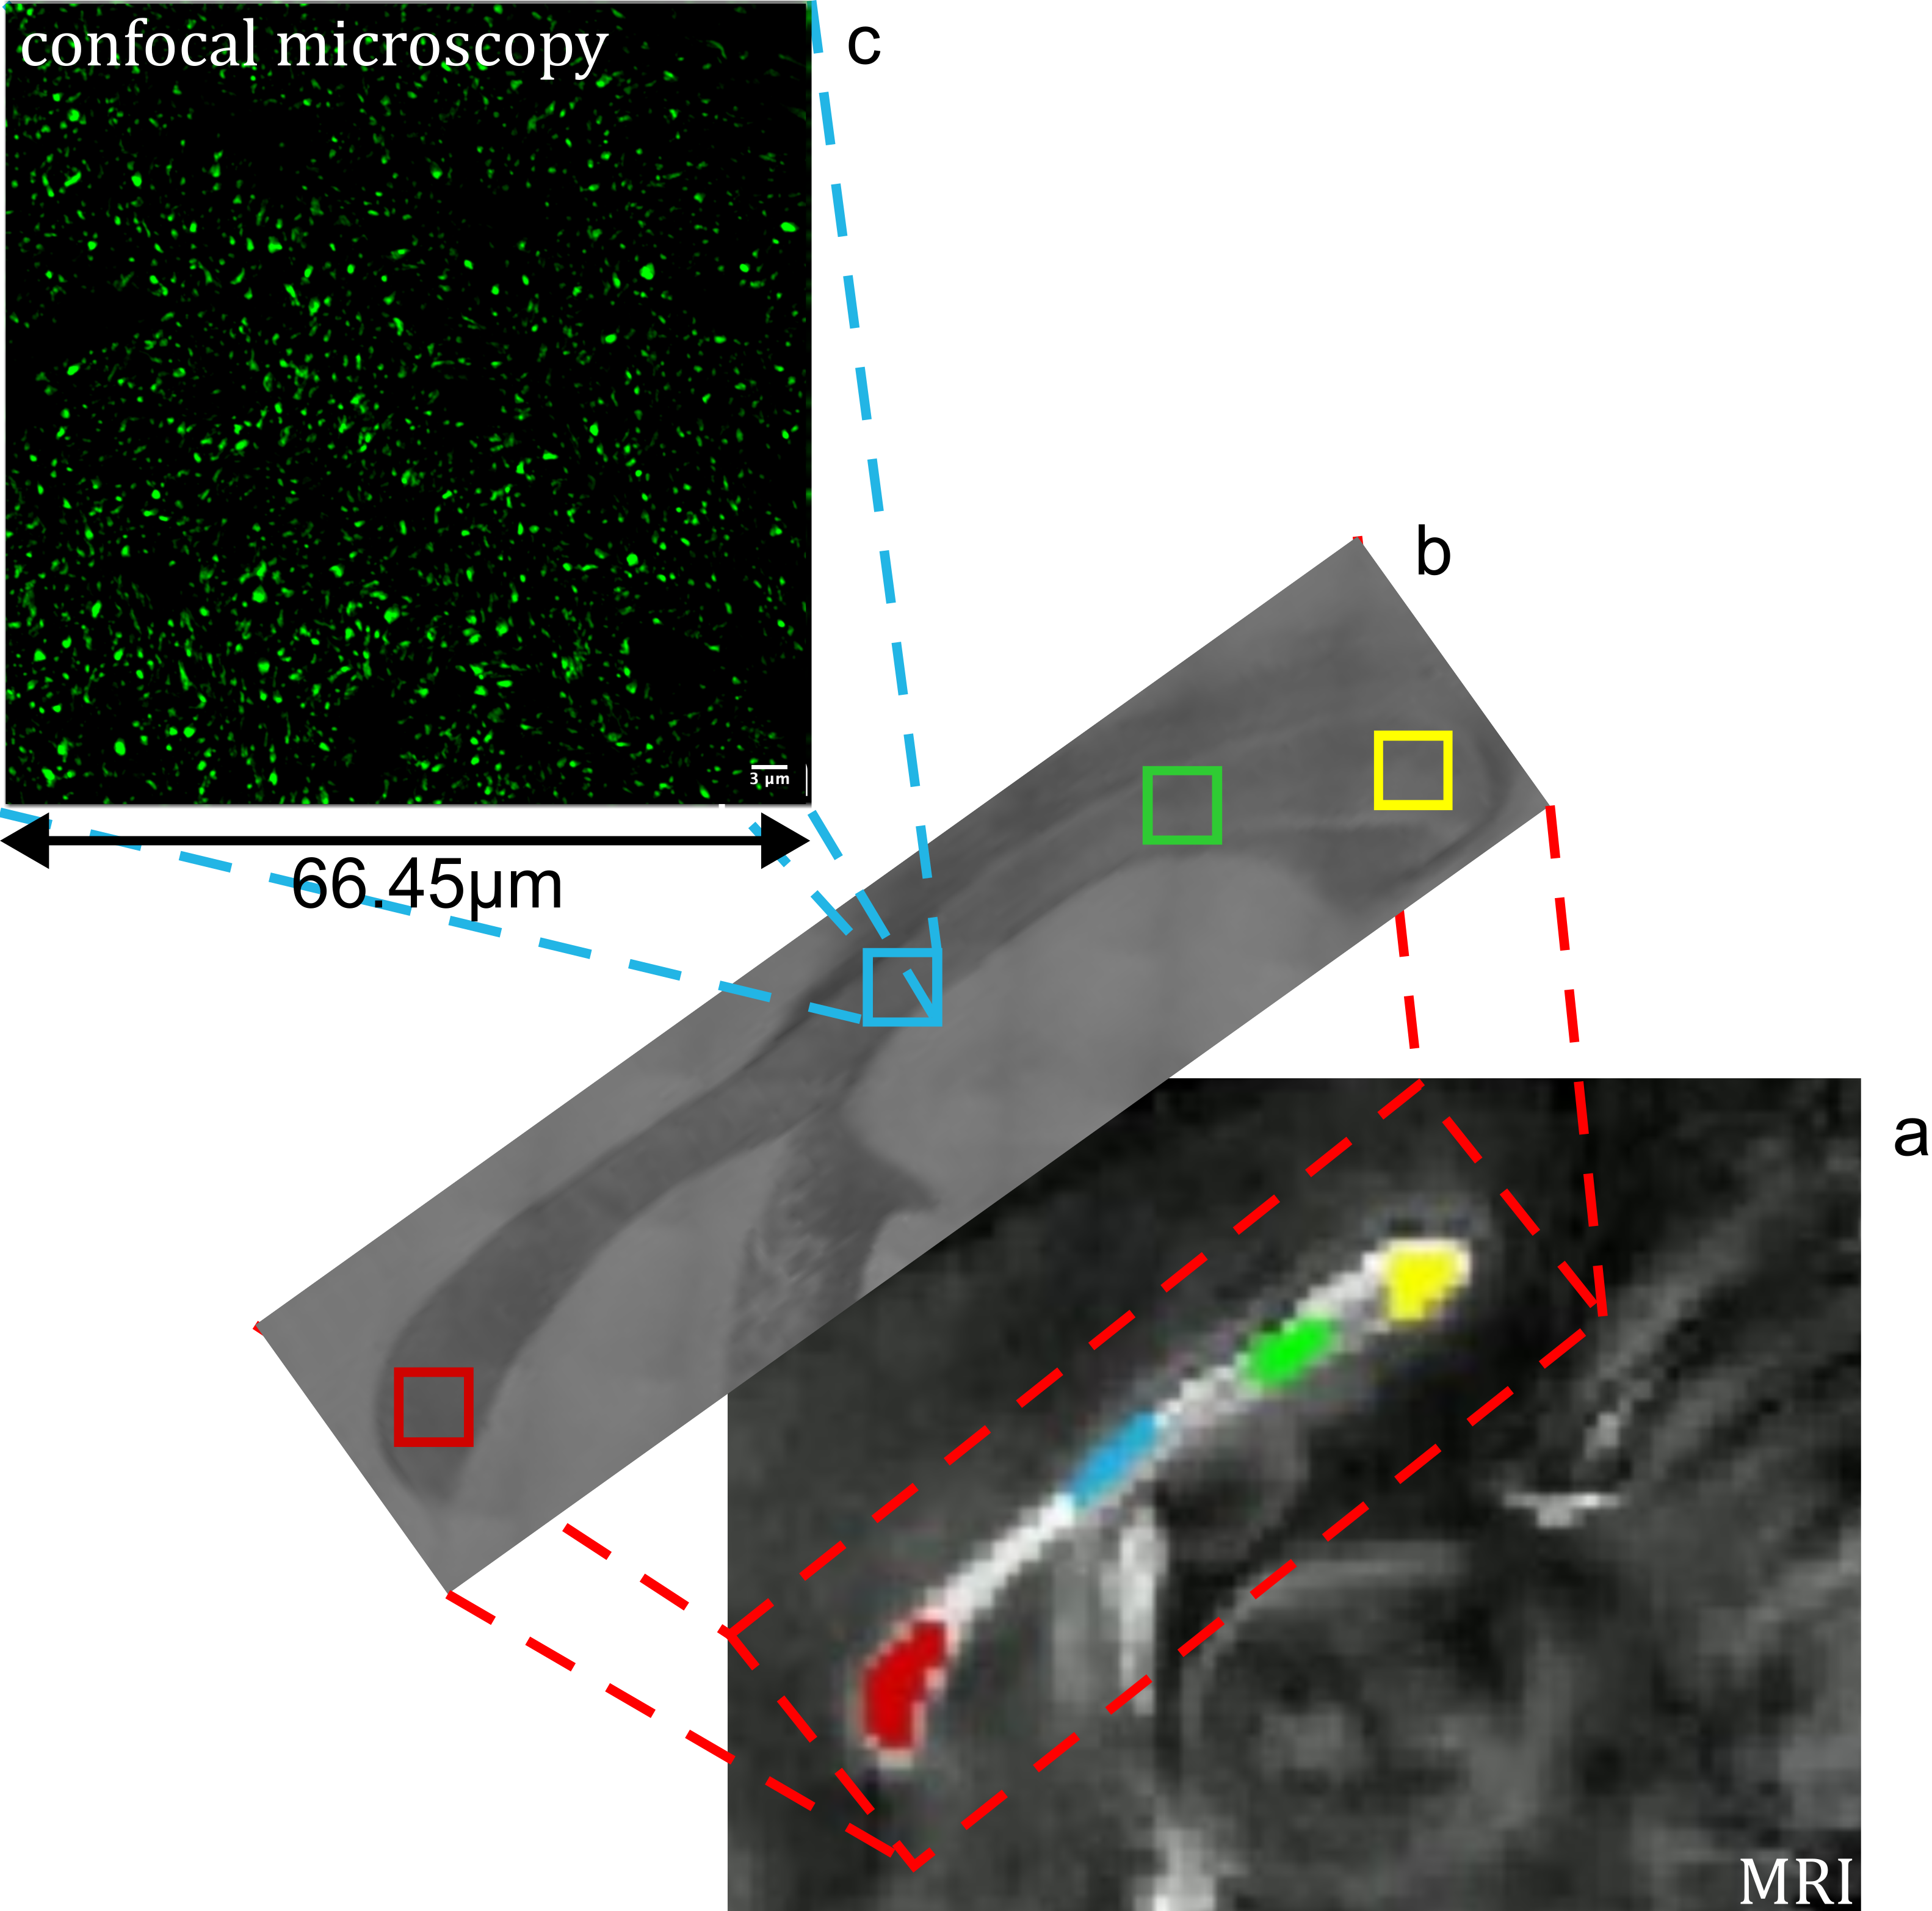
Figure 1. a) Representation of the Corpus Callosum (CC) and relative ROIs manually drawn on the FA map matching the histologically sampled regions. From left to right: ROI1 (Front CC) in red; ROI2 in light-blue; ROI3 in green; ROI4 (back CC) in yellow; b) Representation of the 4 Fields of view selected on a low-resolution confocal microscopy image; c) Example of neurofilaments staining used as a proxy for the relative inner axon radius.
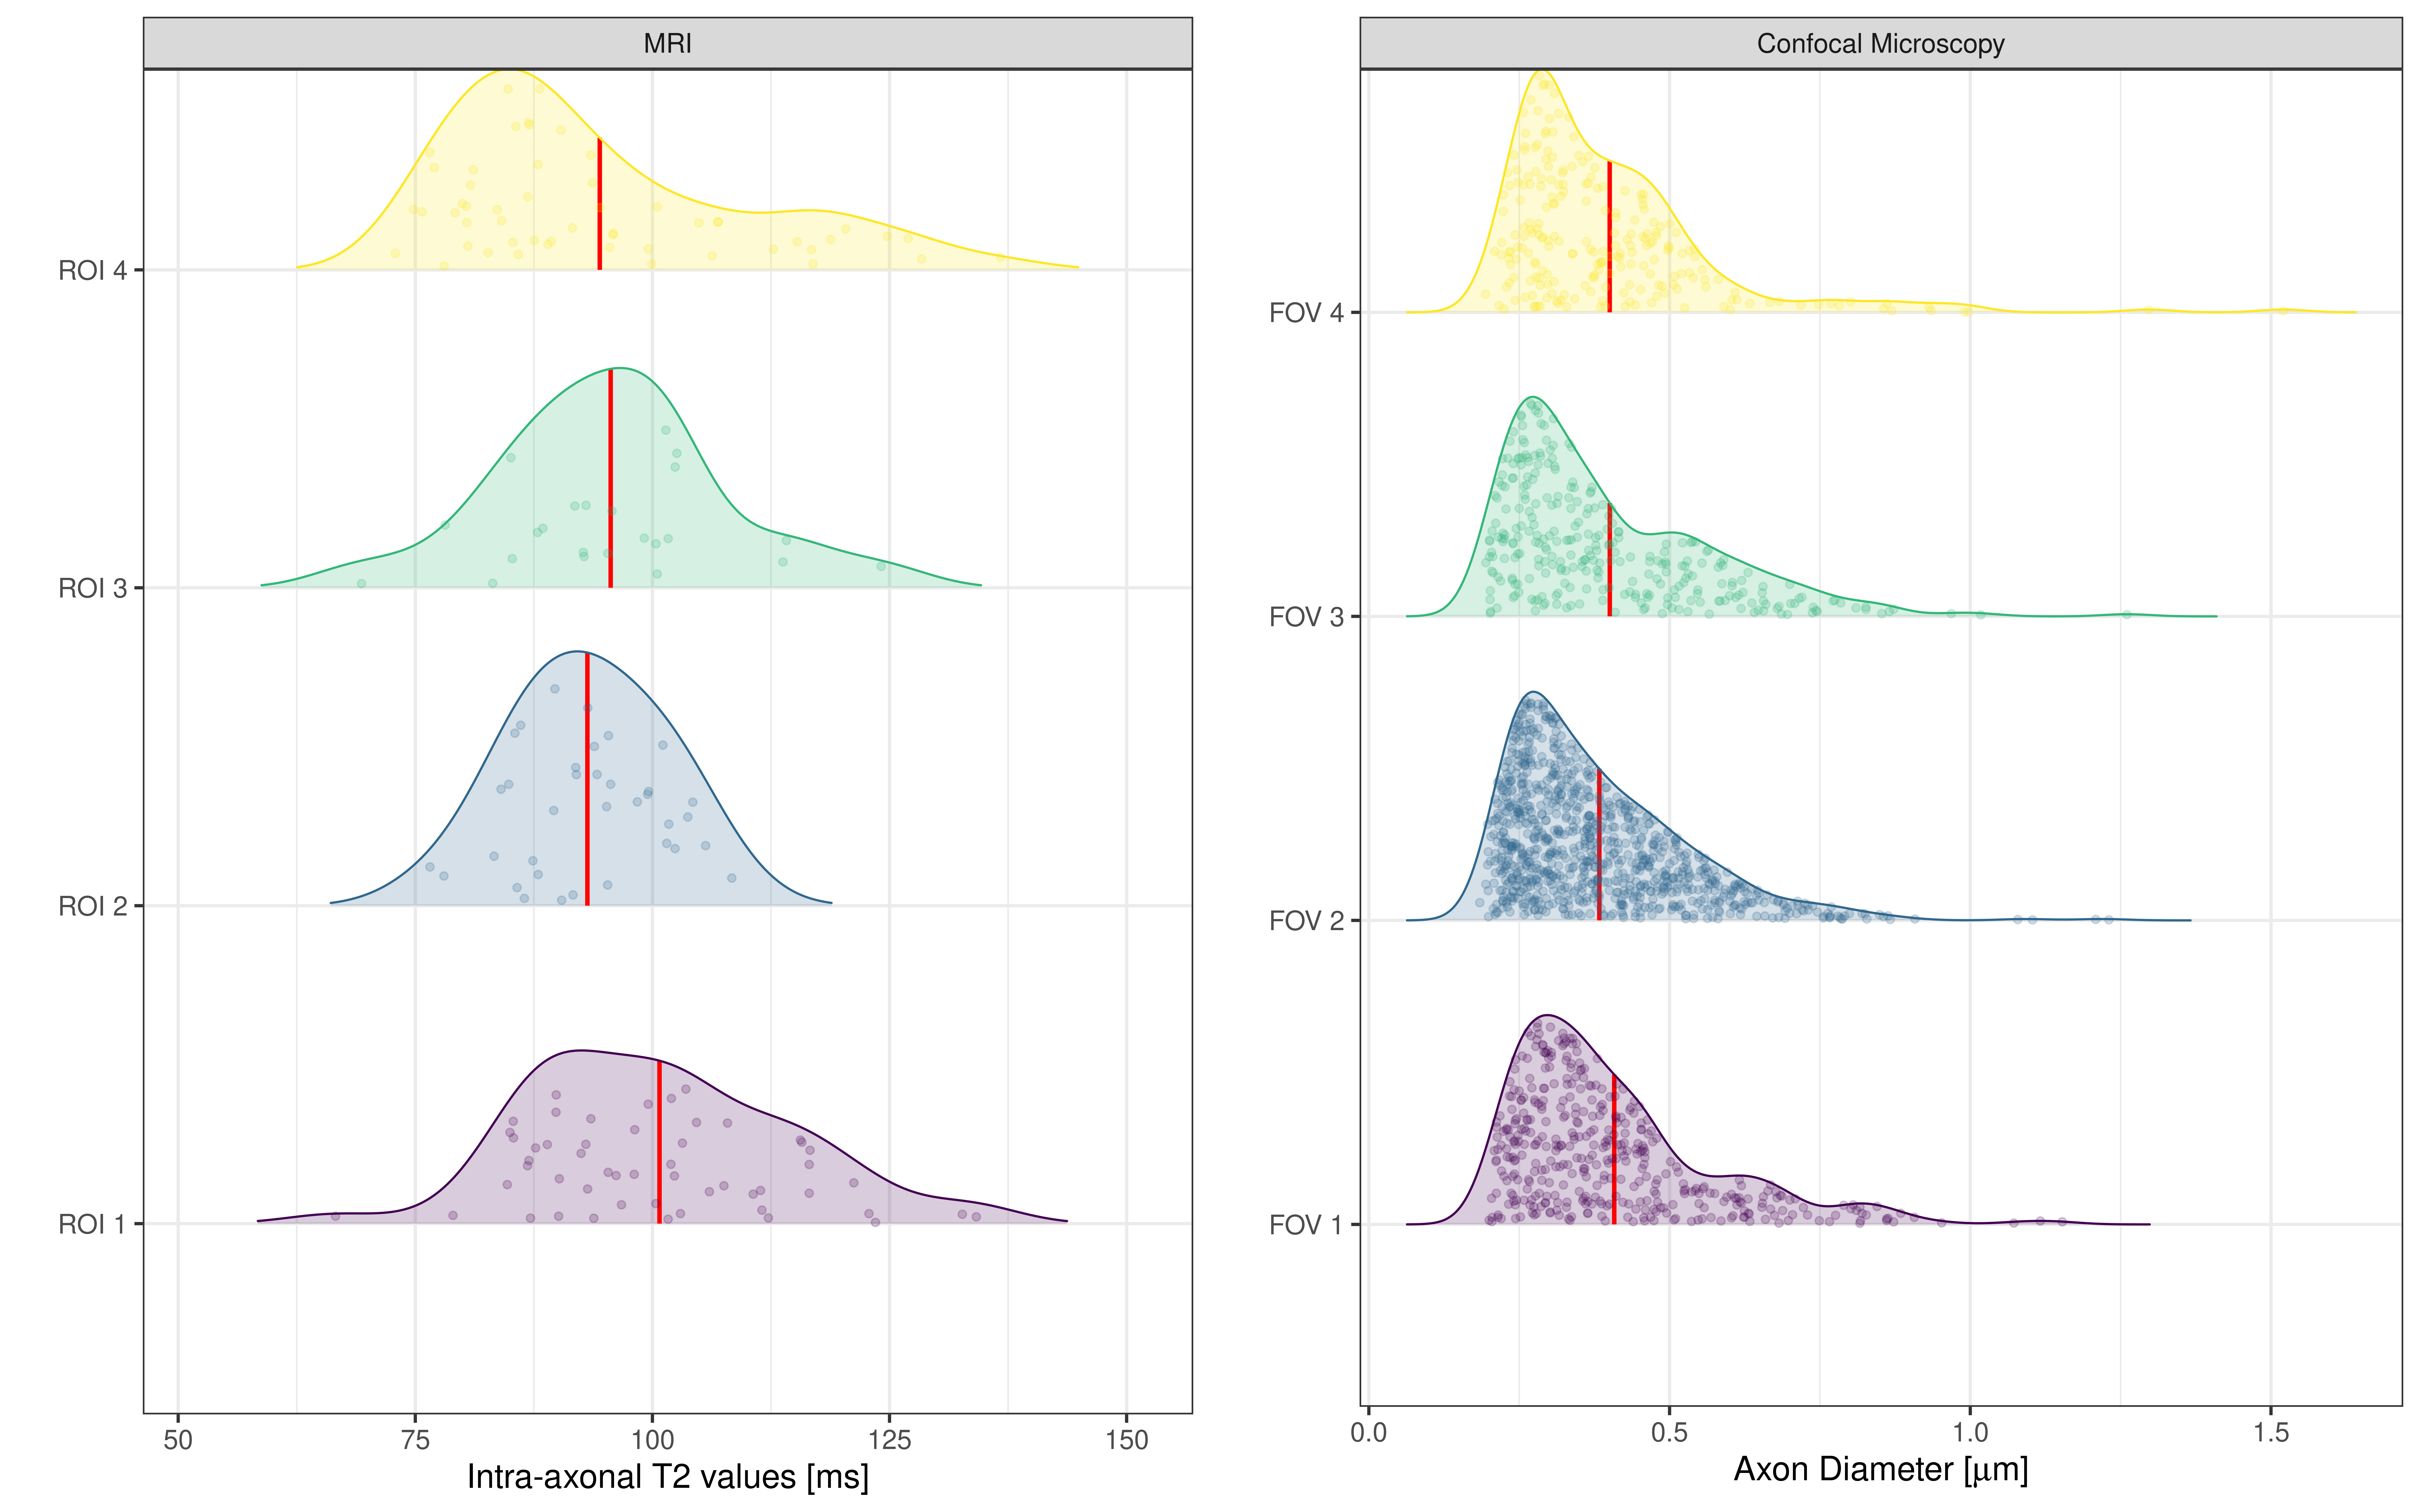
Figure 2. Intra-axonal T2 distribution for each MRI ROI and axon radius distribution for each FOV of the first histological sample used to calibrate the model. Mid-lines indicate the mean values, single dots represent individual voxels for the MRI and individual measurement of axon radii for the confocal microscopy.
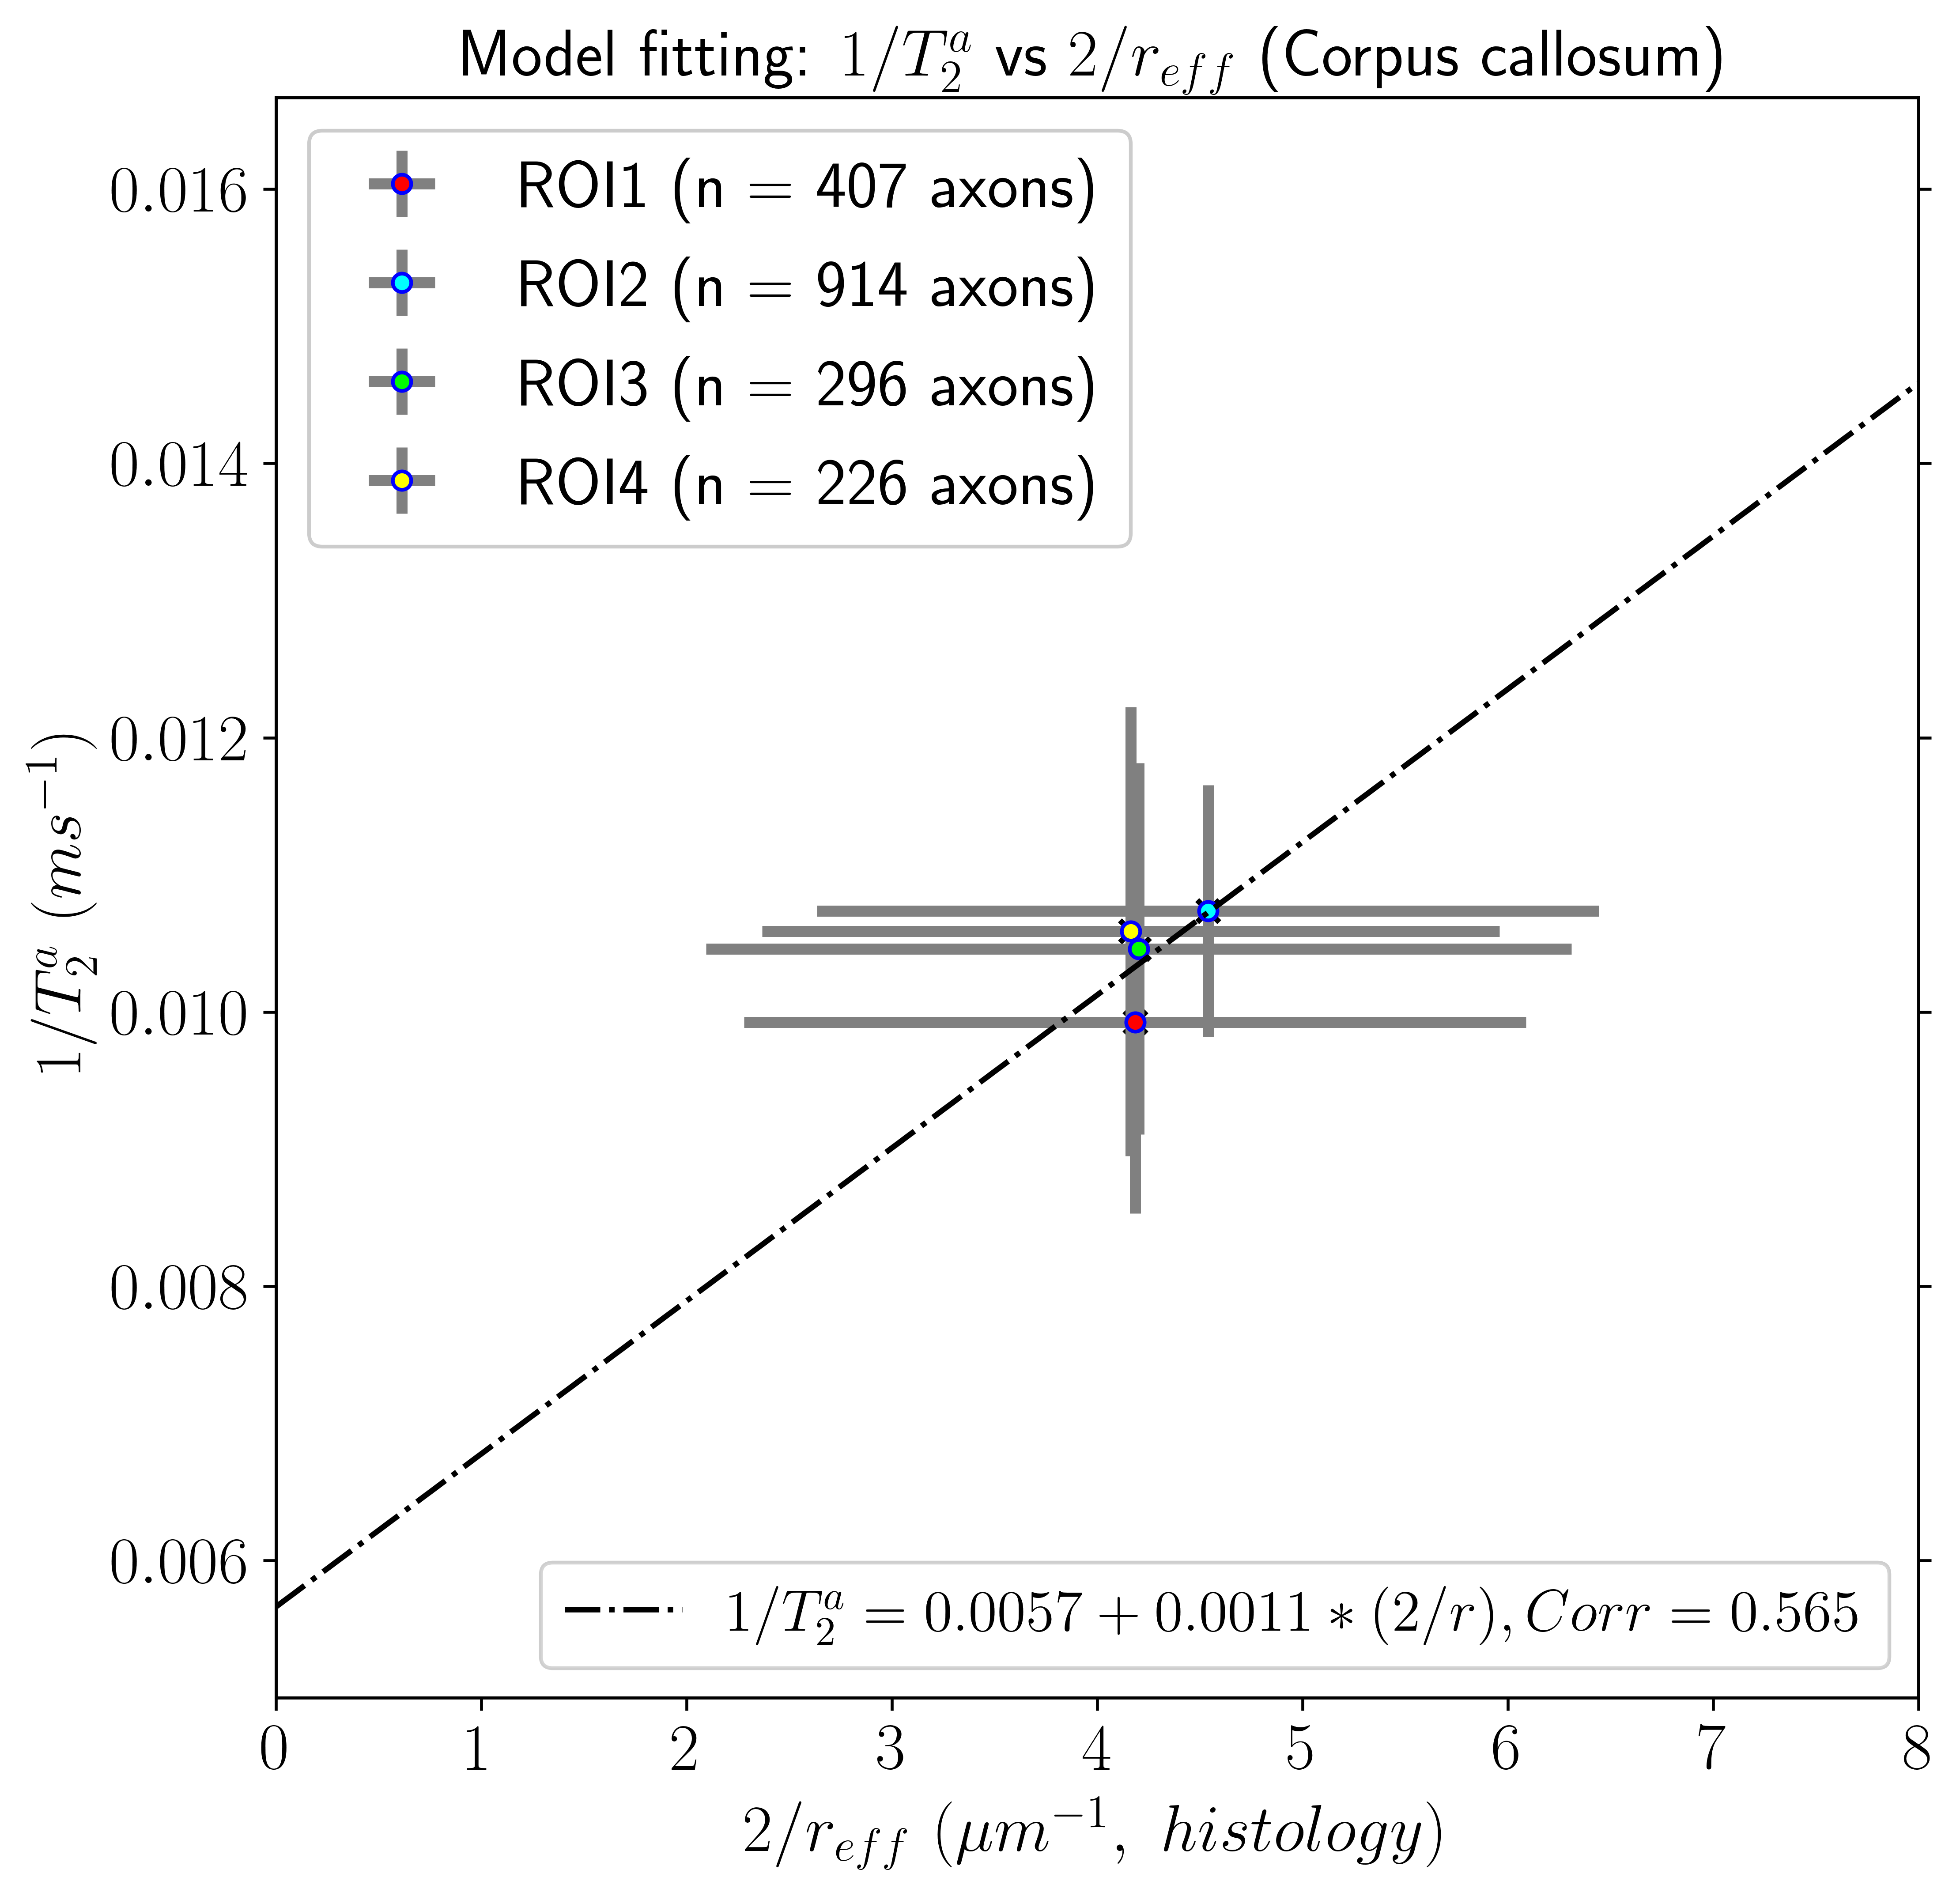
Figure 3. Linear fitting between the inverse of the intra-axonal T2 times (y-axis) and the inverse of the axon radius (x-axis) measured from histological data. The scatter plot depicts the mean values. Vertical error bars represent the intra-axonal T2 standard deviation per ROI; horizontal error bars represent the standard deviation of the histological inner axon radius (Histology 1). The number of axons measured for each CC region in the histology sample is displayed.
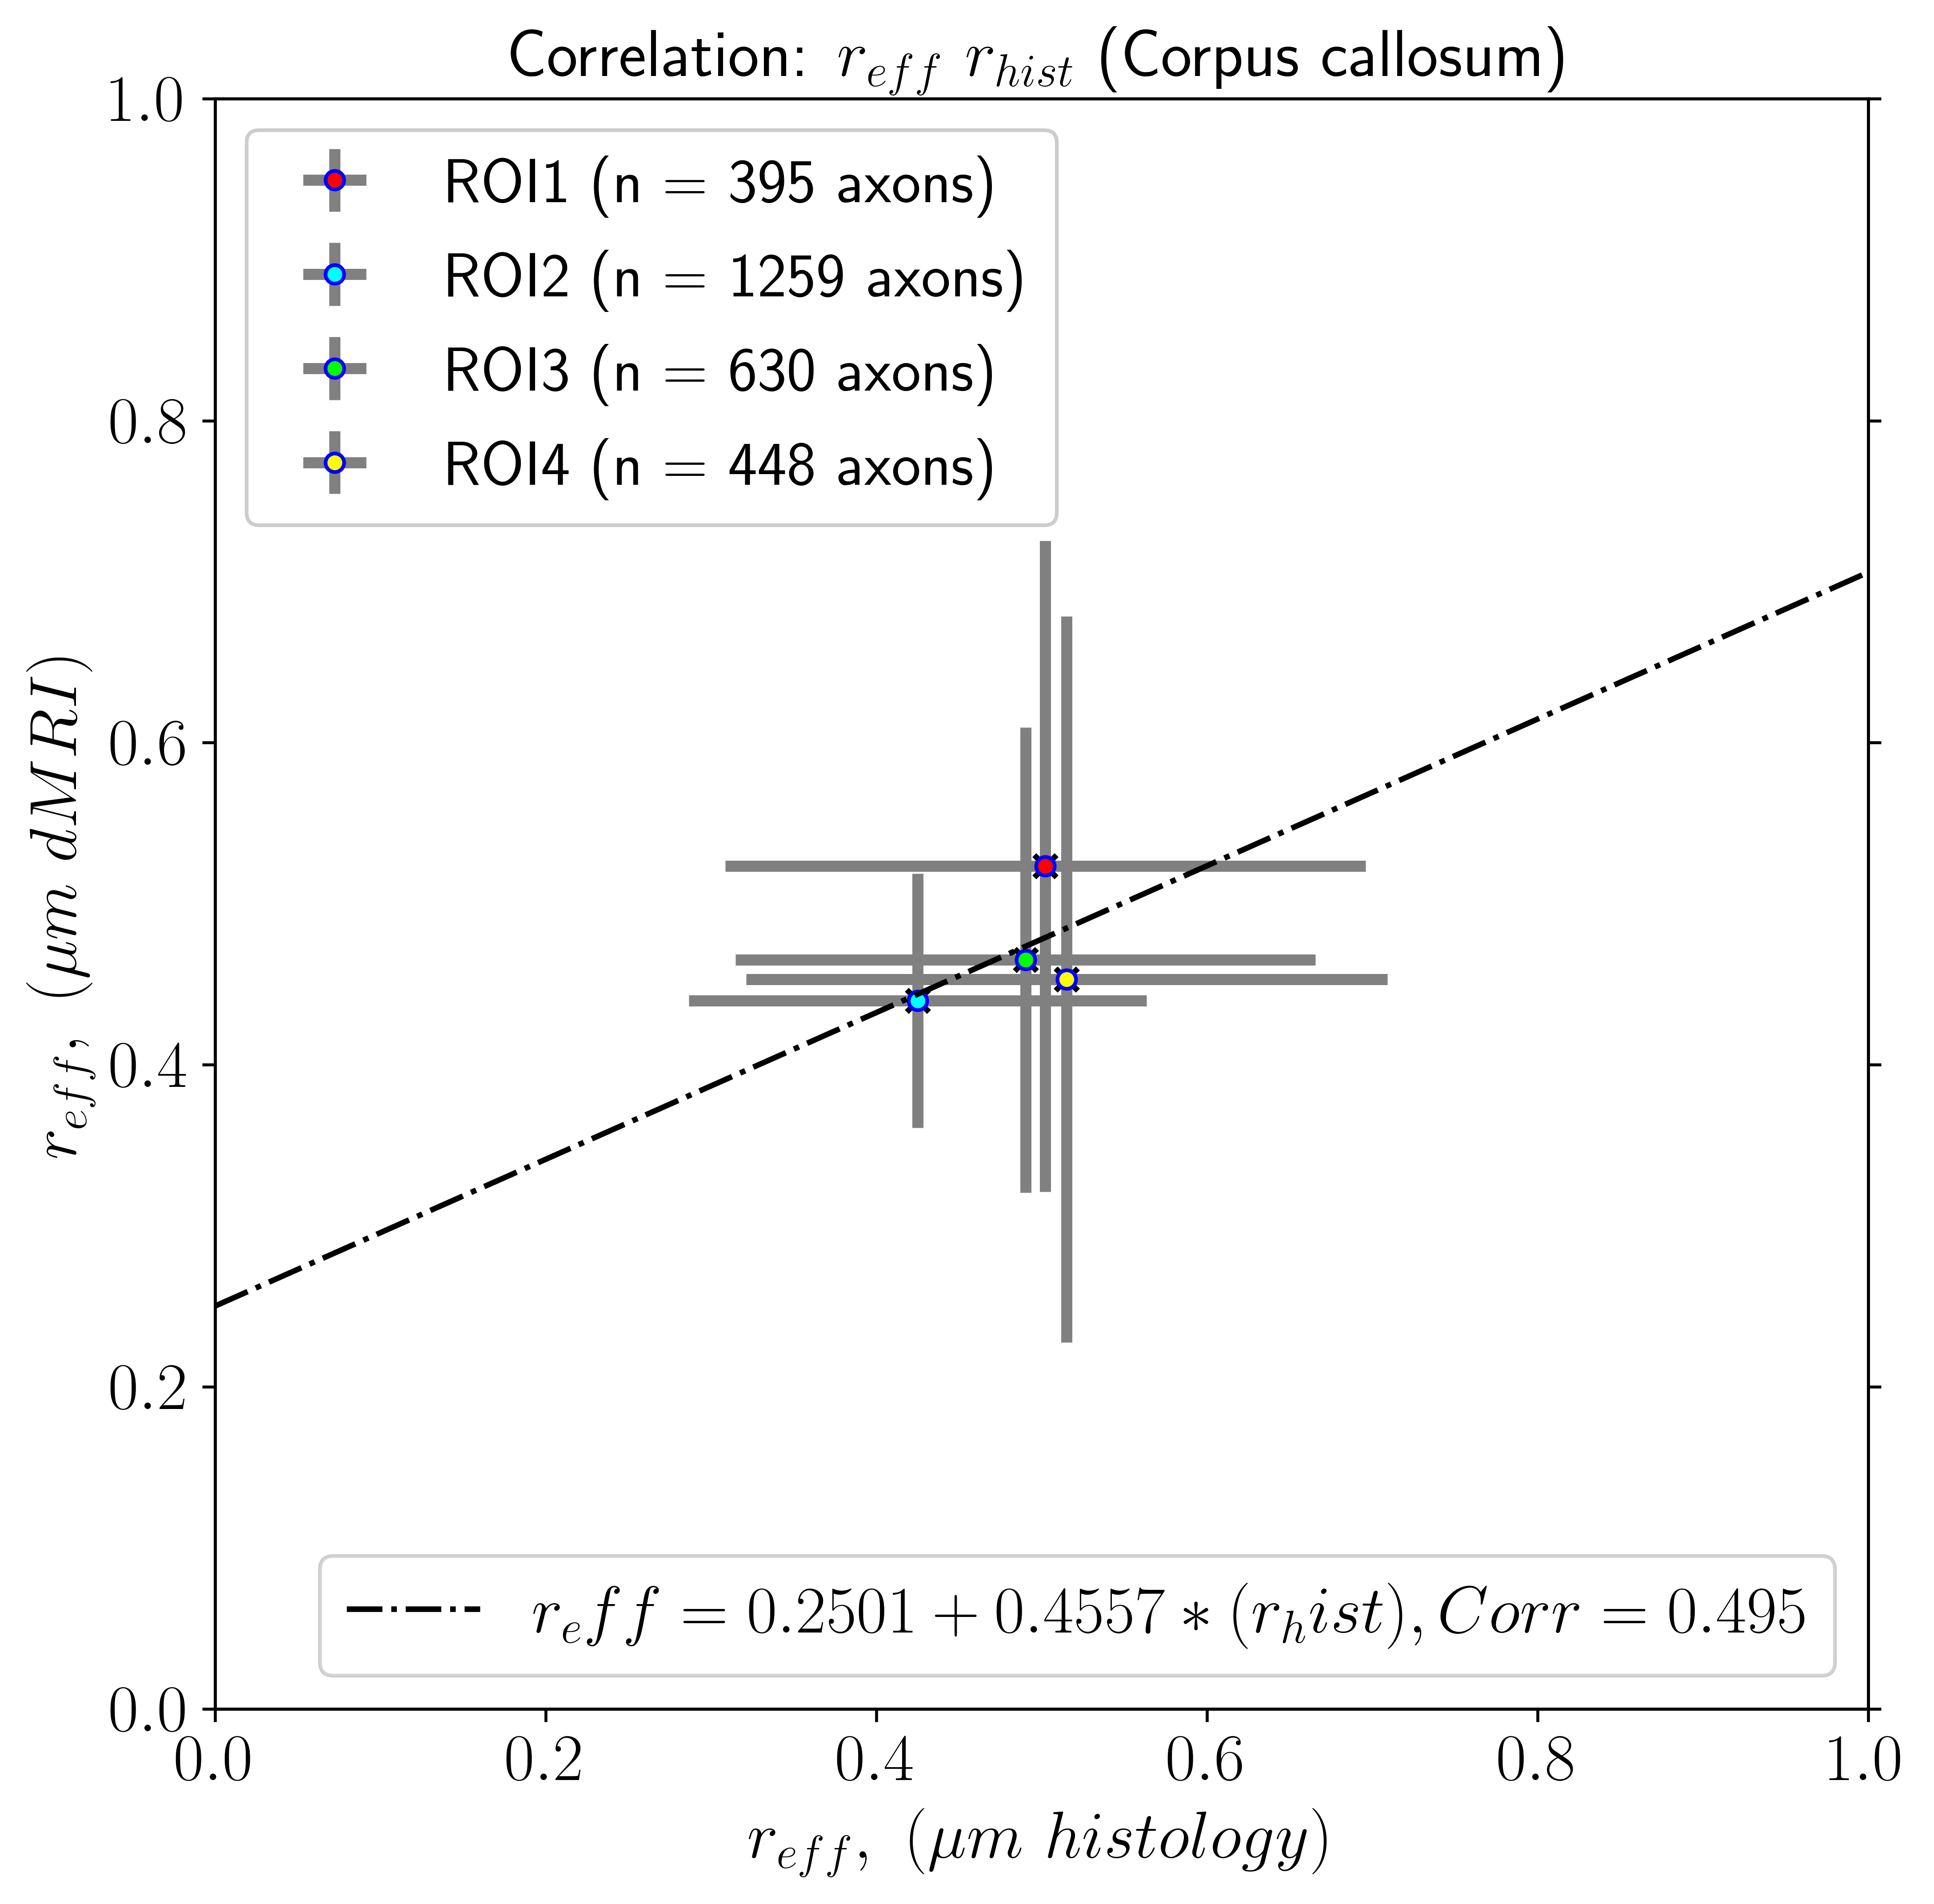
Figure 4. Linear regression between the radius estimated from dMRI-T2 data (y-axis) and the axon radius (x-axis) measured from the second histological sample. Vertical error bars represent the T2-based axon radius standard deviation per ROI; horizontal error bars represent the standard deviation of the histological inner axon radius (Histology 2). The number of axons measured for each CC region in the histology sample is displayed.
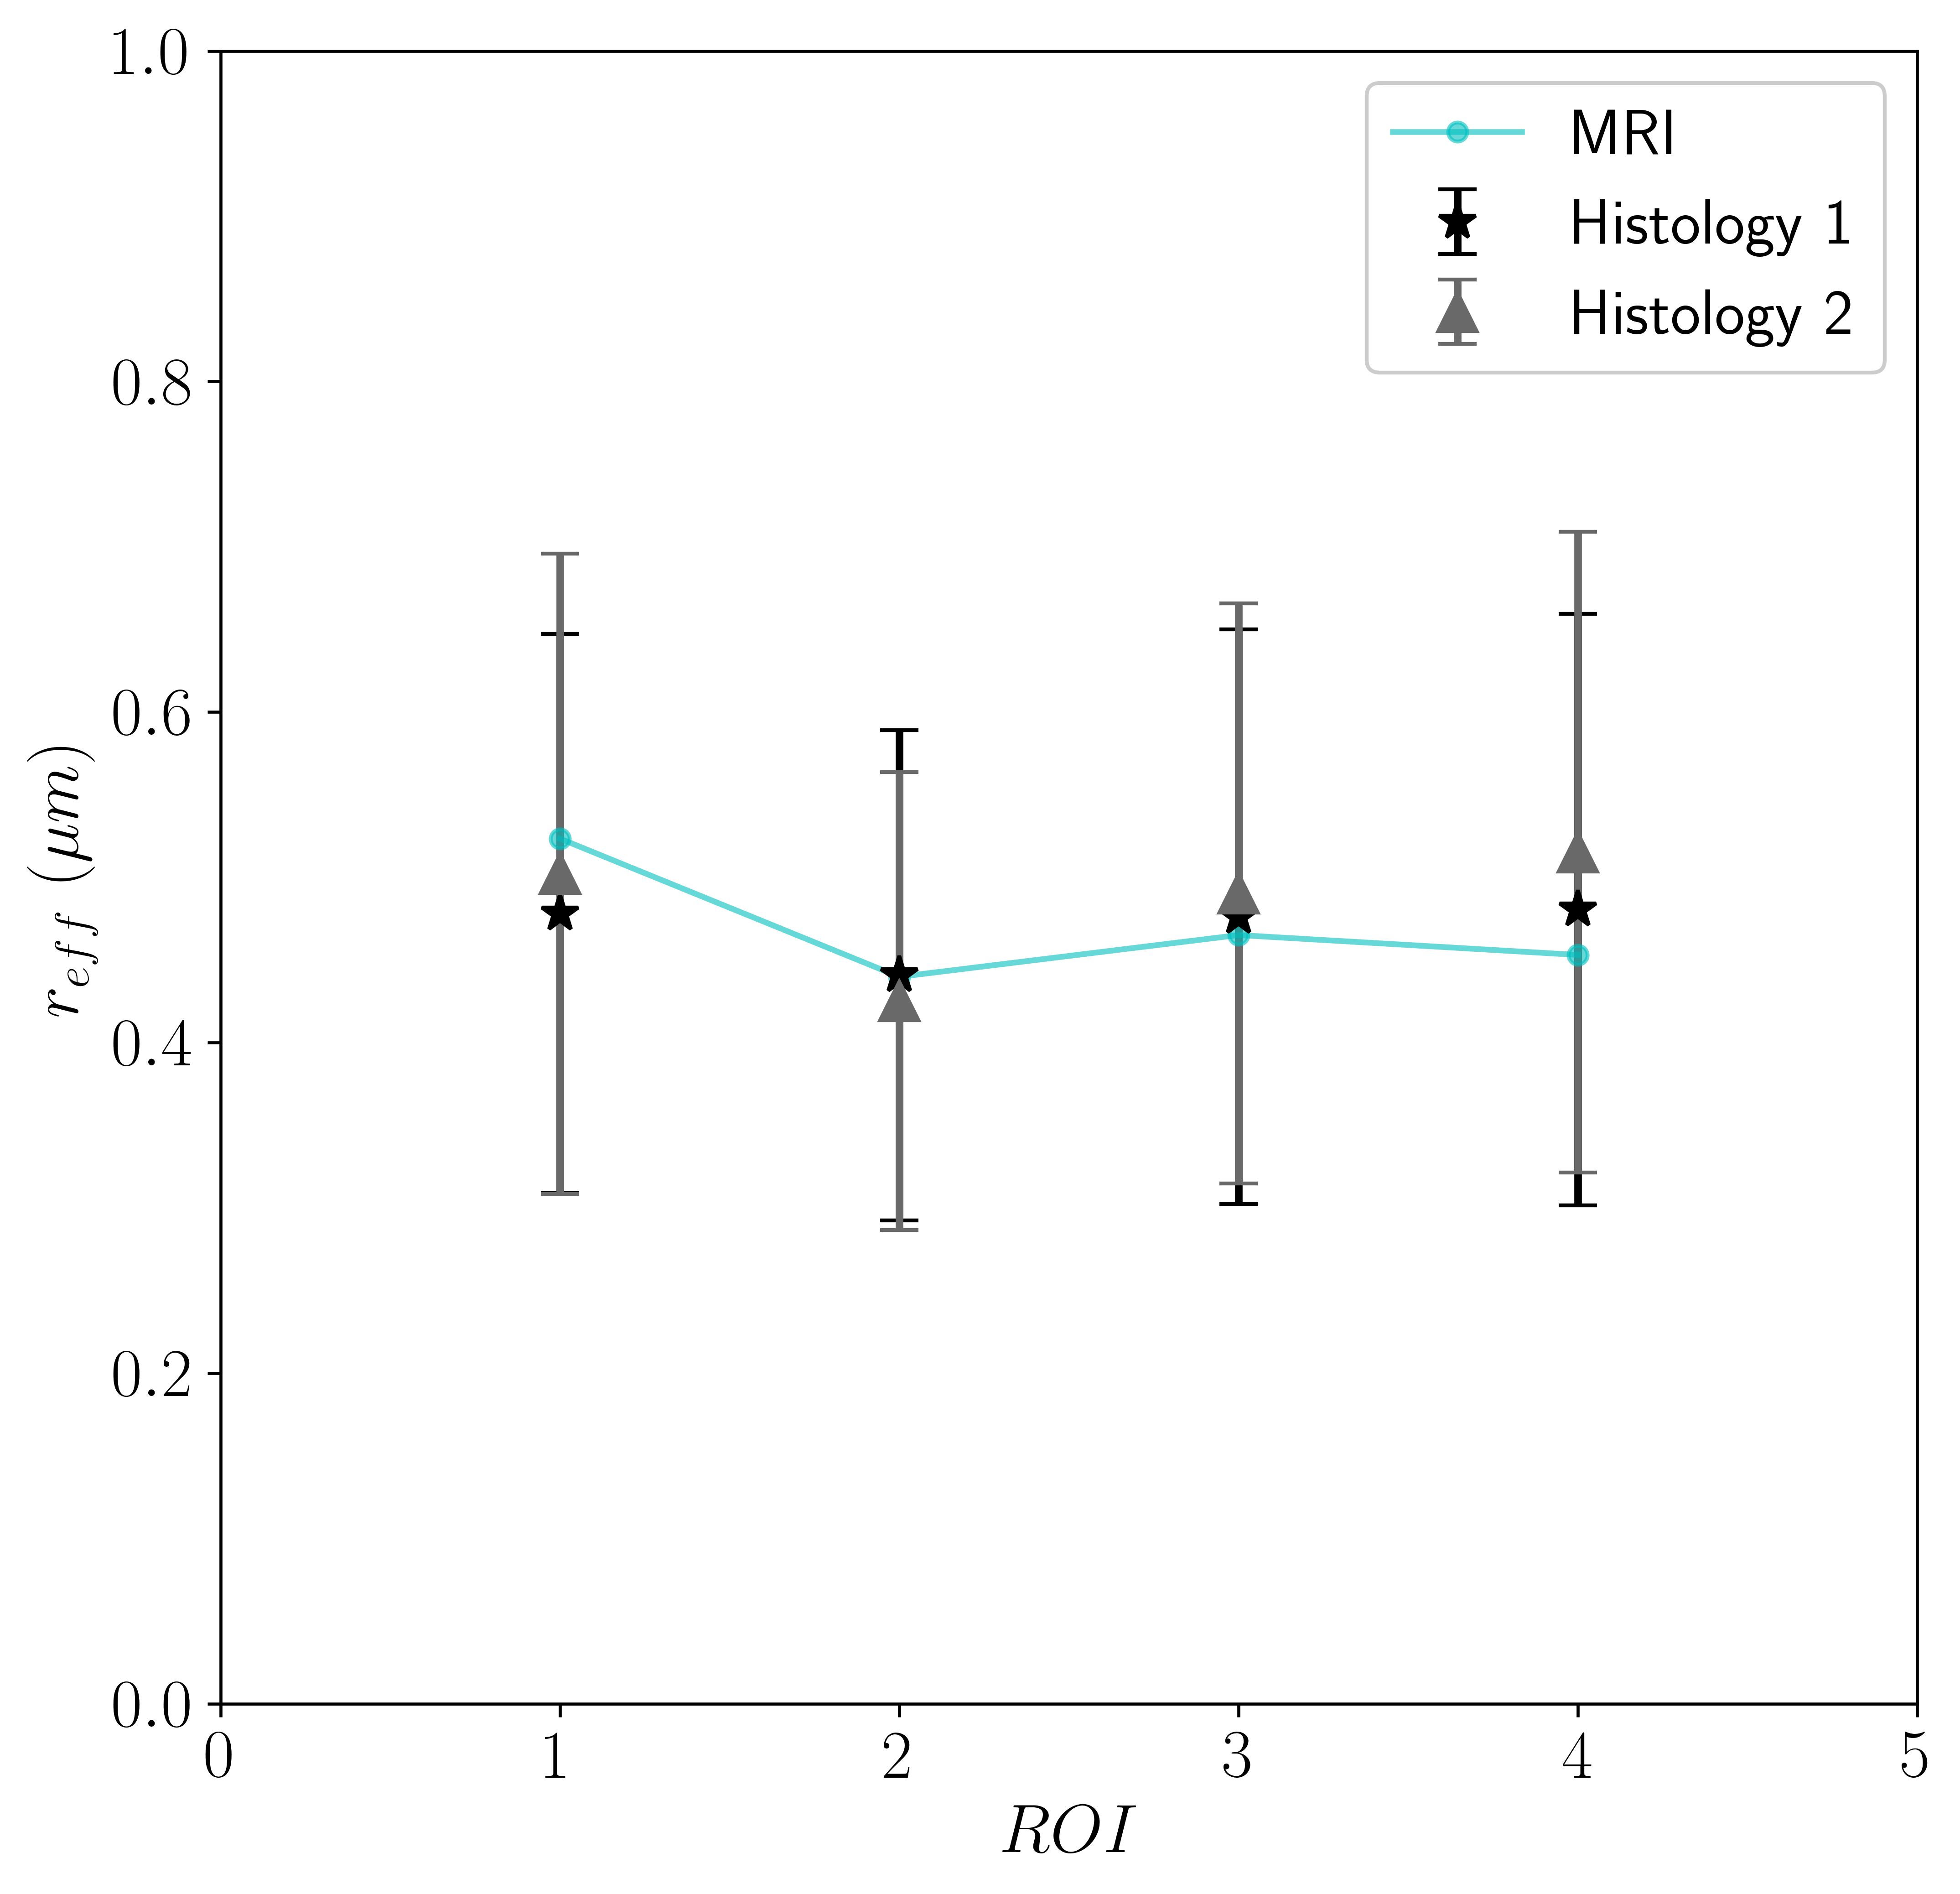
Figure 5. Mean predicted effective axon radius estimated from the ex-vivo diffusion-T2 MRI data for each ROI compared to the expected radius as per histological measure (the mean of both histology samples is reported as well as the error bars: Histology 1 was used for the calibration, Histology 2 was used for the correlation)