4109
Modeling structural and functional connectomics with proteomics in a preclinical model of tauopathy1Neuroscience, Baylor College of Medicine, Houston, TX, United States, 2Integrative Physiology, Baylor College of Medicine, Houston, TX, United States
Synopsis
Keywords: Small Animals, Alzheimer's Disease, resting state fMRI, functional connectivity, tau
Motivation: Identifying neurological changes in Alzheimer’s Disease (AD) is critical for early intervention. Tau accumulation is a key pathological feature in AD and other neurodegenerative diseases.
Goal(s): This project investigates how tau accumulation impacts structural and functional connectivity in the brain and cognitive decline.
Approach: We use behavioral assessments of learning and memory in the rTg4510 mouse model of tauopathy with awake resting-state fMRI and diffusion tensor imaging at three timepoints during the course of tau accumulation.
Results: As tau accumulates, we identify patterns of functional connectivity changes. We plan to use machine learning to link these changes to cognitive decline.
Impact: We study how tau accumulation affects brain functional connectivity and cognitive decline in a mouse model of tauopathy. Magnetic resonance imaging may offer non-invasive tools for assessing Alzheimer's Disease pathology, potentially aiding in early diagnosis.
Introduction
Alzheimer’s Disease (AD) is characterized by the accumulation of amyloid plaques and tau tangles. Amyloid beta accumulates extracellularly, while tau builds up inside the cell, suggesting that they play distinct roles in AD pathology1. While the role of amyloid beta has been an area of intense focus for potential therapeutic interventions, the contribution of tau to AD pathology is less understood. Importantly, the progression of tau pathology correlates with symptom progression and cognitive deficits in AD and other tauopathies, such as frontotemporal dementia2. In the clinic, AD is diagnosed using a combination of cognitive assessments, neuroimaging techniques, and blood biomarkers for amyloid beta and tau pathology. One promising approach is the use of resting-state functional magnetic resonance imaging (rs-fMRI) to assess functional connectivity (FC) in the brain. rs-fMRI signal corresponds to local neural activity, and correlated activity reveals functional connections between brain regions3. Changes in rs-FC have been detected early in AD, even before cognitive decline, making it a promising early biomarker of disease4-5. Interestingly, a recent PET study found that tau pathology correlates with functional hypoconnectivity, while amyloid beta correlates with hyperconnectivity6. Therefore, we seek to understand the effects of tau accumulation on FC and cognitive decline in a mouse model of tauopathy. To avoid the potentially confounding effects of anesthesia on brain activity, we use awake, unanesthetized mice. In addition to functional connectivity, we also assess anatomical connectivity and white matter integrity using diffusion tensor imaging (DTI). Finally, we plan to perform targeted spatial proteomics to link subcellular processes to macroscale structural and functional network organization.Methods
The rTg4510 mouse model of tauopathy was tested at three time points across tau accumulation: 3 months (before tau tangle formation), 6 months (beginning of tangle formation), and 10 months (extensive tangle formation). First, we assessed spatial learning and memory using Morris Water Maze. Mice learned the location of a hidden platform in a pool of water over 4 training days. Time to find the platform (latency to escape) was recorded for each trial. On the final day, an additional probe trial was performed where the platform was removed. Time spent in each quadrant of the pool was measured. To prepare the mice for awake imaging, mice underwent a 5 day acclimation protocol for the mouse holder and scanner environment. Acclimation time started at 10 minutes on the first day and increased in 10 minute increments to 50 minutes on the fifth day. A 9.4T AV Neo Bruker MRI system was used for all image collection. rs-fMRI imaging was done with awake mice, and T2 reference images were collected. Preprocessing of rs-fMRI data was conducted using SPM12, including motion correction and alignment to template. CONN Toolbox v19 was used to quantify FC between 60 brain regions and generate connectomes. DTI imaging was performed on anesthetized mice (maintained on 1-2% isoflurane), and fractional anisotropy (FA) was calculated. DTI data was analyzed using DTIstudio and ROIeditor.Results and Discussion
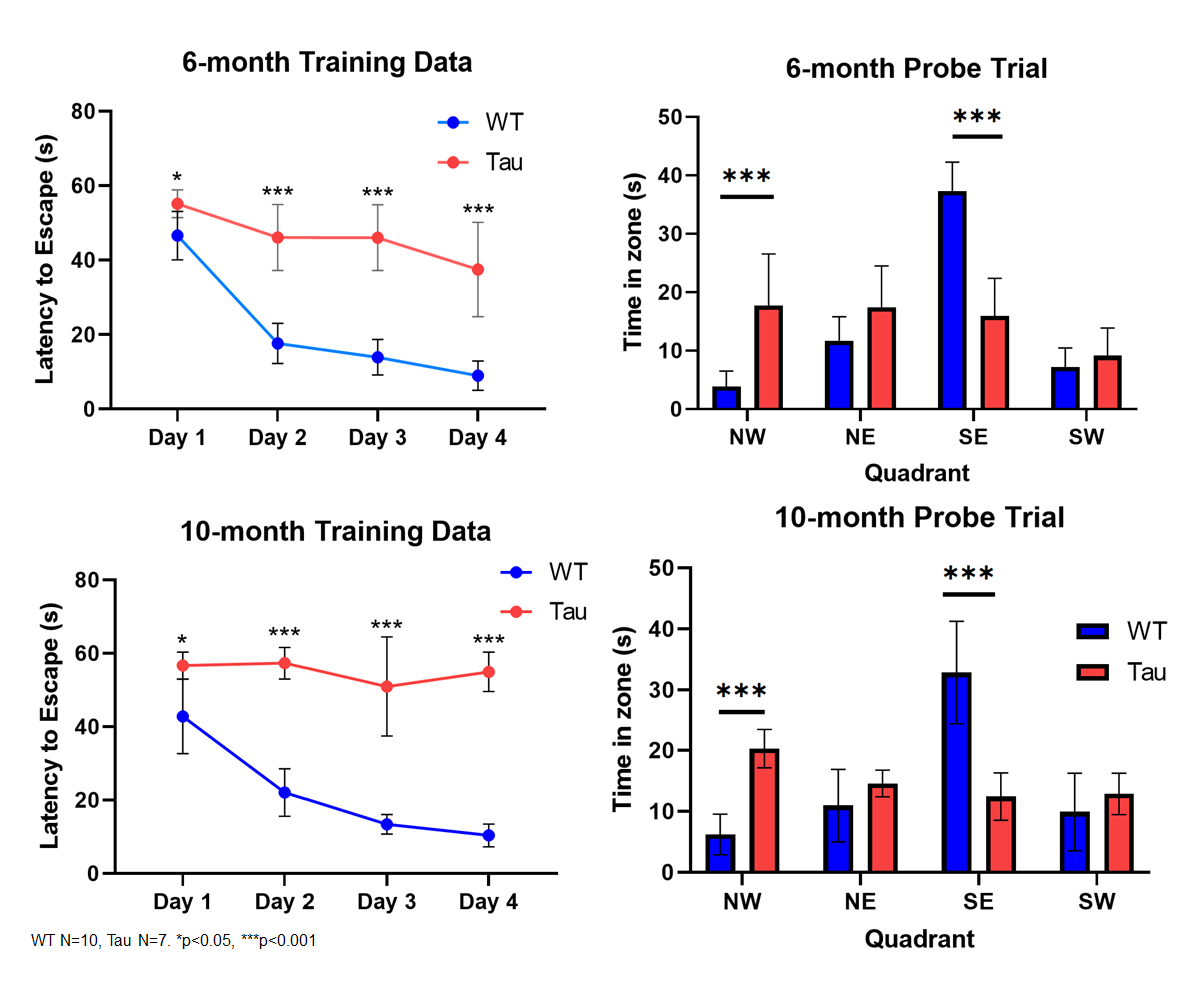
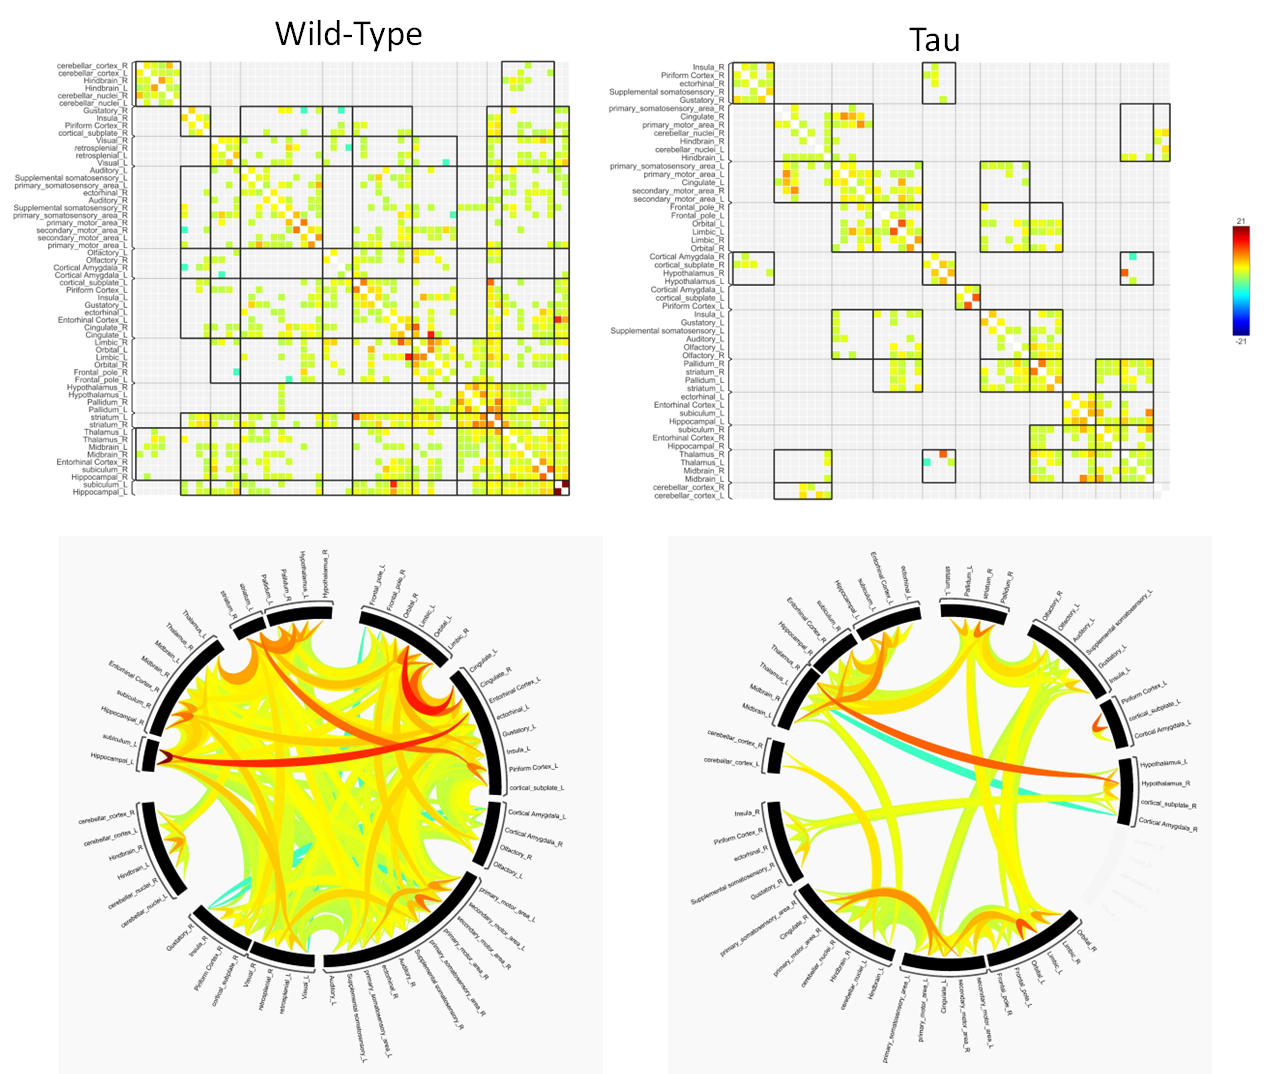
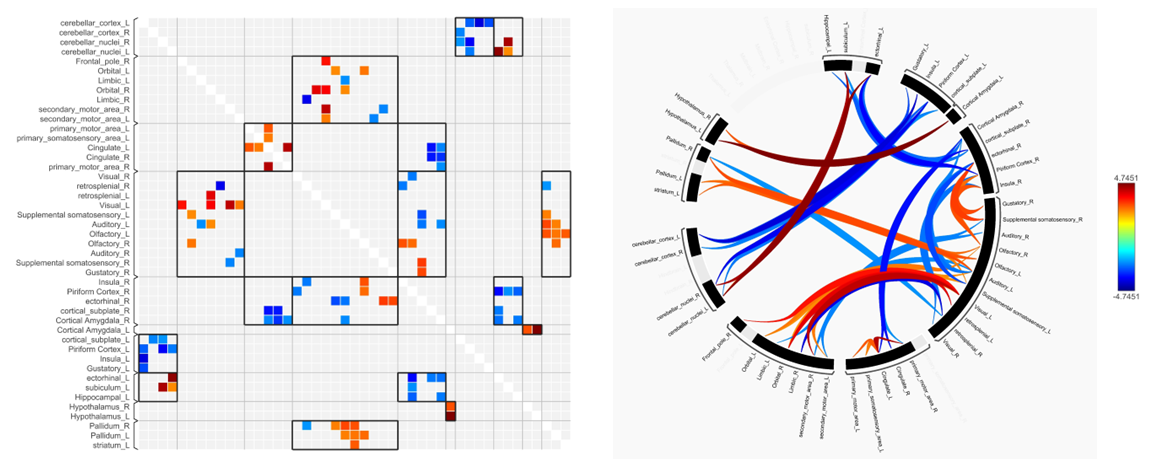
Spatial memory performance was impaired in 6- and 10-month old rTg4510 mice compared to wild-type littermate controls (Fig. 2). 6-month old mice showed deficits in both learning and memory performance, but showed improvement over 4 days of training trials, indicating that learning was still occurring. At 10 months, rTg4510 mice did not improve during the course of training, suggesting learning is impaired. Following acclimation, these same mice were used for rs-fMRI to assess functional connectivity changes. For the 10-month group, we observed decreased overall functional connectivity in the rTg4510 mice, with fewer regions that are functionally connected compared to wild-type (Fig. 3). Interestingly, we observed areas of both hypo- and hyper-connectivity. We observed hypoconnectivity in memory-related regions, including the hippocampus and subiculum (Fig. 4). In contrast, we observed hyperconnectivity in limbic and sensory regions. We also utilized DTI to assess white matter integrity. At 6 months, rTg4510 mice had differences in 11 regions, including the hippocampus, amygdala, and piriform cortex. At 10 months, we observed differences in 25 regions, including the corpus callosum and cingulum. In the future, we plan to use nanoString technology to perform targeted spatial proteomics, providing insight into the mechanisms behind changes in structural and functional connectivity. Additionally, machine learning will be used to determine the relationships between behavior, structural and functional connectivity, and spatial proteomics to identify key contributors to tau-mediated cognitive decline. Structural and functional neuroimaging may provide non-invasive methods of assessing AD pathology in patients and provide opportunities for early detection of AD.Acknowledgements
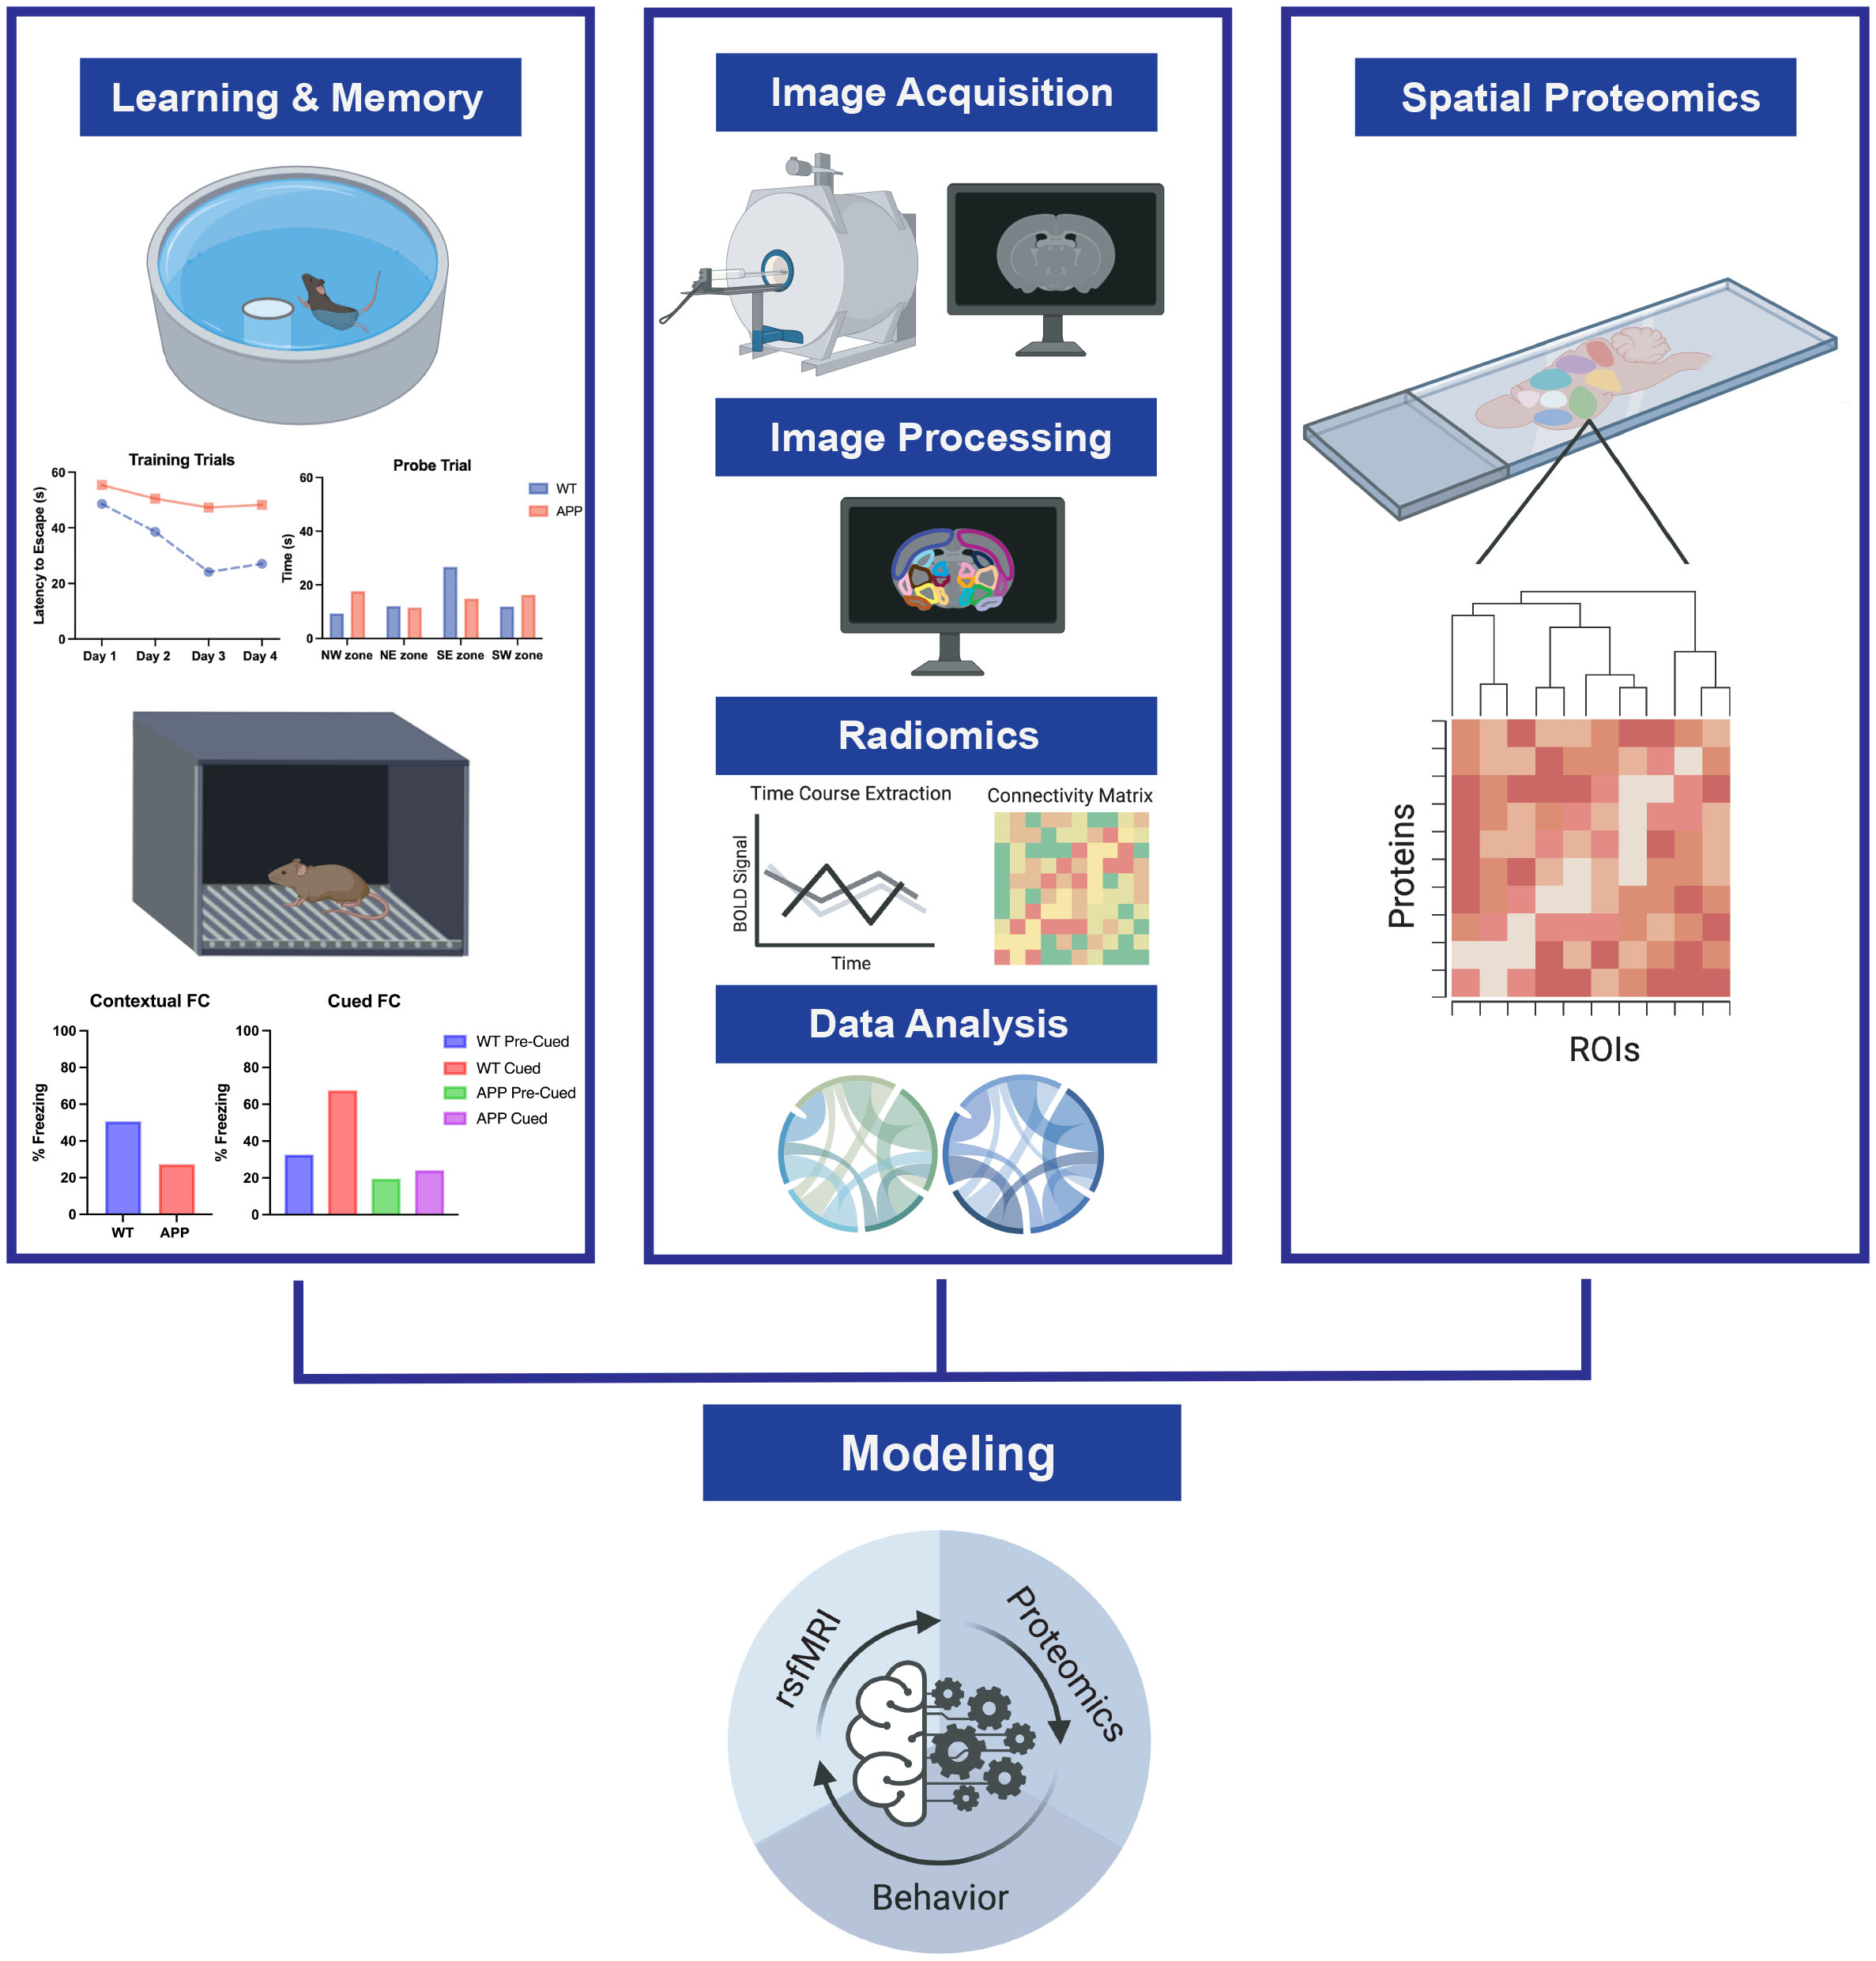
This work was funded by NIH 1R56AG071152 and supported by the SAIF at Texas Children's Hospital. Figure 1 created using BioRender.References
1. Selkoe, D. J. The molecular pathology of Alzheimer’s disease. Neuron 6, 487–498 (1991).
2. Giannakopoulos, P. et al. Tangle and neuron numbers, but not amyloid load, predict cognitive status in Alzheimer’s disease. Neurology 60, 1495–1500 (2003).
3. Logothetis, N. K. and Wandell, B.A. Interpreting the BOLD signal. Annu. Rev. Physiol. 66 (2004): 735-769.
4. Buckley, R. F. et al. Functional network integrity presages cognitive decline in preclinical Alzheimer disease. Neurology 89, 29–37 (2017).
5. Creicis, M. D., et al. Default-mode network activity distinguishes Alzheimer's disease from healthy aging: evidence from functional MRI. PNAS USA 101, 4637-4642 (2004).
6. Sepulcre, J. et al. Tau and amyloid β proteins distinctively associate to functional network changes in the aging brain. Alzheimers Dement 13, 1261–1269 (2017).
Figures