4105
Application of Synthetic MRI in Neonatal Brain Myelin Development Evaluation1Clinical medicine school of Ningxia Medical University, YinChuan, China, 2Department of Radiology ,the First Hospital Affiliated to Hainan Medical College, Haikou, China, 3Clinical medicine school of Ningxia Medical University, Yinchuan, China, 4GE Healthcare,MR Reseaich, Beijing, Beijing, China, 5General Hospital of Ningxia Medical University, Yinchuan, China
Synopsis
Keywords: fMRI Analysis, Neonatal, Synthetic Magnetic Resonance Imaging,Myelination;Brain;Relaxometry; Development
Motivation: Conventional MRI sequences used in clinical practice cannot quantitatively evaluate the development of white matter in newborns.
Goal(s): To explore the feasibility and application value of Synthetic MRI (SyMRI) in cerebral white matter myelin development of full-term neonates.
Approach: Use intra-group and inter-group comparison of quantitative relaxation metrics obtained by SyMRI to evaluate the white matter myelin development level in newborns of different gestational ages.
Results: Quantitative relaxation metrics derived by SyMRI can quantitatively evaluate the formation of myelin and brain maturity in full-term newborns. T1 and T2 values in different regions can reflect the differences in myelin sheath formation time.
Impact: SyMRI can be used in clinical practice to investigate the myelin development of white matter in full-term newborns, and provide imaging basis for early detection and diagnosis of neonatal brain developmental dysplasia and disease conditions in newborns.
Introduction
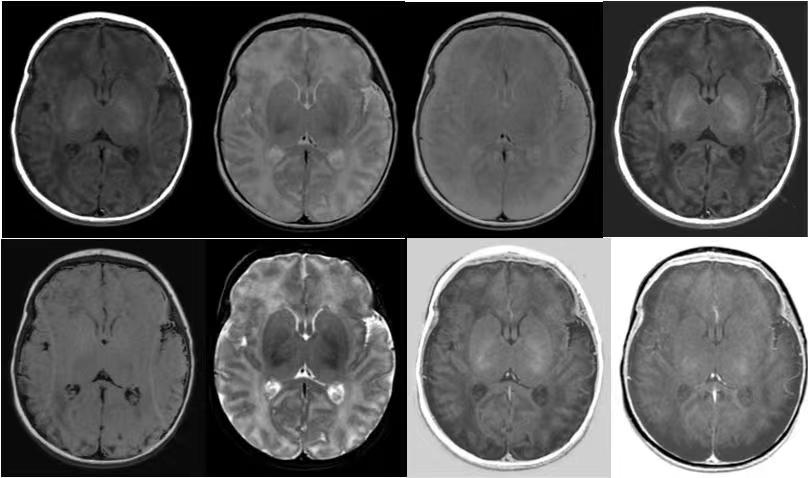
In neonates, MRI serves as a dependable technique for evaluating the formation of myelination. However, conventional MRI sequences lack the ability to quantitatively assess the development of white matter in the brain[1,2]. Synthetic MRI (SyMRI) is a novel quantitative MRI technique that enables the generation of multiple contrast images from a single acquisition and provides tissue-specific T1 and T2 relaxation values[3-5]. Although previous research has primarily focused on assessing fetal and preterm infants, a few studies have explored the application of SyMRI technique in evaluating neonatal brain maturity[6,7]. This study aims to utilize SyMRI to quantitatively evaluate the development of normal neonatal brain white matter myelination and gray matter nuclei.Methods
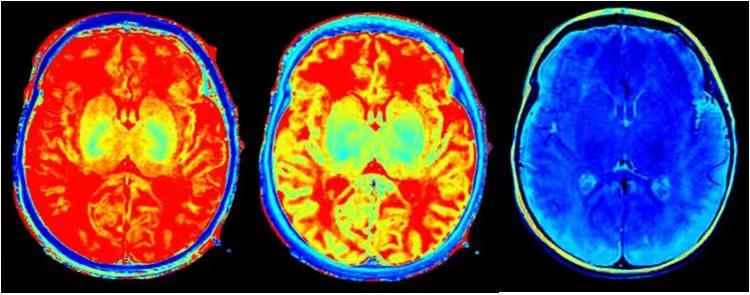
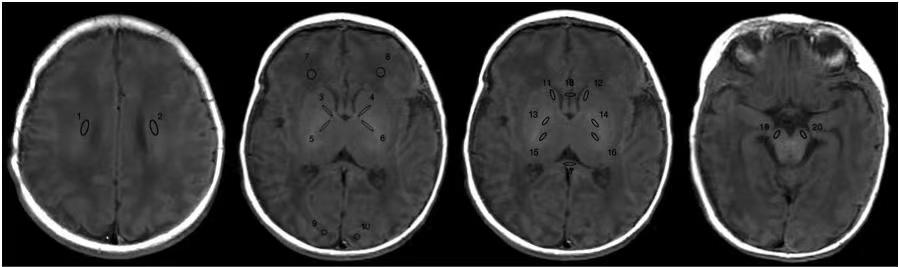
This study was approved by the Institutional Ethics Committee and all participants were scanned after obtaining written informed consent. From September 2020 to March 2023, a total of 60 full-term newborns who successfully underwent routine MRI and MAGiC examinations were recruited and divided them into three groups based on gestational age. All MR examinations were performed on a 3.0T MR scanner (SIGNATM Architect, GE Healthcare, Milwaukee WI, USA) equipped with a 48-channel head coil. The main scan parameters of SyMRI sequence are: TR/TE = 4242/21.6 ms, FOV = 20×20 cm2, acquisition matrix = 320×224, slice thickness/gap = 5/1 mm, scan time = 3min40s. The MAGiC raw images were further processed using the post-processing software equipped on the scanner to derive quantitative T1, T2 and proton density (PD) maps. Manually sketch the area of interest, as shown in Figure 1. Statistical analysis was conducted using SPSS software (version 26.0, IBM Corporation, Armonk, NY, USA) at a two-sided significance level of 5% (P<0.05 indicates statistical significance). Independent sample t-tests were used to compare the T1 and T2 values of different regions of interest (ROI) within the group for statistical differences. One-way analysis of variance or Kruskal-Wallis H test to compare the T1 and T2 values of ROI among different groups and regions.Results
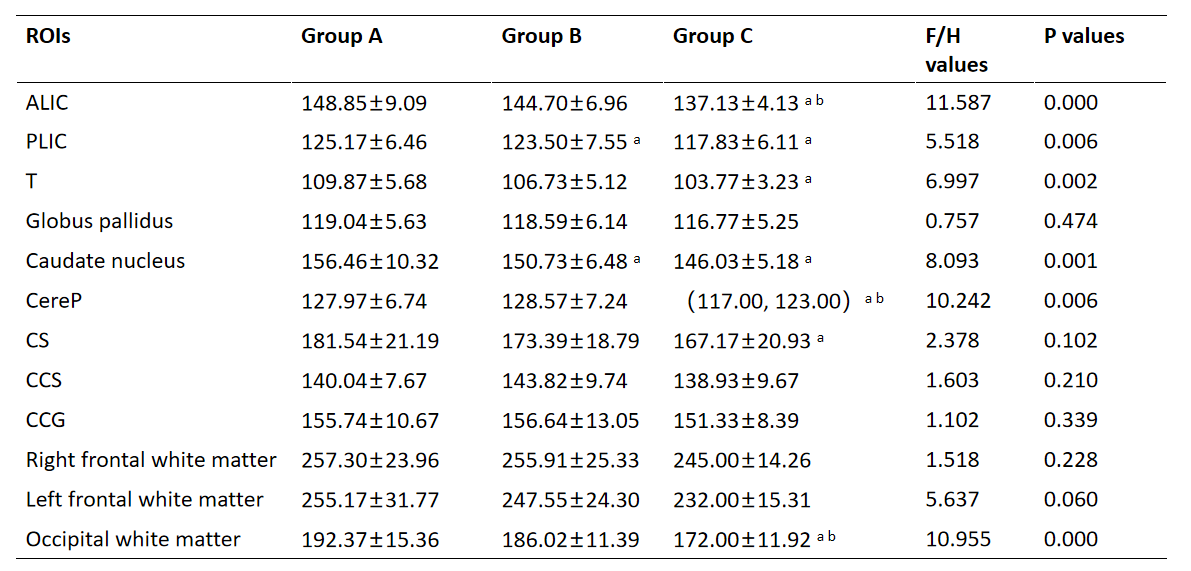
The study findings indicate that there are significant differences in the T1 and T2 values among different regions within the same gestational age group. Specifically, the T1 and T2 values were found to be lower in the posterior limb of the internal capsule (PLIC) compared to the anterior limb of the internal capsule (ALIC), lower in the compressed part of the corpus callosum (CCS) compared to the non-compressed part (CCG), and lower in the white matter of the occipital lobe compared to the frontal lobe. These differences were statistically significant (P<0.05).Furthermore, when comparing the T1 and T2 values at the same region but different gestational ages, significant differences were observed among the three groups (Group A, Group B, and Group C). Specifically, the T1 and T2 values of the ALIC, PLIC, and thalamus (T), as well as the T2 values of the caudate nucleus, cerebral peduncle, and occipital lobe, were found to be statistically different among the three groups (P<0.05). The highest values were observed in Group A, followed by Group B, and the lowest values were observed in Group C.Discussion
The findings of this study support the notion that changes in T1 and T2 values can serve as sensitive indicators for evaluating normal brain maturation[8,9]. The observed differences in T1 and T2 values within each ROI and between different gestational age groups reflect the underlying pattern of myelination in the brain. Specifically, the T1 and T2 values of the selected ROIs in Group C were lower than those in Group A and Group B. Statistical analysis revealed significant differences in the T1 and T2 values of the PLIC, ALIC, thalamus, and the T2 values of the caudate nucleus, cerebral peduncle, and occipital white matter among the three groups. These values were highest in Group A, followed by Group B, and lowest in Group C. This suggests that the development of neonatal brain tissue gradually matures with increasing gestational age, resulting in a decrease in T1 and T2 values[10]. This may be due to complex biochemical and biophysical changes during myelin maturation, including the decrease of tissue water content, myelin formation, and changes in cell and axon density[11].Conclusion
SyMRI can be used to investigate the myelin development of white matter in full-term newborns, and provide imaging basis for early detection and diagnosis of neonatal brain developmental dysplasia and disease conditions in clinical practice.Acknowledgements
No acknowledgement found.References
[1] Dorner R A, Burton V J, Allen M C, et al. Preterm neuroimaging and neurodevelopmental outcome: a focus on intraventricular hemorrhage, post-hemorrhagic hydrocephalus, and associated brain injury. Journal of Perinatology,2018:1431–1443.[2] Hong J, Feng Z, Wang S-H, et al. Brain age prediction of children using routine brain mr images via deep learning. Frontiers in Neurology,2020,11:584–682.[3]Yang PC, Yang ZG, Chen XL, et al. Application Progress of synthetic magnetic resonance imaging in central nervous system. Chinese Journal of Medical Imaging,2023:295-299. [4] Hagiwara A, Fujimoto K, Kamagata K, et al. Age-related changes in relaxation times, proton density, myelin, and tissue volumes in adult brain analyzed by 2-dimensional quantitative synthetic magnetic resonance imaging. Investigative Radiology,2021:163–172.[5] Bao S, Liao C, Xu N, et al. Prediction of brain age using quantitative parameters of synthetic magnetic resonance imaging. Frontiers in Aging Neuroscience,2022,14:963668.[6] Schmidbauer V U, Dovjak G O, Yildirim M S, et al. Mapping human fetal brain maturation in vivo using quantitative mri. American Journal of Neuroradiology,2021:2086–2093.[7] Zhao CW, Zhao X, Liu YC, et al. Initial application of synthetic MRI in evaluating brain maturation of preterm infants. Chin J Magn Reson Imaging,2021:1-5.[8] Andica C, Hagiwara A, Hori M, et al. Review of synthetic mri in pediatric brains: basic principle of mr quantification, its features, clinical applications, and limitations. Journal of Neuroradiology,2019,46:268–275.[9] Chen J V, Chaudhari G, Hess C P, et al. Deep learning to predict neonatal and infant brain age from myelination on brain mri scans. Radiology,2022:678–687.[10] Vanderhasselt T, Zolfaghari R, Naeyaert M, et al. Synthetic MRI demonstrates prolonged regional relaxation times in the brain of preterm born neonates with severe postnatal morbidity. NeuroImage: Clinical,2021,29:102544.[11] Wada A, Saito Y, Fujita S, et al. Automation of a rule-based workflow to estimate age from brain mr imaging of infants and children up to 2 years old using stacked deep learning. Magnetic Resonance in Medical Sciences,2023:57–66.Figures