4103
Histological validation of Quantitative Gradient Recalled Echo (qGRE) MRI as in vivo early neurodegeneration biomarker in Alzheimer’s Disease1Translational Imaging, Merck & Co., Inc., West Point, PA, United States, 2Washington University, St Louis, MO, United States
Synopsis
Keywords: Biomarkers, Neurodegeneration
Motivation: Robust methods are urgently needed for preclinical evaluation of novel Alzheimer Disease (AD) therapies to accelerate drug discovery. MRI methods hold significant promise, with quantitative Gradient Recalled Echo (qGRE) shown to provide insight into neurodegeneration in AD prior to atrophy development in humans.
Goal(s): In this study a novel method is shown to non-invasively measure the longitudinal neuronal loss in the hippocampus of a mouse model of AD.
Approach: Histological validation of the findings is performed.
Results: A strong correlation is revealed between the MRI metric and myelin content, hence offering the explanation for the mechanism of observed contrast.
Impact: A robust method for longitudinal in-vivo quantification of neuronal density loss in a mouse model of AD is presented and validated, allowing for efficient preclinical evaluation of novel AD therapeutics and accelerated drug development in the field.
Introduction
Alzheimer’s disease (AD) is a debilitating illness affecting more than 6.5 million individuals in the USA alone, causing memory loss and cognitive decline, and may lead to death. As the population ages, the prevalence of AD is also projected to grow rapidly. While significant efforts are taken to develop novel therapies, there is an urgent unmet need for efficient and early diagnosis, staging and treatment response evaluation, including in mouse models to support the active drug research in the field. MRI methods provide a promising tool for measurement of regional brain volume, structure and function. Recently it was demonstrated [1] that a quantitative Gradient Recalled Echo (qGRE) MRI technique [2] allows evaluation of neurodegeneration in AD prior to development of tissue atrophy. qGRE technique is based on a GRE MRI sequence with multiple gradient echoes and a theoretical model for data analysis enabling separation of tissue-specific, blood oxygen level dependent and macroscopic field contributions from the total R2* relaxation. Here, qGRE is adapted and applied to a mouse model of AD, Tg4510, to enable its use in preclinical AD research in drug discovery. Tg4510 mice develop early tauopathy and are known to show gradual decrease in neuronal density with age [3], a good model for validation of the approach. We show that qGRE can be used for longitudinal measurements of changes in neuronal density in mouse brain.Methods
Tg4510 (n=15) and wild type (WT, n=7) mice underwent MRI (7T field strength, 22mm brain volume coil) at 3,5 6, 7 months old (WT at 3 and 5mo only). 3D Multi-GRE sequence was used - 22xTE=2-44ms, deltaTE=2ms, TR=50ms, FA=10◦, matrix size 52x105x105 (slice-read-phase), FOV=16mm^3, 2 averages. Data were analyzed using approach developed in [2]. VSF (voxel spread function) method [4] was used to account for background gradients isoflurane anesthesia in 100% O2 was used to minimize BOLD contribution [5] to R2*. Hippocampus Regions of Interest (ROI) was segmented manually in co-registered anatomical scan for all mice and time-points. Tg4510 and WT mice were sacrificed at 3 and 6 months of age, brains cleared, stained with NeuN and MBP antibodies and scanned on a light-sheet microscope to visualize neuronal nuclei and myelin content respectively.Results
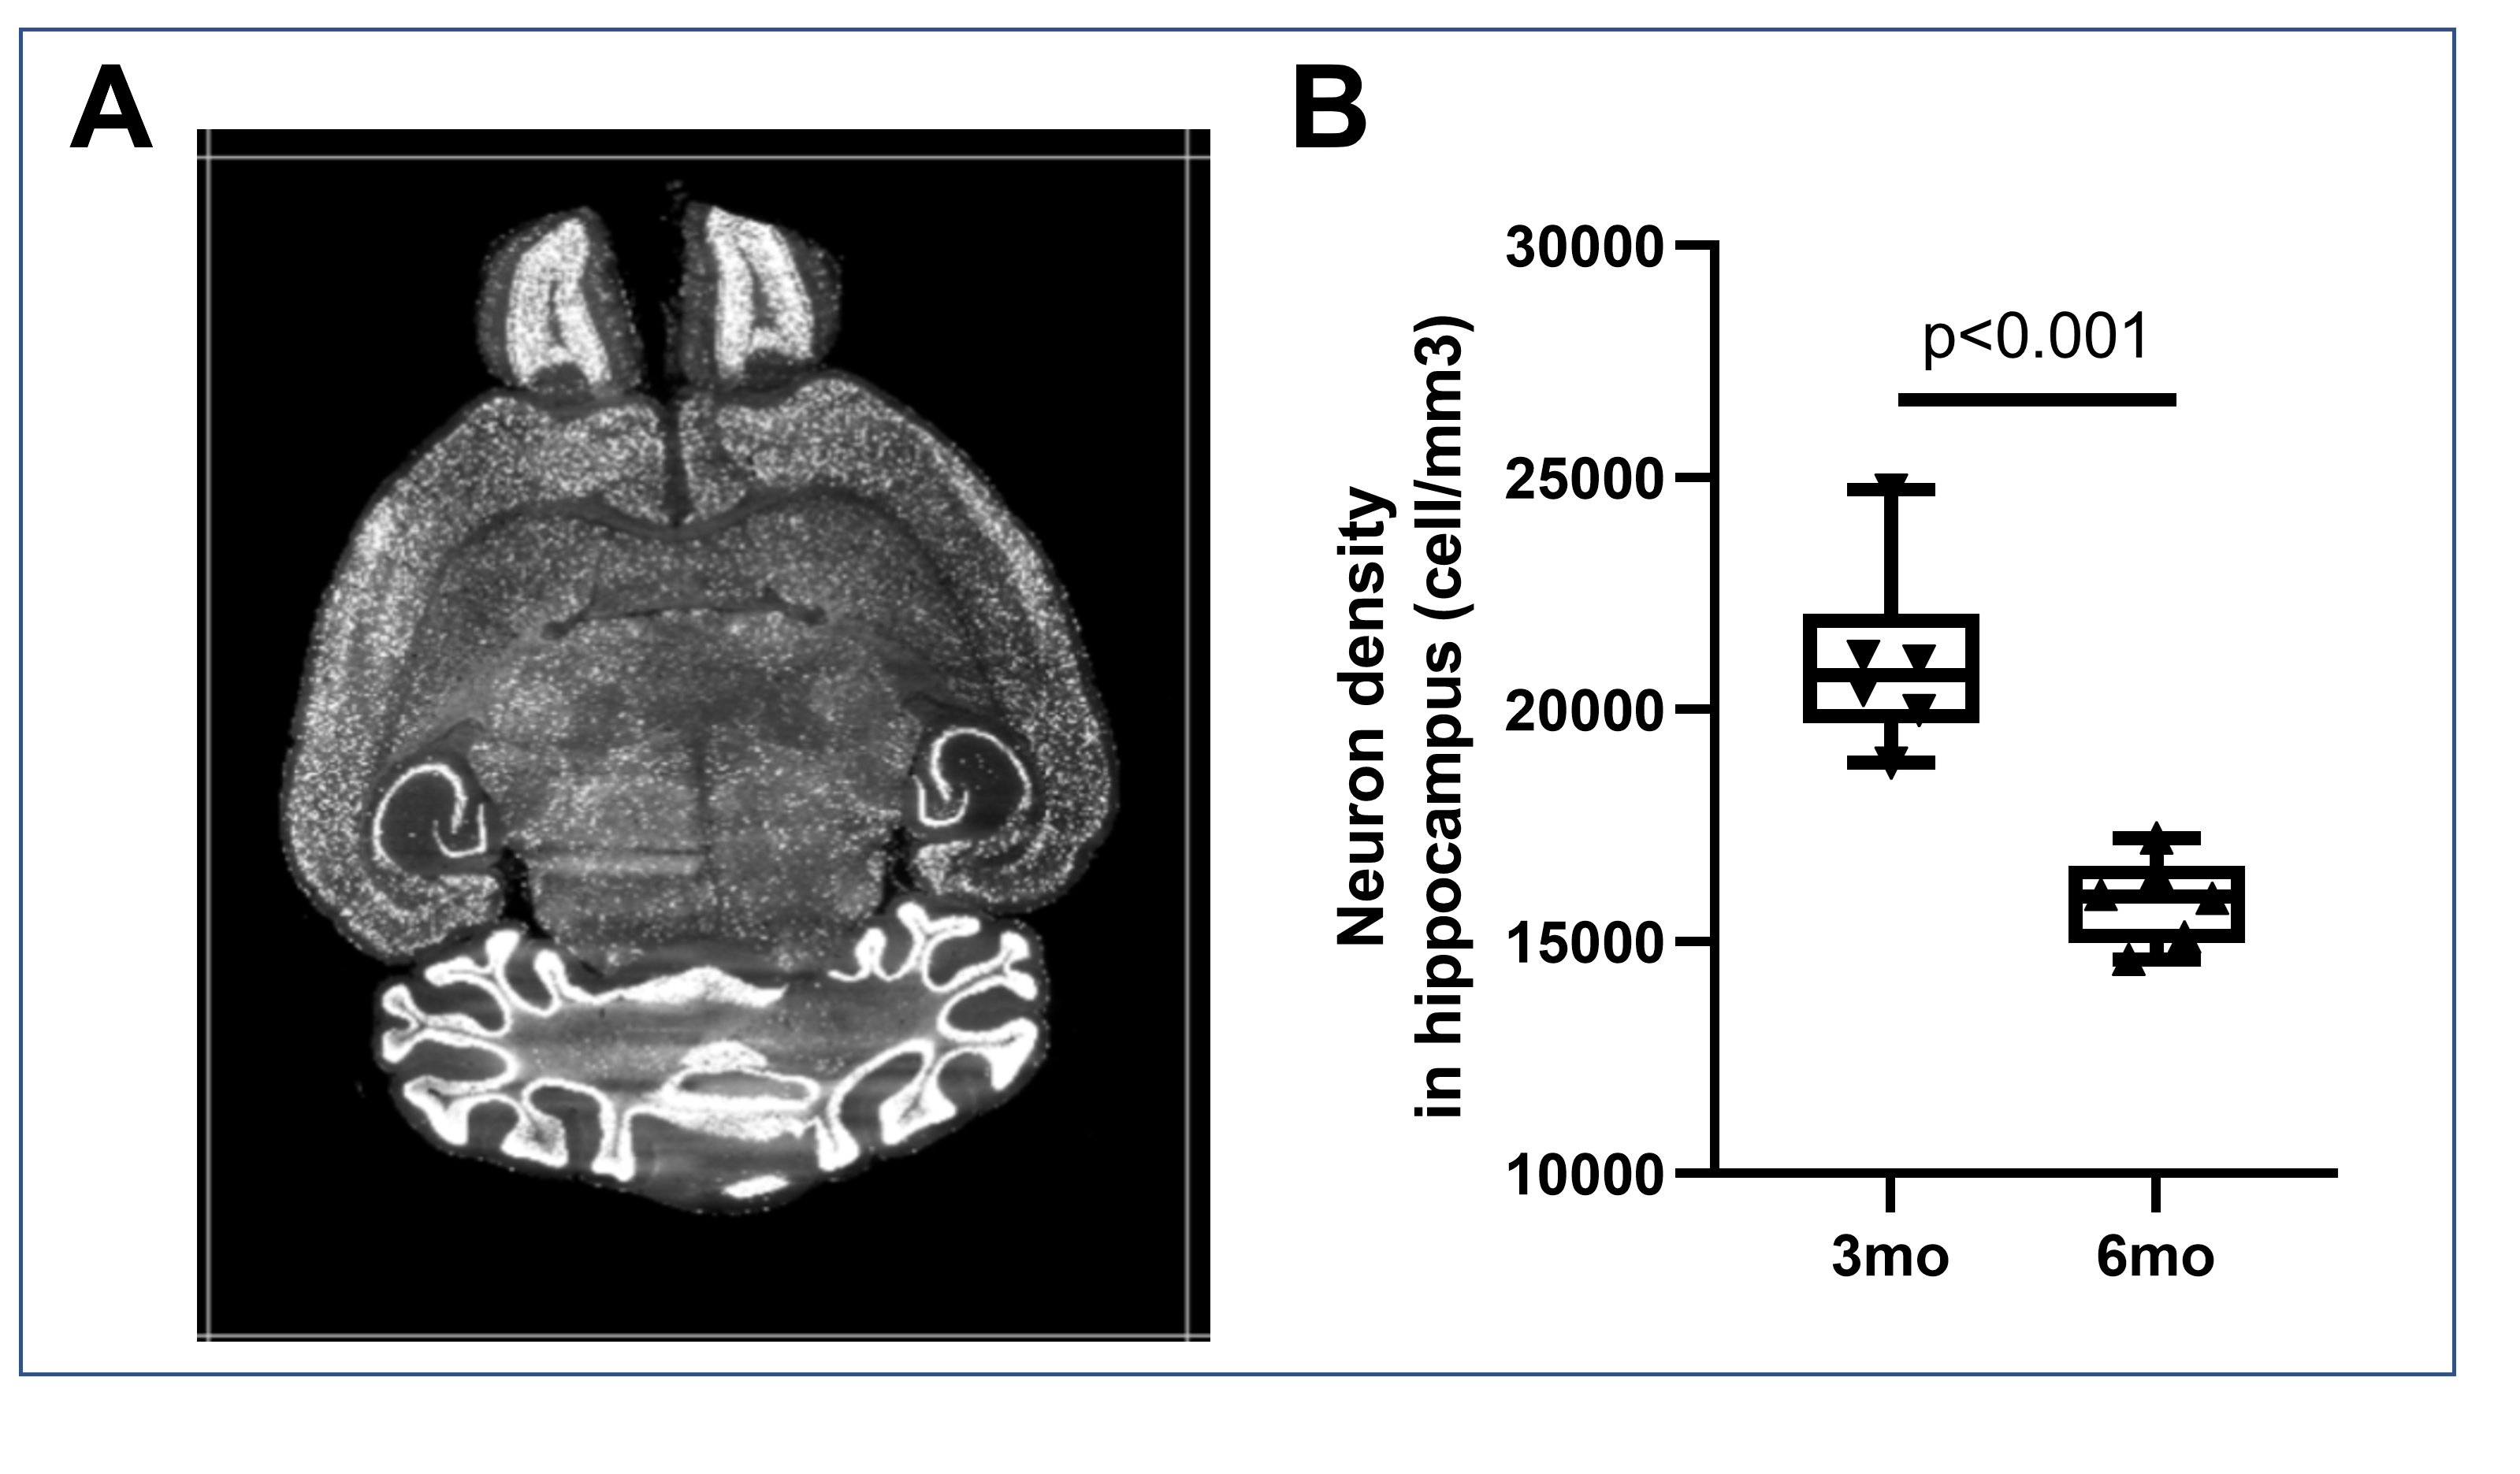
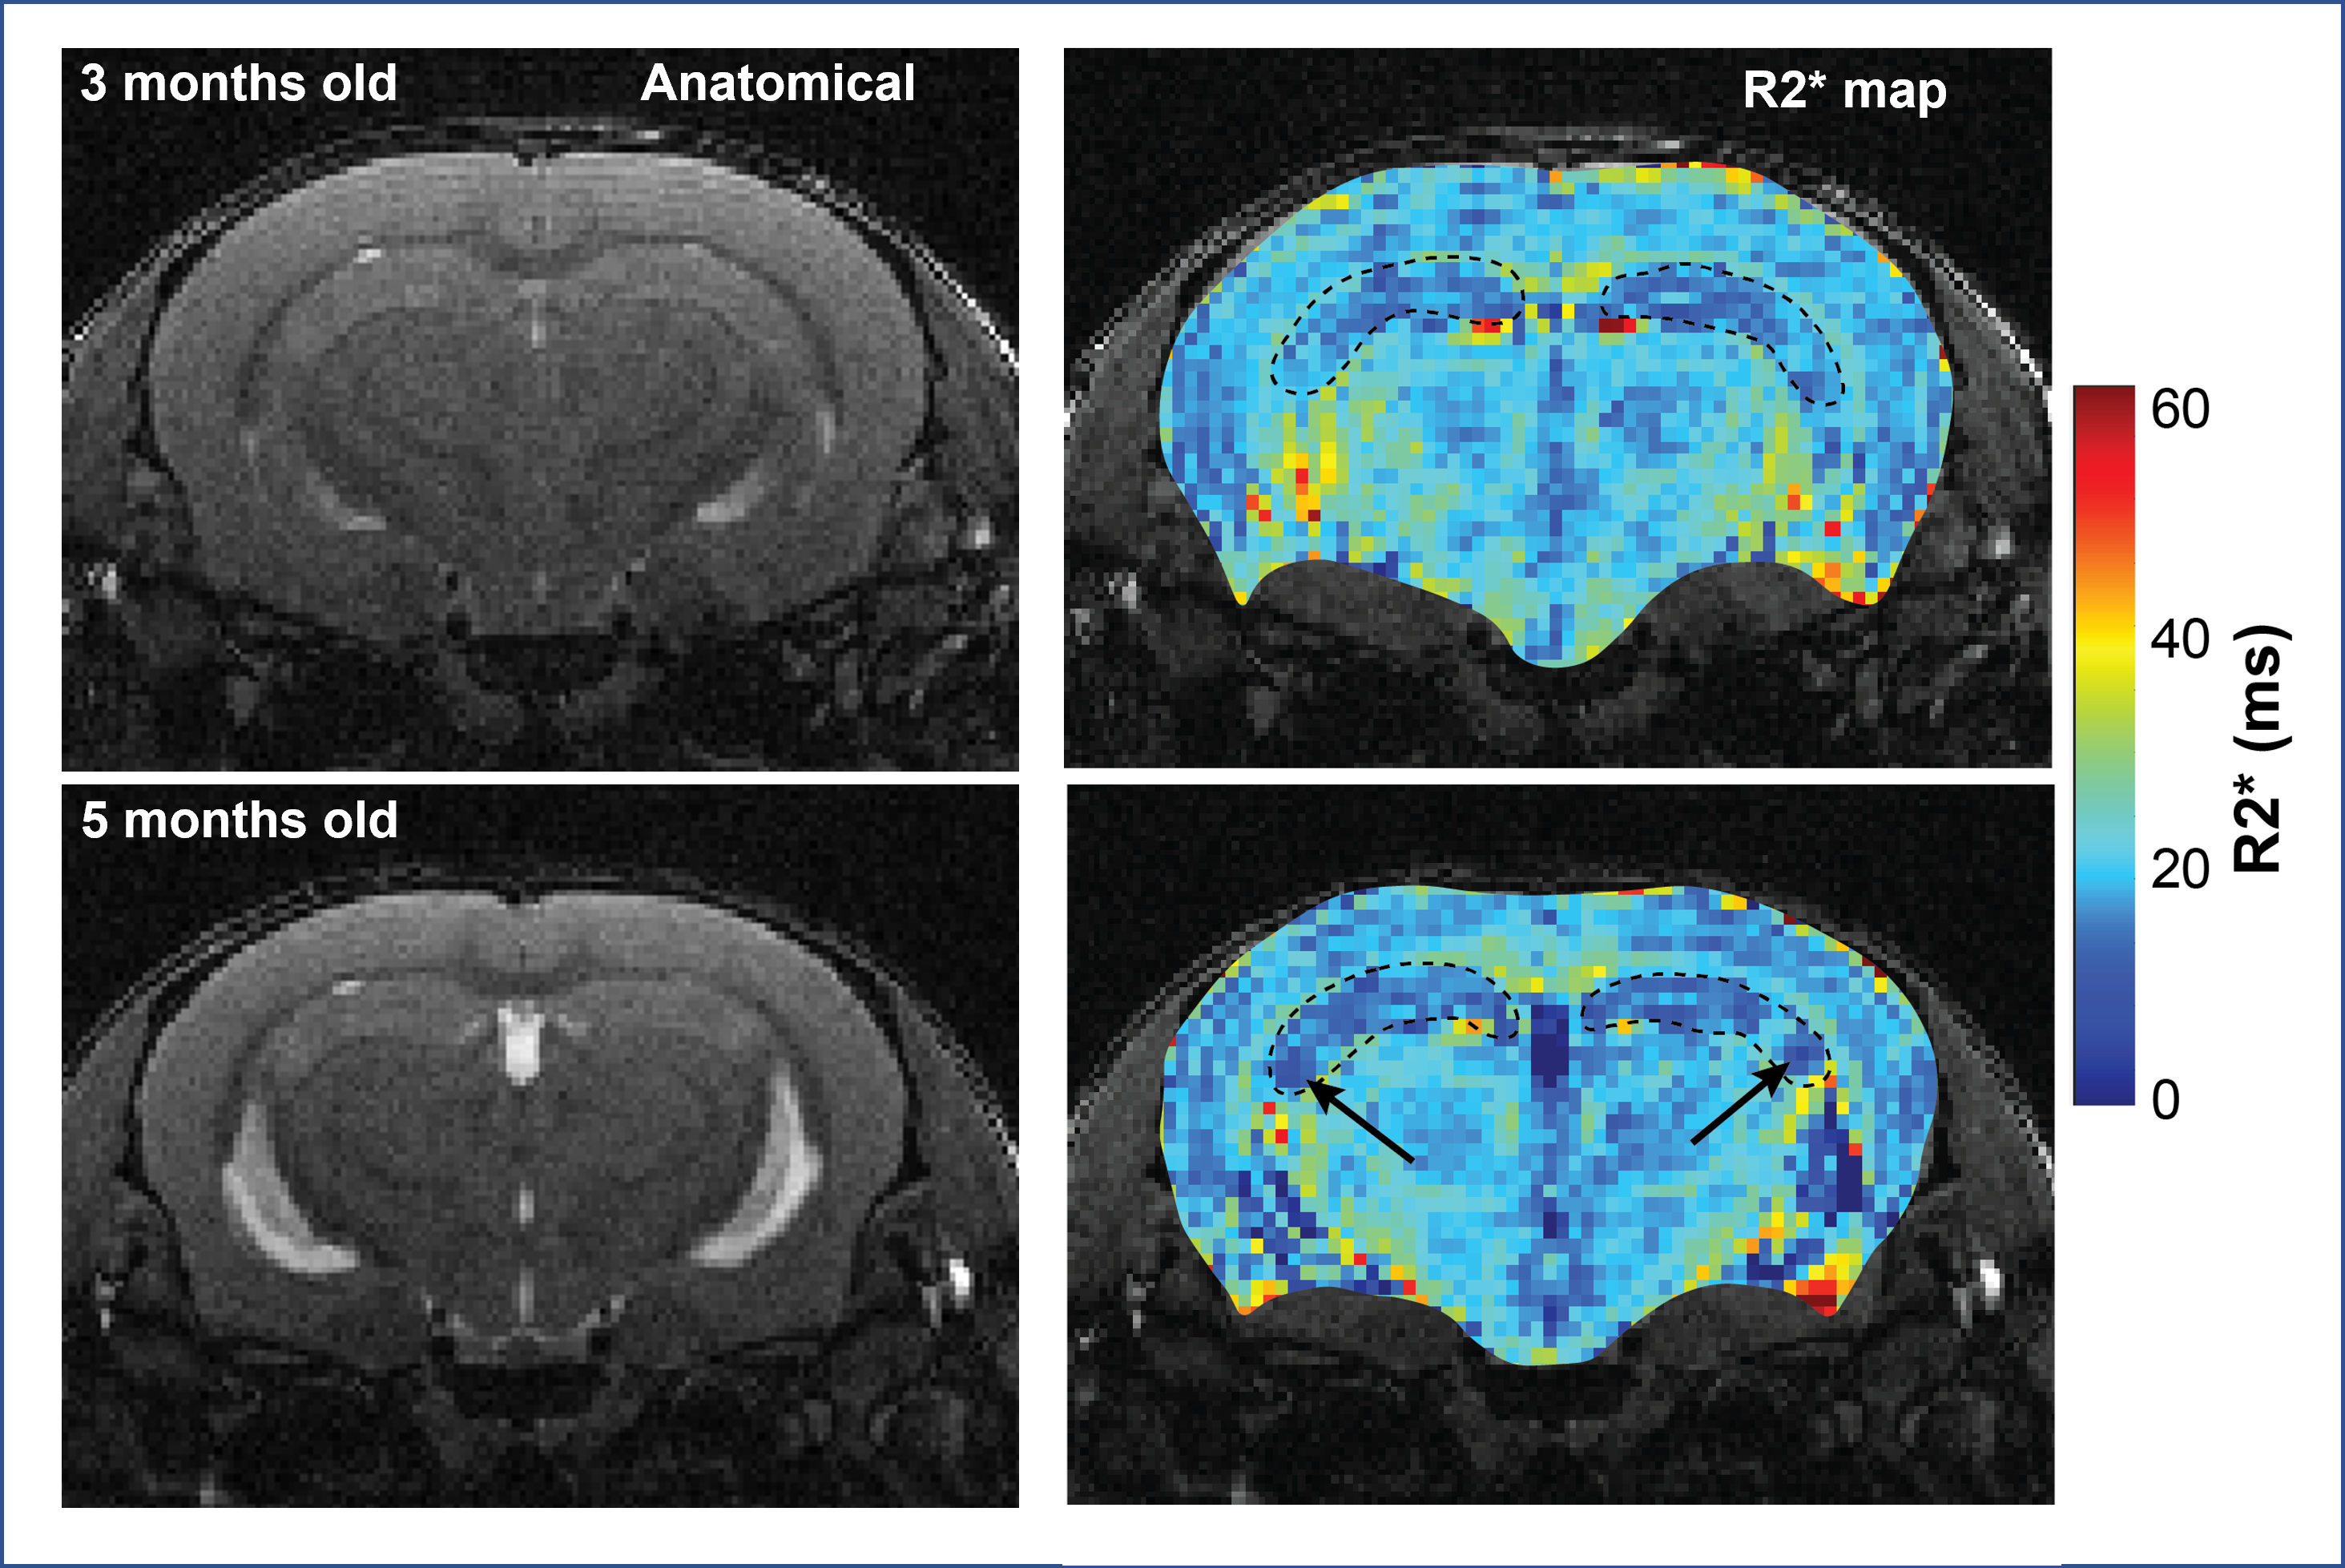
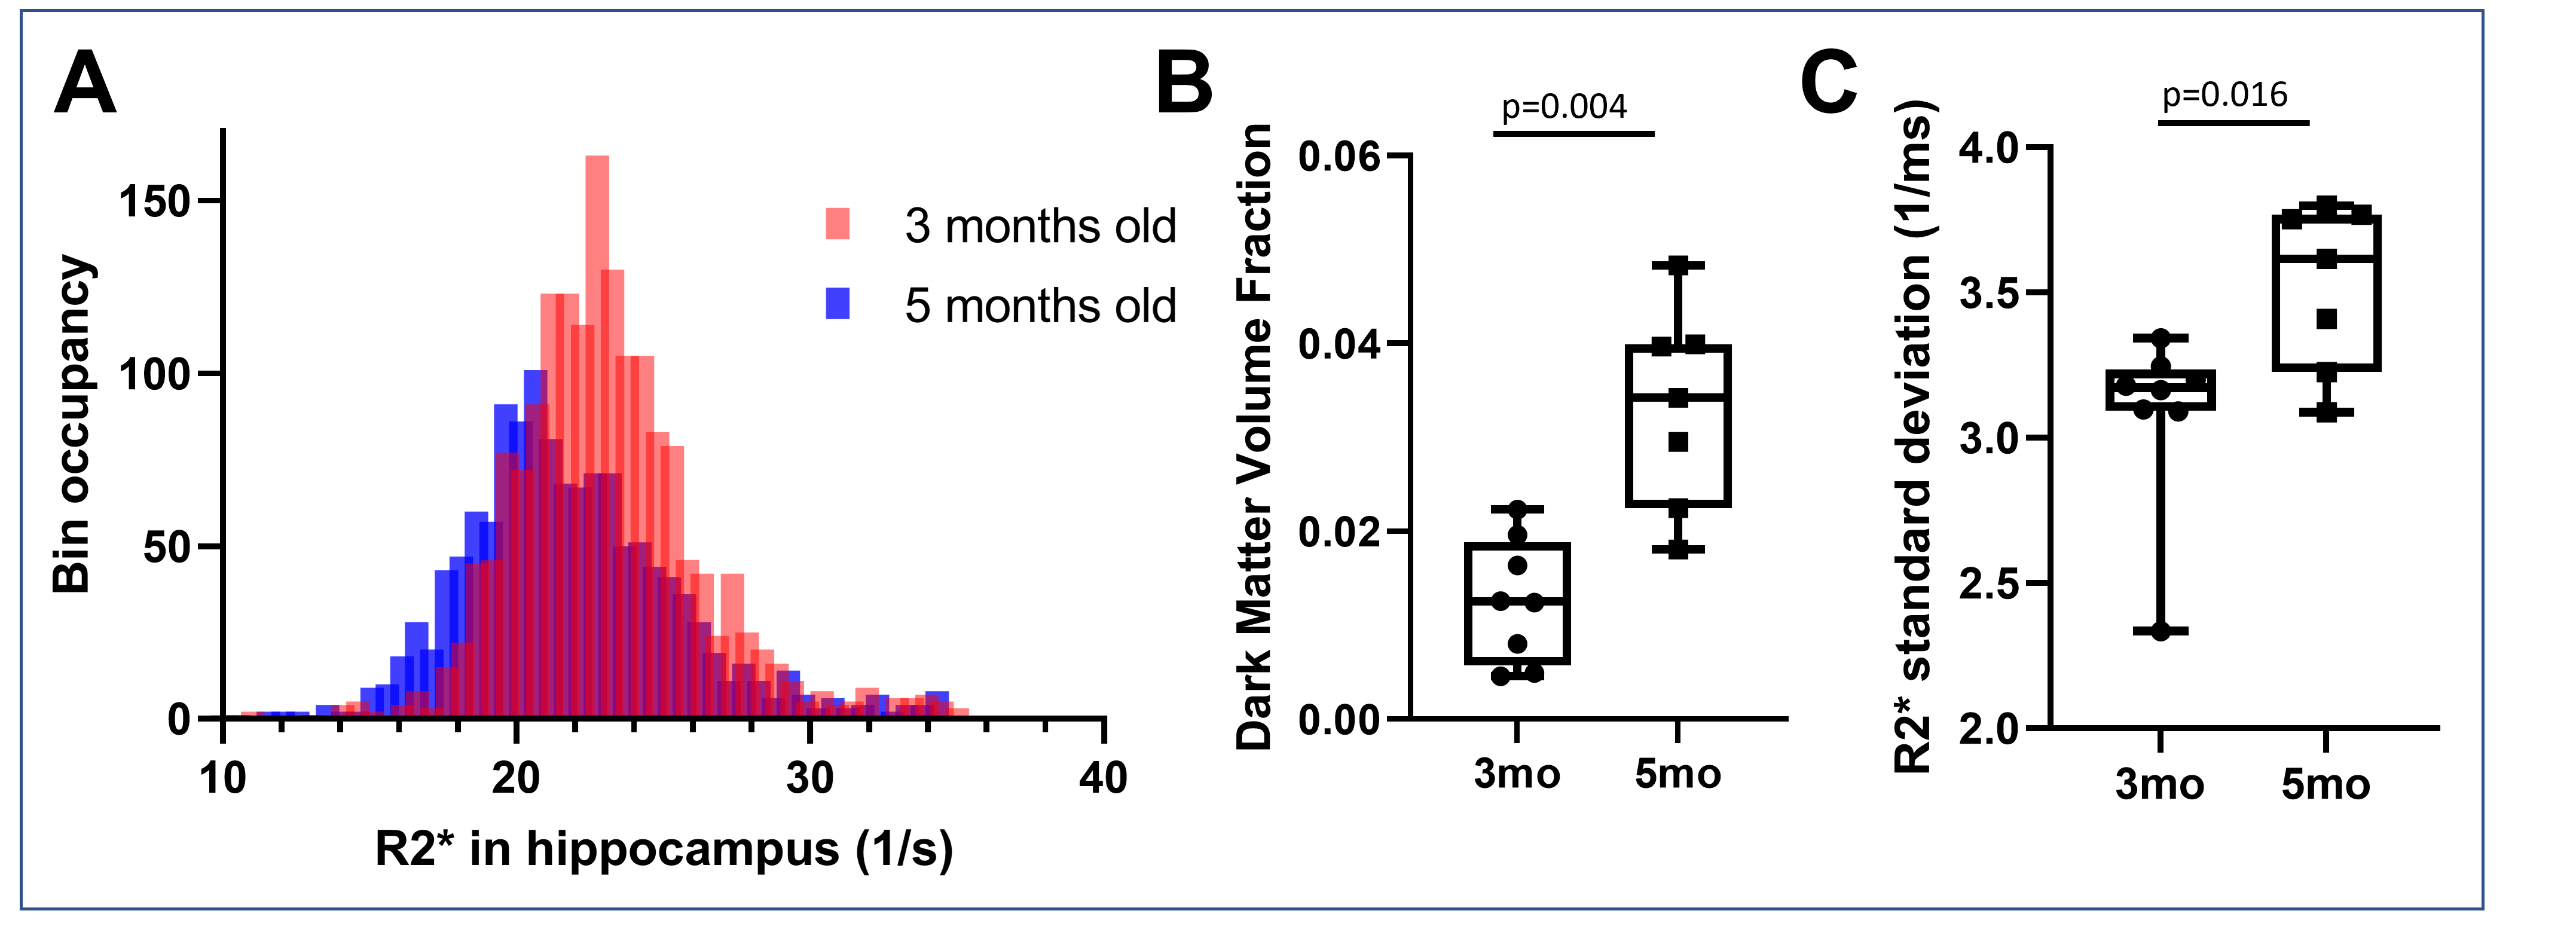
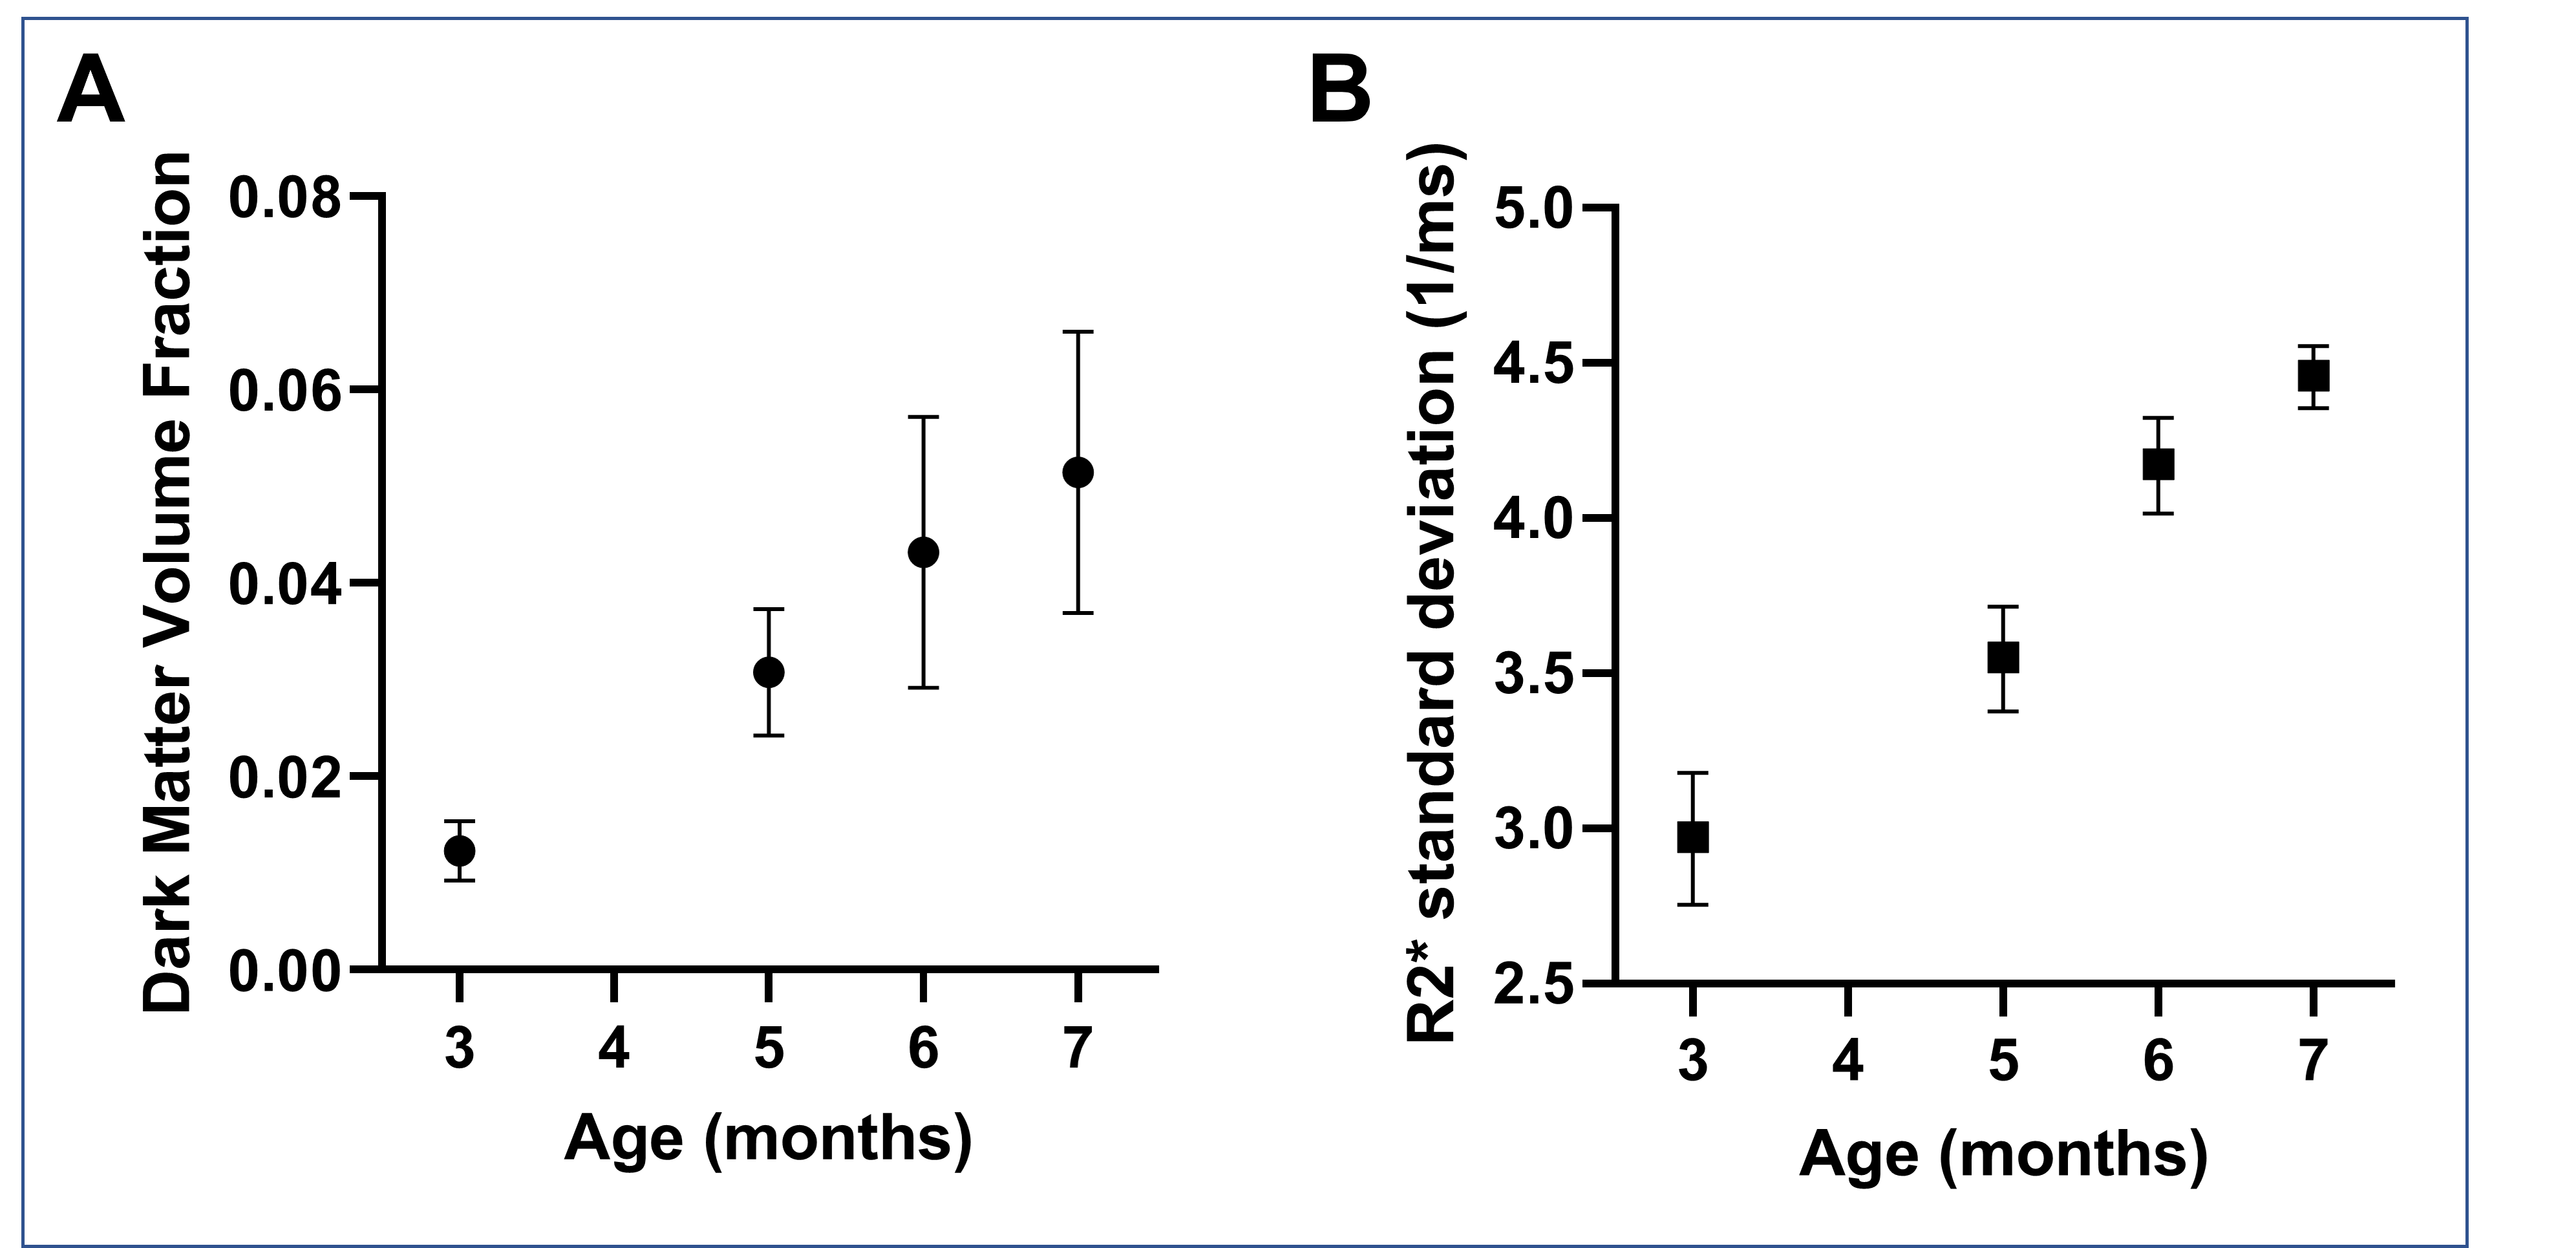
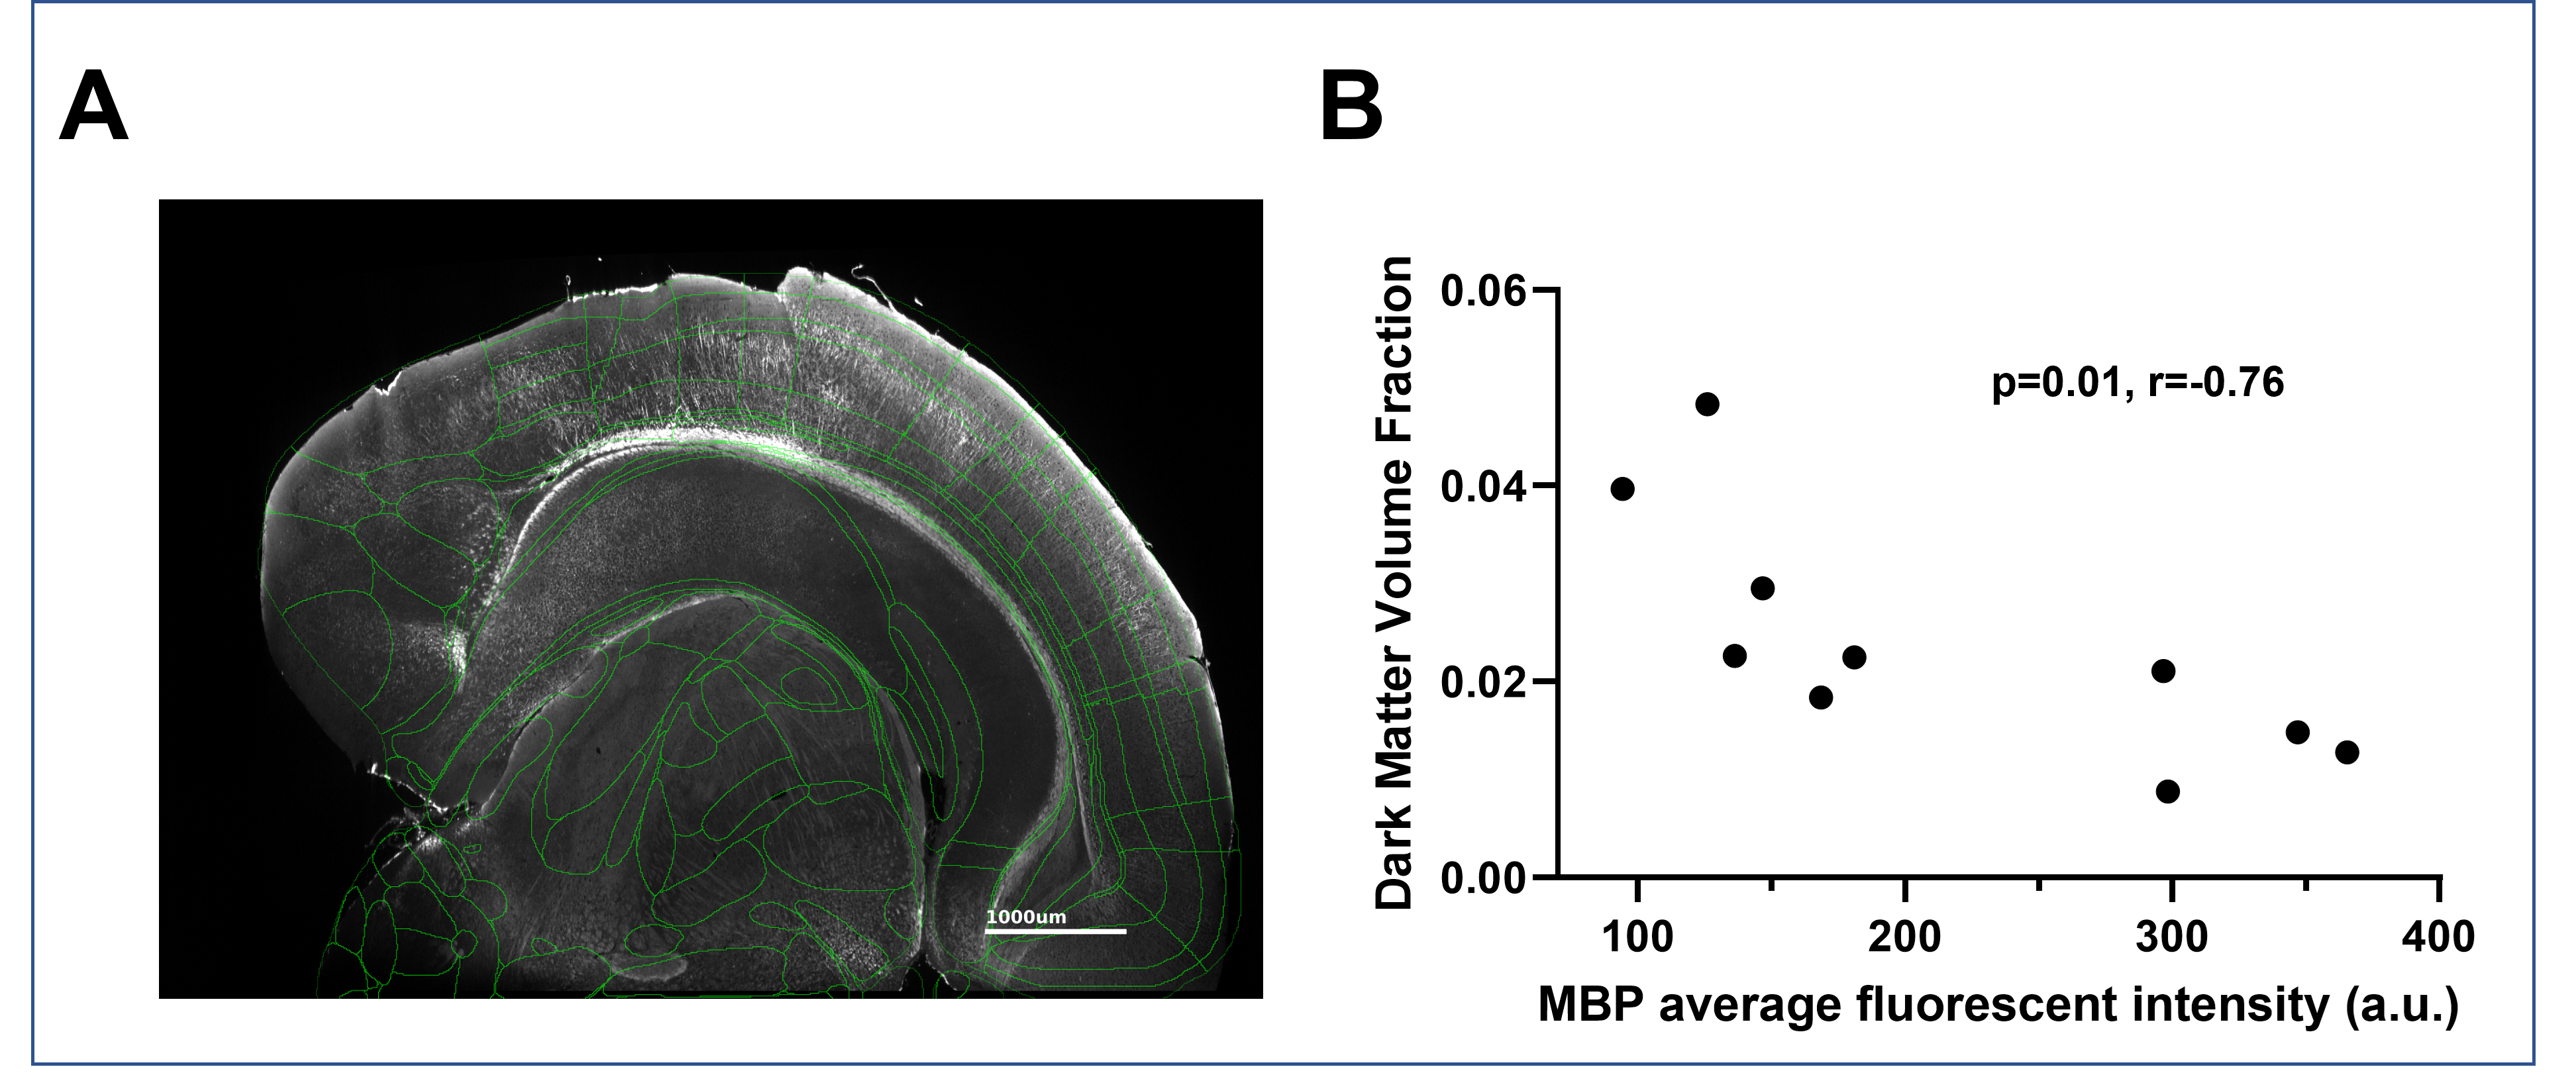
Light-sheet microscopy analysis revealed a significant decrease in NeuN staining between 3mo and 6mo in the hippocampus, indicating a decrease of over 30% in neuronal density (p<0.001, Figure 1), validating the mouse model used. Longitudinal analysis showed clear changes in R2* values in the Tg4510 hippocampus undergoing neurodegeneration between 3 and 5 months old (Figure 2). Histogram analysis revealed patterns of increase in low R2* value incidence (Dark Matter, DM), and broadening of R2* distribution (Figure 3A), in line with clinical observations [1]. Threshold of DM was quantified as R2*<95% confidence limit of R2* distribution in 3mo mice (R2*=17.04ms). DM Volume Fraction (DMVF) was quantified together with R2* histogram standard deviation (SD) to capture the above changes. Highly significant increase in both DMVF and SD were measured between 3 and 5mo in Tg4510 mice (Figure 3B, p=0.004/p=0.016 DMVF/SD) but not in WT controls (p>0.25). Further monotonical increase was also observed in both metrics (Figure 4). To better understand the biological basis of the observed R2* metrics changes, further histological analysis for myelin protein (MBP) abundance was performed. Importantly, a significant negative correlation was observed between myelin content and the DMVF (Figure 5, p=0.01,r=-0.76), confirming loss of myelinated axons.Discussion
Neurodegeneration is an important hallmark of Alzheimer’s Disease, usually appearing long before volumetric brain changes and clinical symptoms. Its direct measurement method is urgently needed to provide an early AD biomarker. This is particularly relevant for rodent models, such as the well-established Tg4510 used in this study, where cognitive markers are of limited use, and a longitudinal insight into neuronal loss is desired. In this study a method is proposed for using R2* relaxometry as a direct biomarker of the neuronal loss. Low R2* volume fraction (DM) and the heterogeneity of R2*, quantified as histogram standard deviation, both show high sensitivity for capturing longitudinal neurodegeneration. Direct biological interpretation of MR parameters is challenging, yet a significant correlation observed between the R2* and myelin content in the mouse hippocampus suggests the measured changes may be caused by disruption of cell membranes and concomitant loss of myelinated axons due to neuronal cell death.Conclusions
In conclusion, the presented technique, together with accompanying histological validation is of high importance to drug discovery and can be readily applied in preclinical models of neurodegeneration for pharmacodynamics and mechanism of action assessment.Acknowledgements
D.A.Y. and A.L.S. are supported by NIH RF1 AG082030 and RF1 AG077658.References
[1] S. Kothapalli et al., "Quantitative Gradient Echo MRI Identifies Dark Matter as a New Imaging Biomarker of Neurodegeneration that Precedes Tisssue Atrophy in Early Alzheimer's Disease," J Alzheimers Dis, vol. 85, pp. 905-924, Dec 9 2021, doi: 10.3233/JAD-210503.
[2] X. Ulrich and D. A. Yablonskiy, "Separation of cellular and BOLD contributions to T2* signal relaxation," Magn Reson Med, vol. 75, no. 2, pp. 606-15, Feb 2016, doi: 10.1002/mrm.25610.
[3] M. Ramsden et al., "Age-dependent neurofibrillary tangle formation, neuron loss, and memory impairment in a mouse model of human tauopathy (P301L)," The Journal of neuroscience : the official journal of the Society for Neuroscience, vol. 25, no. 46, 11/16/2005 2005, doi: 10.1523/JNEUROSCI.3279-05.2005.
[4] D. A. Yablonskiy, A. L. Sukstanskii, J. Luo, and X. Wang, "Voxel spread function method for correction of magnetic field inhomogeneity effects in quantitative gradient-echo-based MRI," Magn Reson Med, vol. 70, no. 5, pp. 1283-92, Nov 2013, doi: 10.1002/mrm.24585.
[5] X. He, M. Zhu, and D. A. Yablonskiy, "Validation of oxygen extraction fraction measurement by qBOLD technique," Magn Reson Med, vol. 60, no. 4, pp. 882-8, Oct 2008, doi: 10.1002/mrm.21719.
Figures