4098
Quantitative T1rho with pulsed spinlock Using Toggling Inversion Preparation1Department of Imaging and interventional radiology, The Chinese University of Hong Kong, Hong Kong, Hong Kong, 2Illuminatio Medical Technology Limited, Hong Kong, Hong Kong, 3Philips Healthcare, Hong Kong SAR, Hong Kong, Hong Kong
Synopsis
Keywords: RF Pulse Design & Fields, Quantitative Imaging, T1rho ; pulsed spinlock;pulse sequence;
Motivation: Conventional T1rho techniques require sufficiently long TSL (time of spinlock) to ensure reliable T1rho quantification, However, maximum TSL allowed in clinical MR scanners is often limited by SAR (specific absorption rate) and RF amplifier to ensure patient safety and prevent damage to the scanners.
Goal(s): Our proposed toggling inversion preparation pulsed spinlock mitigates the problem by employing a train of spinlock pulses with a gap duration between two pulses.
Approach: We Confirmed our conjectures using simulation, phantom, and in vivo experiment.
Results: Our approach can achieve reliable T1rho quantification using longer TSL compared to the conventional spinlock technique.
Impact: The Proposed method has potential to enable T1rho imaging of tissue with relatively long relaxation time and at MRI system where continus spin-lock is challenging.
Introduction
The longitudinal relaxation time in the rotating frame 1, known as T1rho, can be used to probe tissue properties due to its sensitivities to spin dynamics including dipole-dipole interactions, chemical exchange, and magnetization transfer 2,3. Literatures have reported that T1rho is promising in many clinical applications4-8. T1rho imaging, however, is often limited by specific absorption rate (SAR) and hardware available in clinical MRI systems. In this study, we propose a pulsed spin-lock technique for quantitative T1rho imaging to mitigate this challenge. It is important to note that, unlike a single spin-lock radiofrequency (RF) pulse, the relaxation model of using a train of spin-lock RF pulses is highly complicated9 and we cannot use a conventional mono-exponential model to quantify T1rho in this case. We propose a novel approach to address this issue and simplify T1rho quantification.Methods
The pulse sequence contains multiple repeating spin-lock modules. Each spin-lock module consists of a spin-lock RF cluster followed by an idle time without RF irradiation with a duration of Td. Figure 1 shows a schematic diagram of our proposed pulsed spinlock sequence. For a spin-lock module with a spin-lock RF pulse with the duration Tp and a constant RF amplitude, the magnetization M at the end of a spin-lock module can be expressed by the following equation:$$
M=M_{ini}e^{-R_{1\rho}Tp}+M_{ss}(1-e^{-R_{1\rho}Tp}) \tag{1}
$$
where$$$M_{ini}$$$ is the initial magnetization after the head RF pulse and before the spin-lock RF pulse;$$$ (R_{1\rho}=1/T_{1\rho})$$$. $$$M_{ss}$$$is the steady-state magnetization. A train with multiple spin-lock modules can achieve a much longer total Tp compared to a single spin-lock module without violating RF power limit. In the presence of a train of 2 or more spin-lock modules, the magnetization at the end of the train of spin-lock modules denoted as $$$M_{sl\_train\_1}$$$can be derived using the equation (1) and T1 relaxation during the idle time Td:
$$M_{sl\_train\_1}=(M_{ini}-M_{ss})e^{-R_{1\rho}Tp\cdot n}e^{-R_{1}Td\cdot (n-1)}+(M_{ss}-M_{0})[(e^{-R_{1}Td}e^{-R_{1\rho}Tp}-e^{-R_{1\rho}Tp})\cdot a_{n-1}]+M_{ss} \tag{2}$$
where$$$ (R_{1}=1/T_{1})$$$is the tissue spin-lattice relaxation rate; n is the number of spin-lock modules in the pulsed spin-lock; and $$$M_{0}$$$is the equilibrium magnetization. $$$a_{n-1}$$$is a recursive formula and is defined as$$$ a_{1}=1, a_{n}=e^{-R_{1}Td}\cdot e^{-R_{1\rho}Tp}\cdot a_{n-1} +1$$$for n ≥ 2.
The second magnetization signal is acquired with initial magnetization $$$-\alpha M_{ini}$$$by employing an inversion RF pulse prior to pulsed spinlock9,10, and they share the same stead-state magnetization $$$M_{ss}$$$.The magnetization at the end of the second spin-lock train can be denoted as $$$M_{sl\_train\_2}$$$:
$$M_{sl\_train\_2}=(-\alpha M_{ini}-M_{ss})e^{-R_{1\rho}Tp\cdot n}e^{-R_{1}Td\cdot (n-1)}+(M_{ss}-M_{0})[(e^{-R_{1}Td}e^{-R_{1\rho}Tp}-e^{-R_{1\rho}Tp})\cdot a_{n-1}]+M_{ss} \tag{3}$$
where $$$\alpha$$$is the inversion efficiency that equals 1 for ideal inversion. By subtracting the equation (2) from the equation (3), the magnetization equation may be essentially simplified into a mono-exponential model that allows more convenient quantification:
$$M_{fin}=M_{sl\_train\_1}-M_{sl\_train\_2}=(\alpha+1)M_{ini}e^{-R_{1\rho}Tp\cdot n}e^{-R_{1}Td\cdot (n-1)} \tag{4}$$
Denote$$$A=(\alpha+1)M_{ini}e^{-R_{1}Td\cdot (n-1)}$$$, and time-of-spin-lock time (TSL) equal$$$Tp\cdot n$$$ then $$$M_{fin}=Ae^{-R_{1\rho}TSL}$$$.
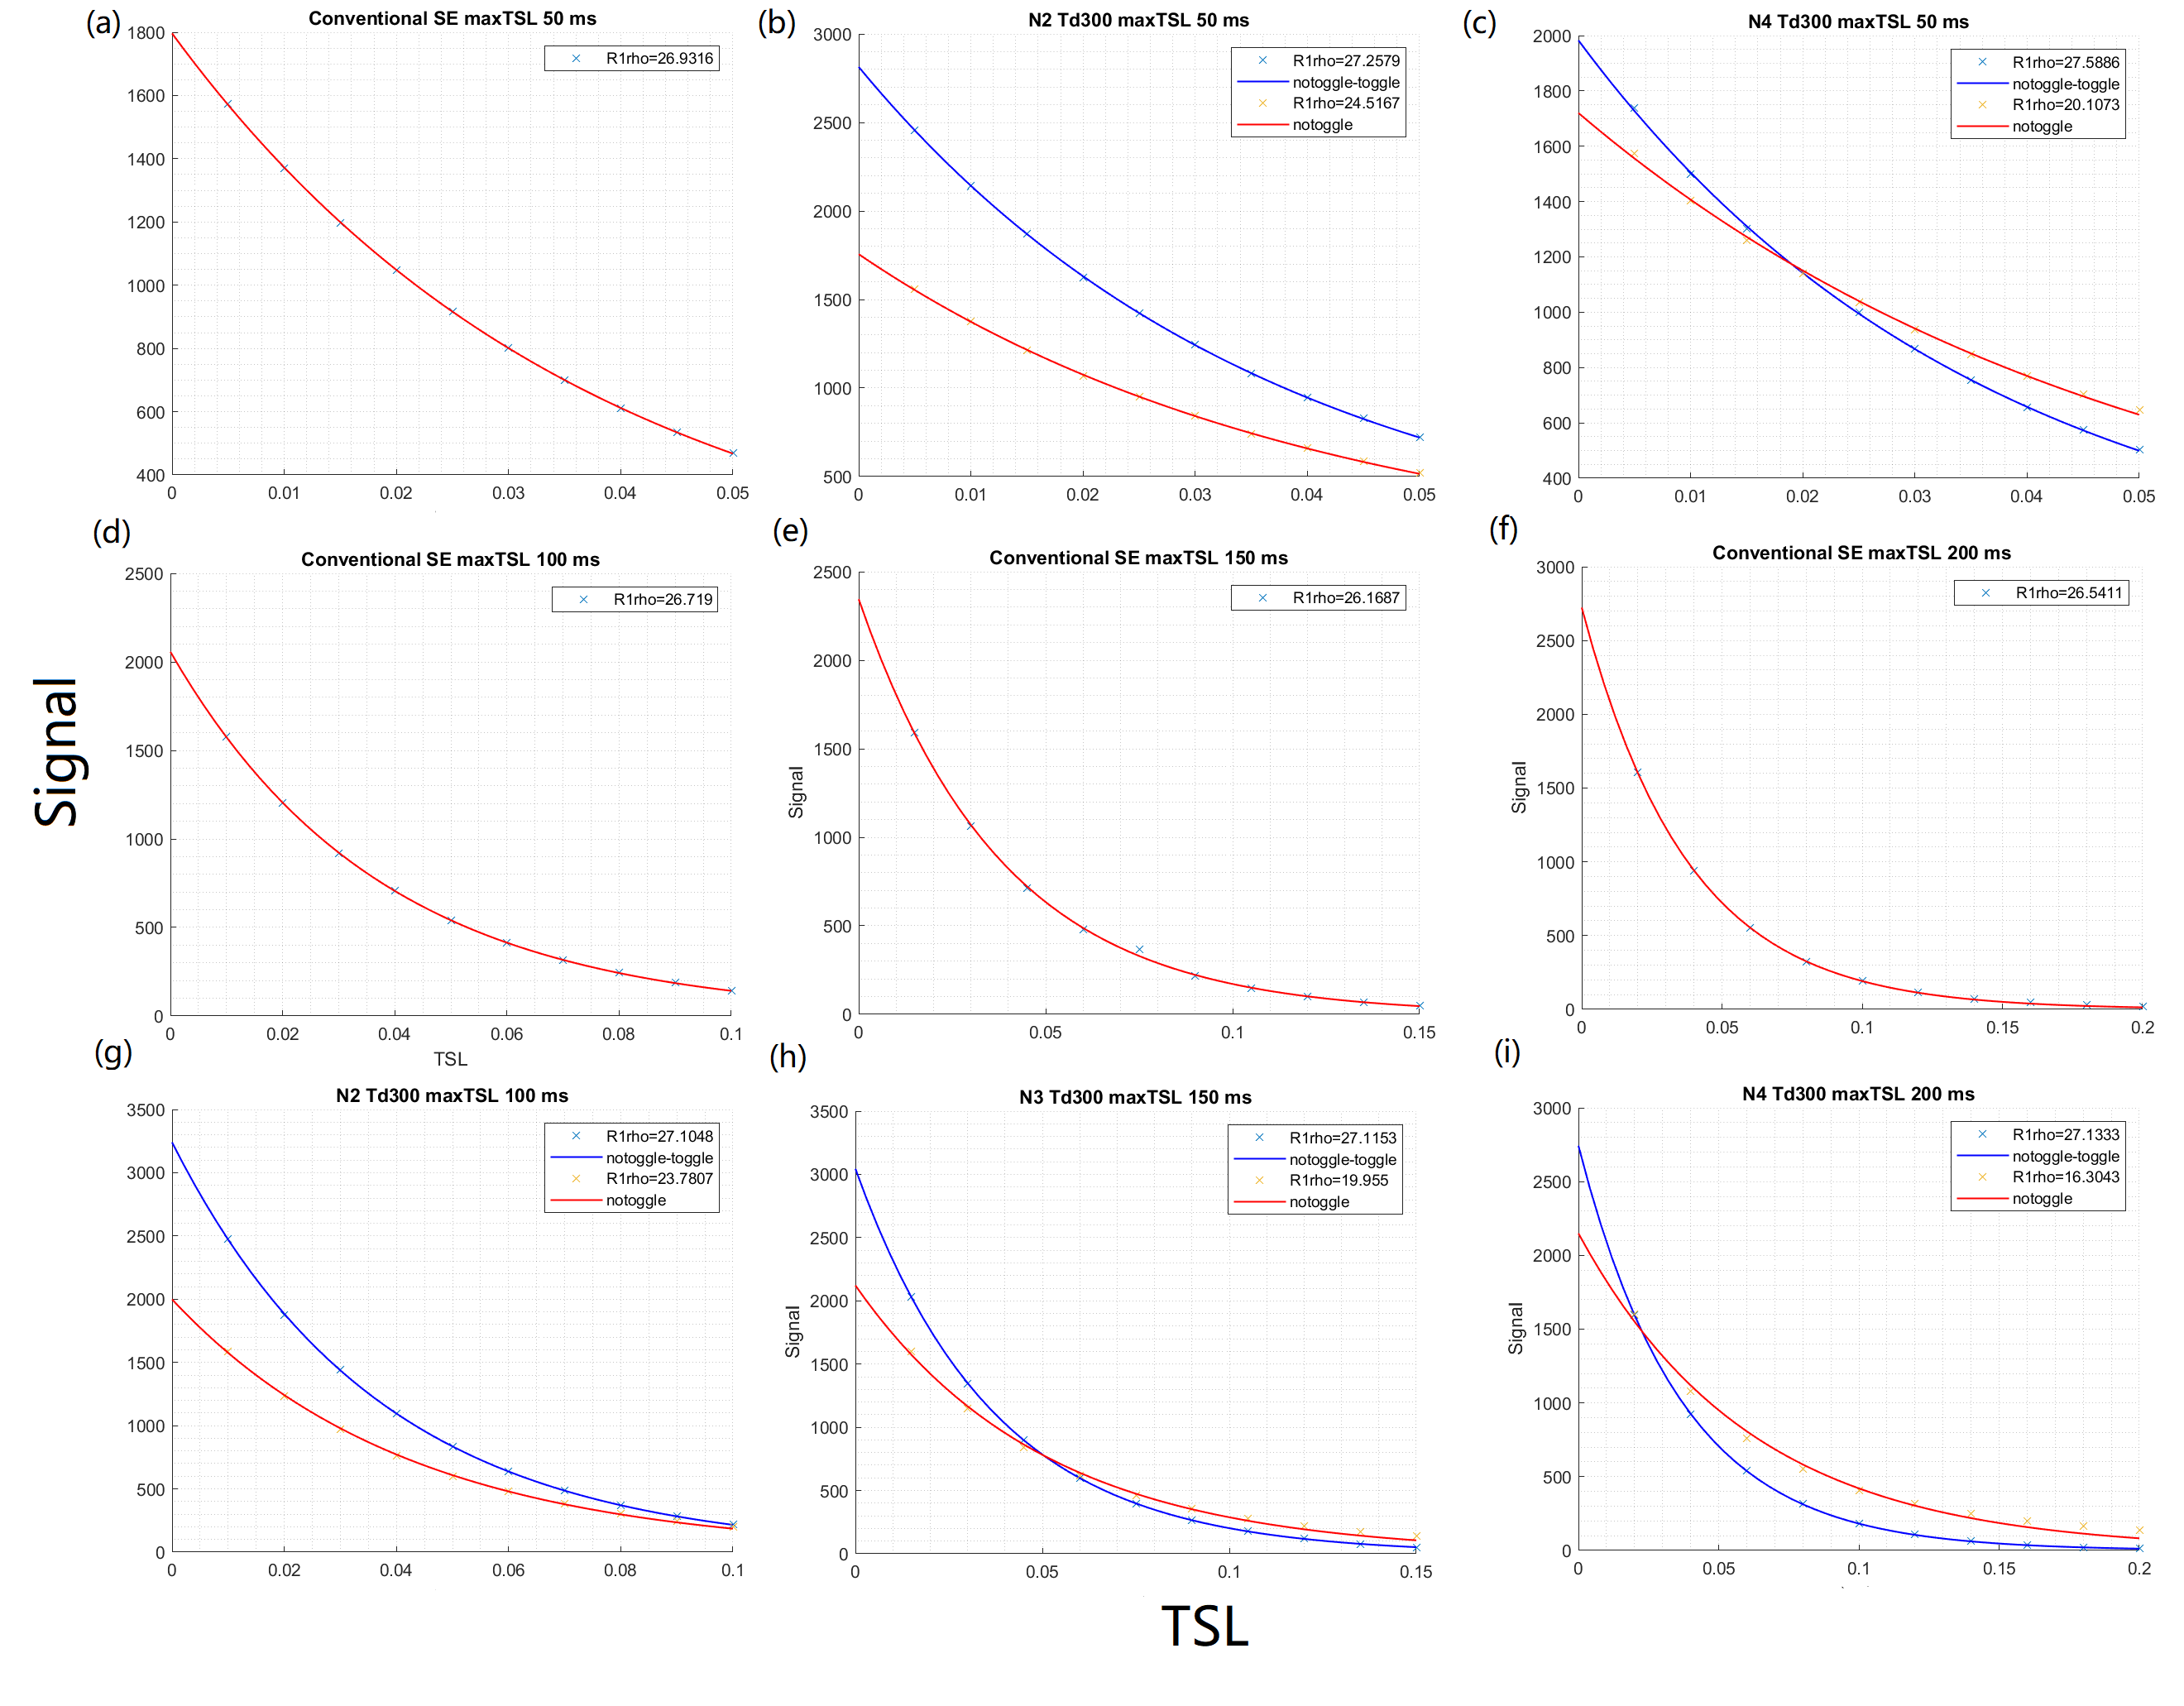
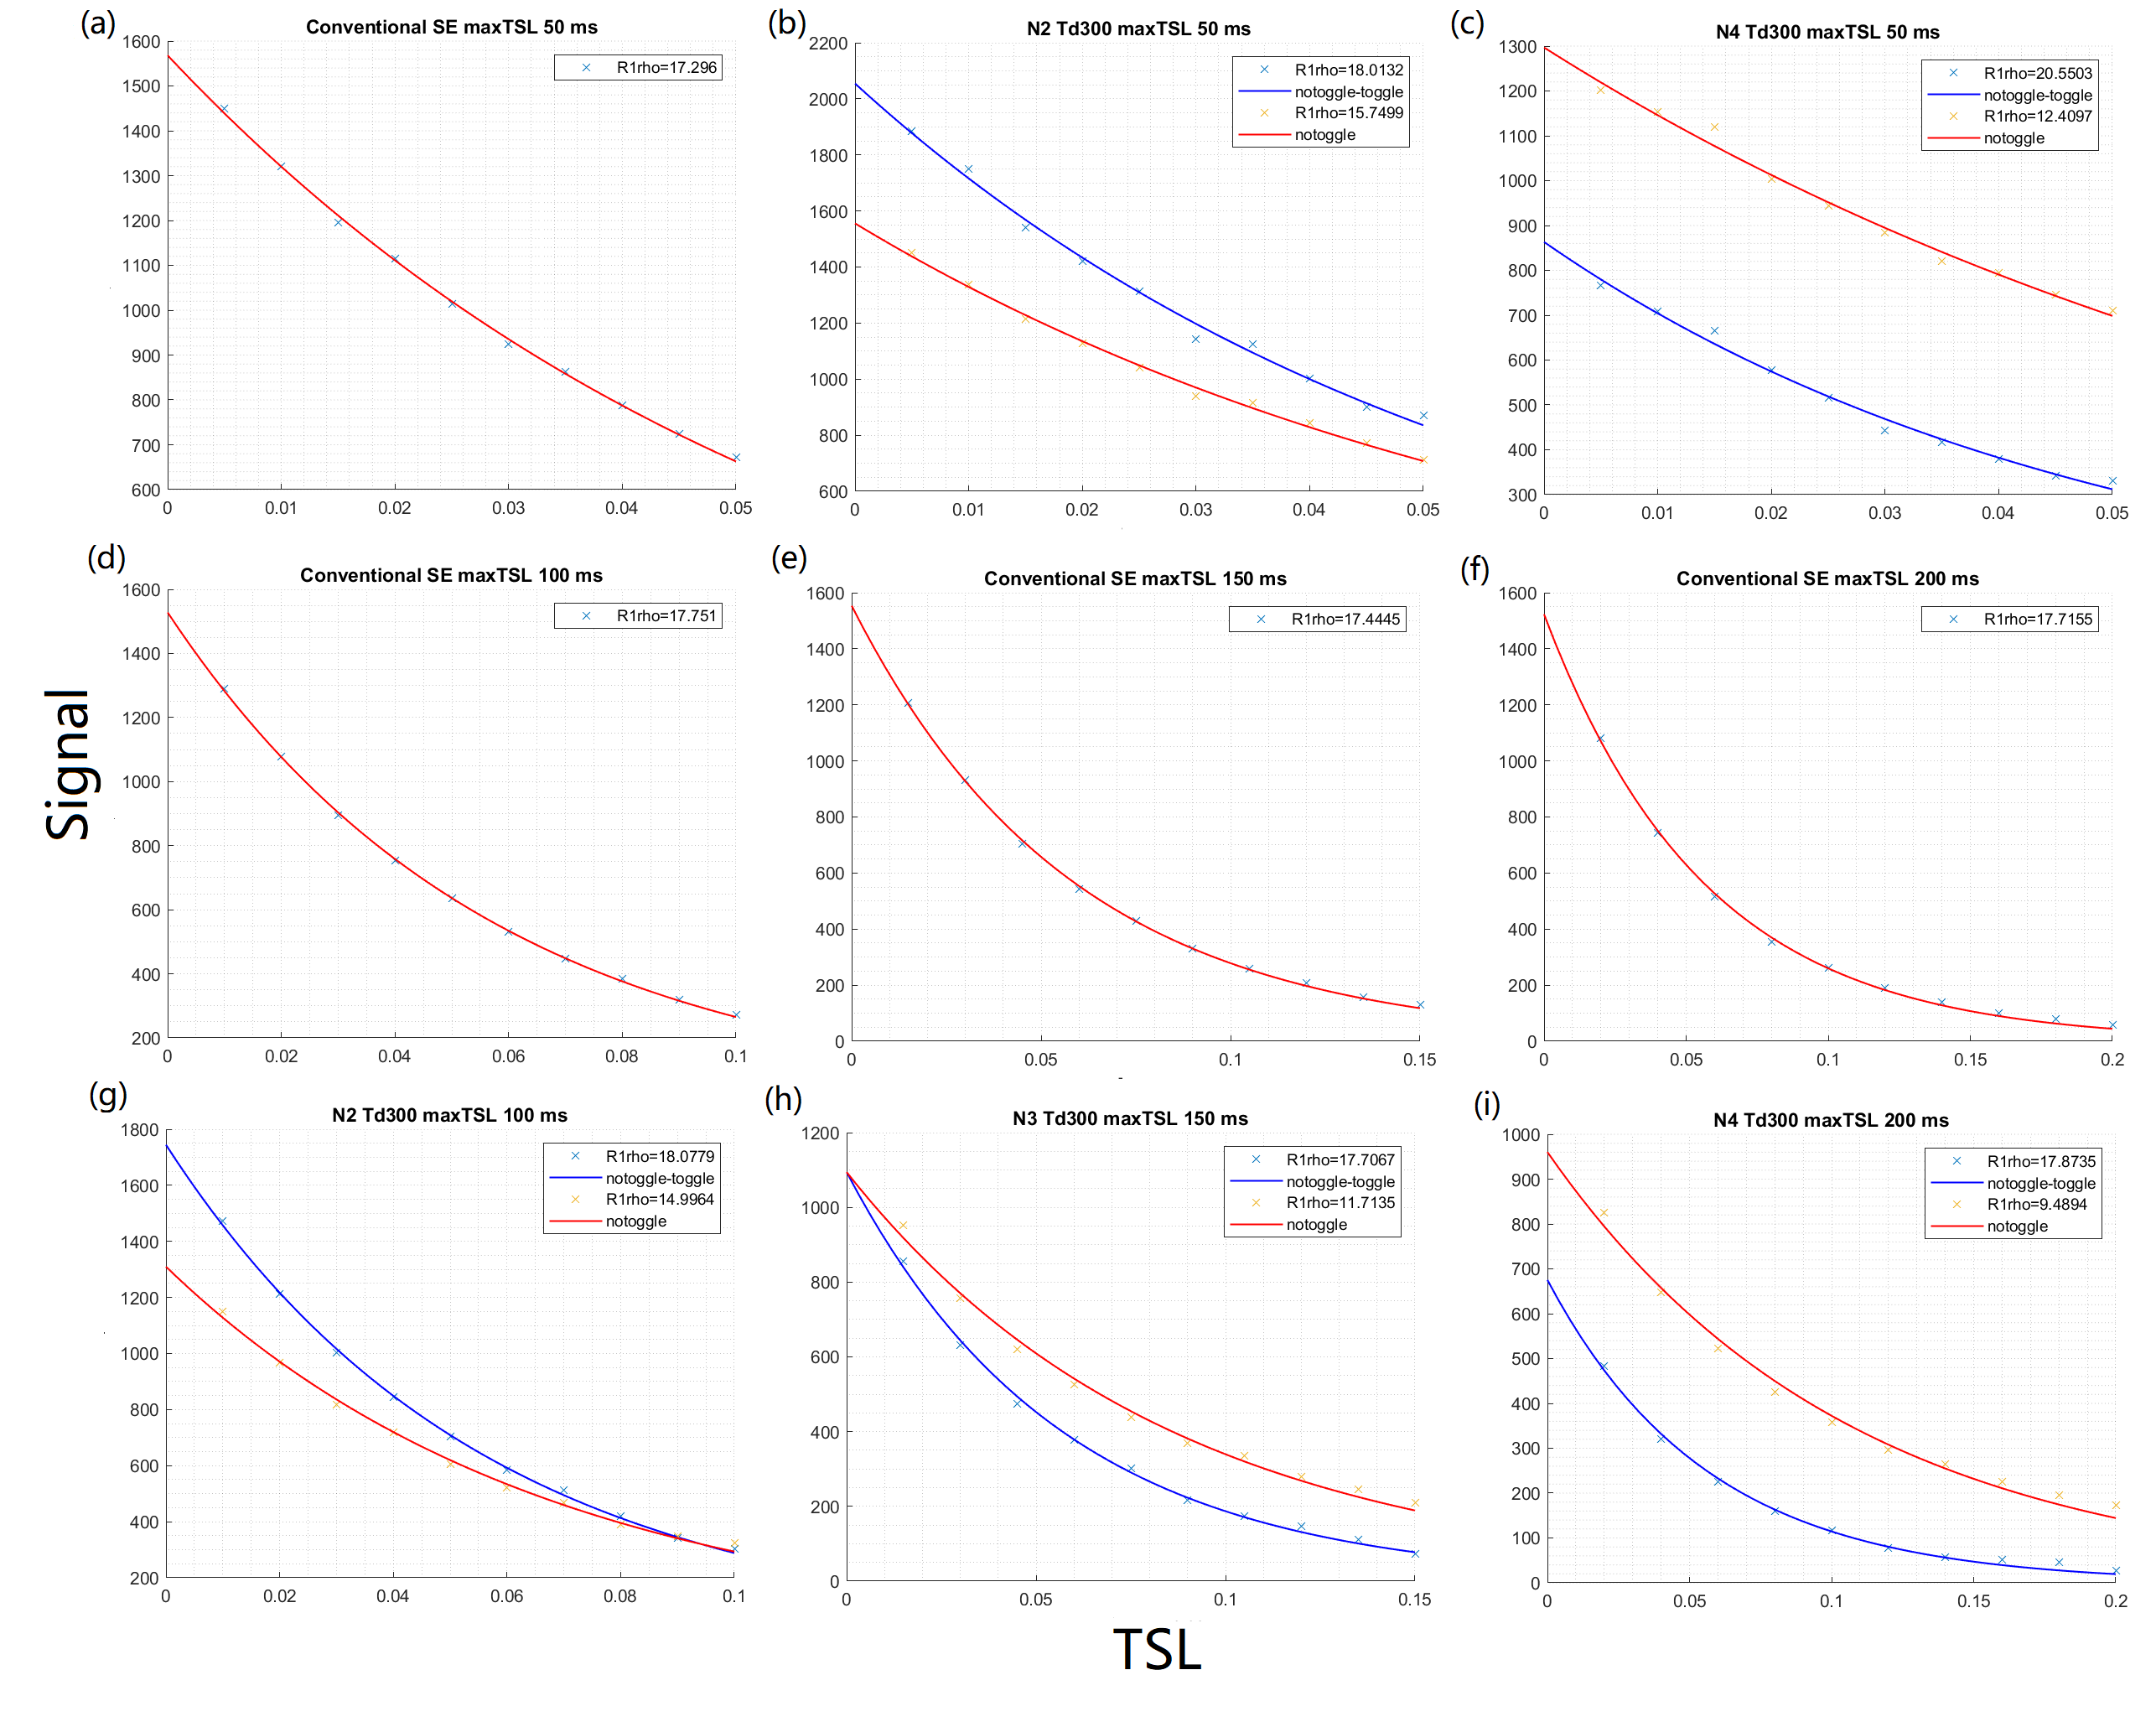
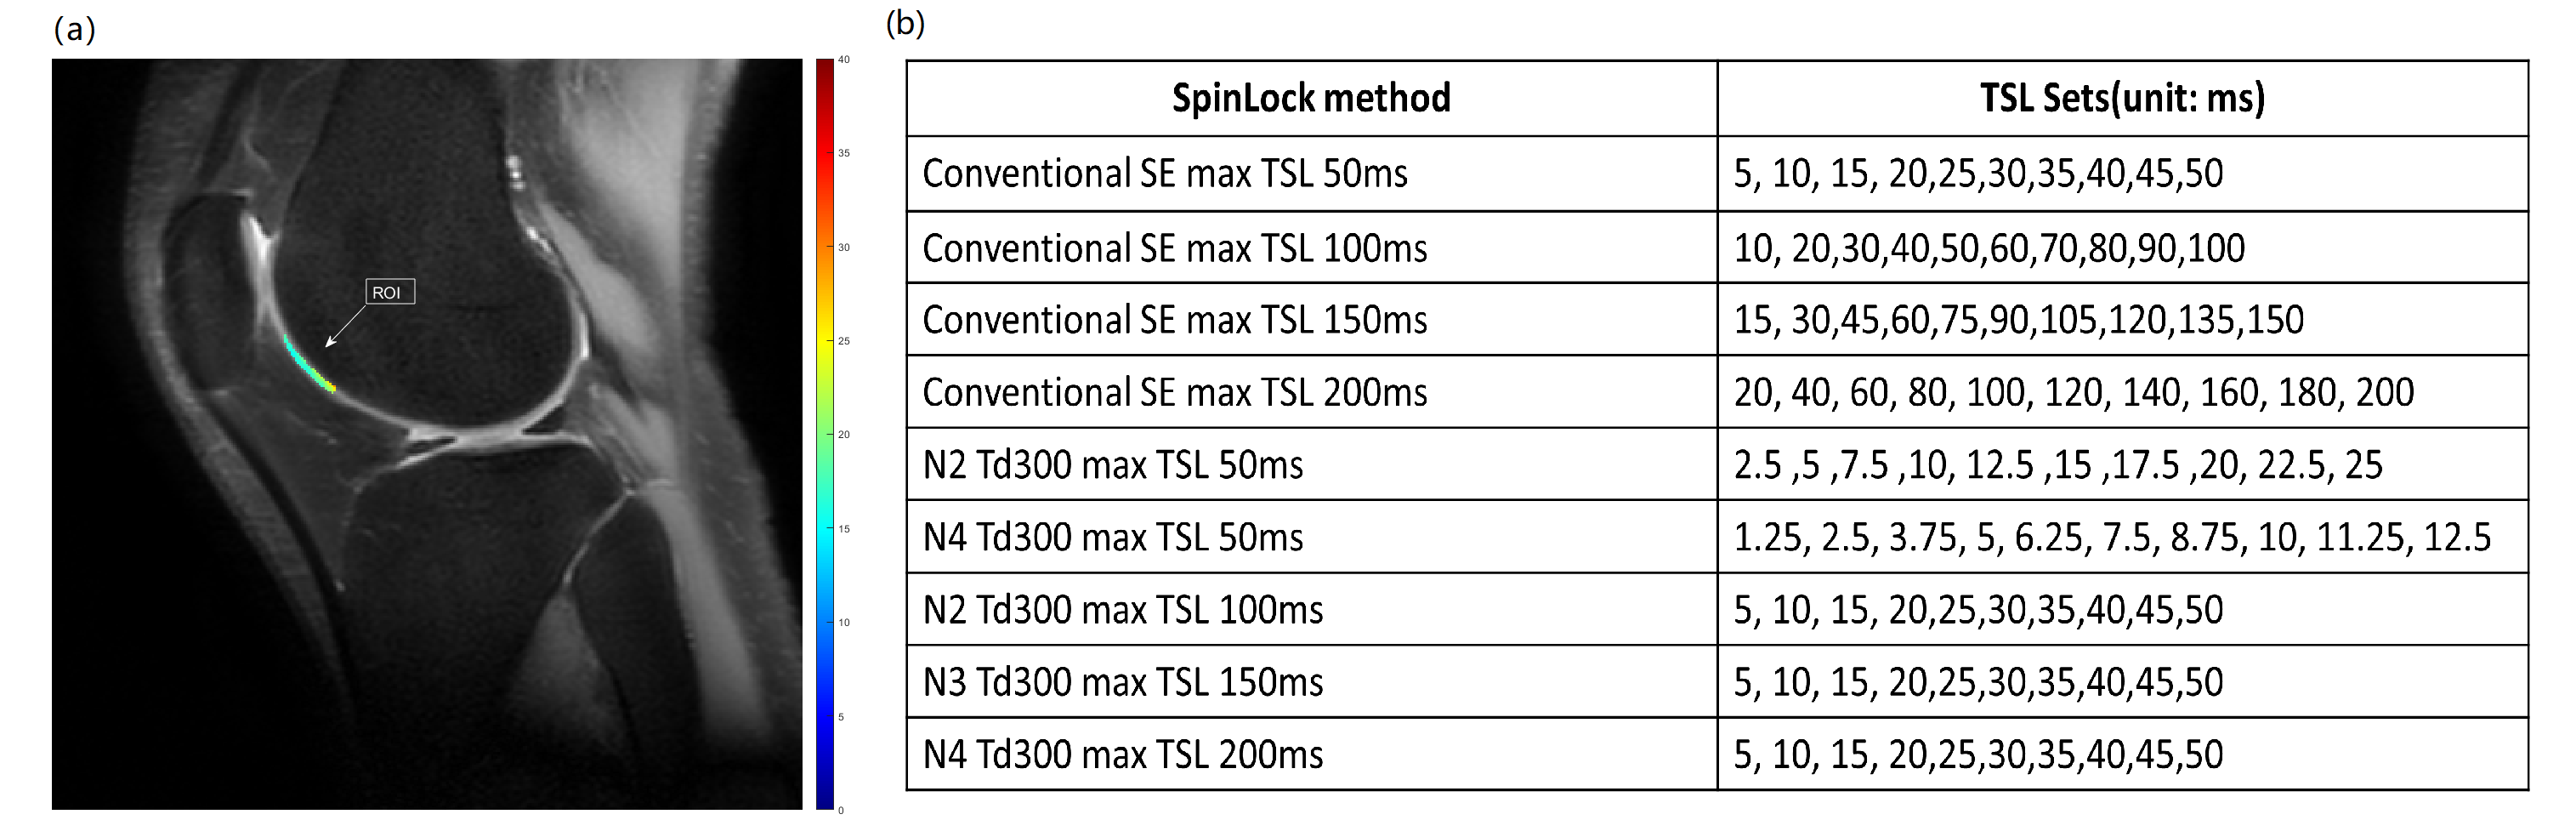
One pool, two pool, and three pool full-equation Bloch-McConnell simulations were performed on single spinlock and our proposed pulsed spinlock technique. R1rho fitting was performed using a conventional mono-exponential model. Parameters can be found in Figure2 caption. Relaxation and fitted curves were plotted together for both methods. All phantom and in vivo experiments were conducted on a Philips Elition 3T MRI scanner (Philips Healthcare, Best, the Netherlands). A T/R knee coil was used for phantom and volunteer knee experiment. After spin-lock preparation, the imaging data was acquired using 2D Fast/Turbo Spin Echo (FSE/TSE) readout and Dicom images were processed and fitted to a conventional mono-exponential model using home-written MATLAB(MathWorks, USA) program. Similar to simulation studies, relaxation and fitted curves were plotted together for both methods. Phantom and in vivo Parameters can be found in Figure3 and Figure4 caption respectively.
Results
Simulation, phantom, and in vivo results show that pulsed spinlock technique without an inversion preparation does not follow the conventional mono-exponential relaxation model, and the fitted R1rho values do not agree with R1rho obtained using the conventional spinlock technique. In contrast, by acquiring a second set of data with inversion preparation and perform subtraction of two datasets, we can see that pulsed spinlock now follows mono-exponential relaxation model, and R1rho values obtained is comparable to those obtained using conventional spinlock.Discussion and Conclusion
In this study, we demonstrated using simulation, phantom, and in vivo experiments that inversion preparation pulsed spinlock can achieve reasonable R1rho quantification compared to the conventional spinlock. Note that some oscillations can be observed in pulsed spinlock, which are likely caused by B0 field inhomogeneity and knee motion during scan. The pulsed spinlock can reduce SAR and RF power demand, it has the potential to become an alternative spinlock approach for spinlock application of larger cross section and wide-bore scanners.Acknowledgements
This study was supported by a grant from the Research Grants Council of the Hong Kong SAR (Project GRF 14201721), and a grant from the Innovation and Technology Commission of the Hong Kong SAR (Project No. MRP/046/20x). The research was conducted in part at CUHK DIIR MRI Facility, which is jointly funded by Kai Chong Tong, HKSAR Research Matching Grant Scheme and the Department of Imaging and Interventional Radiology, The Chinese University of Hong Kong.References
1. Redfield AG. Nuclear Magnetic Resonance Saturation and Rotary Saturation in Solids. Phys Rev. 1955. https://doi.org/10.21236/ad0060147
2. Gilani IA, Sepponen R. Quantitative rotating frame relaxometry methods in MRI. NMR in Biomedicine. 2016 Jun;29(6):841-61.
3.Morrison C, Henkelman RM. A model for magnetization transfer in tissues. Magn Reson Med. 1995 Apr;33(4):475-82. doi: 10.1002/mrm.1910330404. PMID: 7776877.
4. Regatte R, Akella S, Wheaton A, et al. 3D‐T1ρ‐relaxation mapping of articular cartilage: in vivo assessment of early degenerative changes in symptomatic osteoarthritic subjects. Acad Radiol. 2004;11(7):741‐749. https://doi.org/10.1016/s1076‐6332(04)00243‐0
5. Nestrasil I, Michaeli S, Liimatainen T, et al. T1ρ and T2ρ MRI in the evaluation of Parkinson's disease. J Neurol. 2010;257(6):964‐968.
6. Wang Y‐XJ, Yuan J, Chu ESH, et al. T1ρ MR imaging is sensitive to evaluate liver fibrosis: an experimental study in a rat biliary duct ligation model.Radiology. 2011;259(3):712‐719. https://doi.org/10.1148/radiol.11101638
7. Bustin A, Witschey WRT, van Heeswijk RB, Cochet H, Stuber M. Magnetic resonance myocardial T1ρ mapping: Technical overview, challenges, emerging developments, and clinical applications. J Cardiovasc Magn Reson. 2023 Jun 19;25(1):34. doi: 10.1186/s12968-023-00940-1. PMID: 37331930; PMCID: PMC10278347.
8. Han Y, Liimatainen T, Gorman RC, Witschey WR. Assessing Myocardial Disease Using T1ρ MRI. Curr Cardiovasc Imaging Rep. 2014 Feb 1;7(2):9248. doi: 10.1007/s12410-013-9248-7. PMID: 24688628; PMCID: PMC3968806.
9. Roeloffs V, Meyer C, Bachert P, Zaiss M. Towards quantification of pulsed spinlock and CEST at clinical MR scanners: an analytical interleaved saturation-relaxation (ISAR) approach. NMR Biomed. 2015 Jan;28(1):40-53. doi: 10.1002/nbm.3192. Epub 2014 Oct 18. Erratum in: NMR Biomed. 2018 Apr;31(4):e3906. PMID: 25328046.
10. Jin T, Kim SG. Quantitative chemical exchange sensitive MRI using irradiation with toggling inversion preparation. Magn Reson Med. 2012 Oct;68(4):1056-64. doi: 10.1002/mrm.24449. Epub 2012 Aug 6. PMID: 22887701; PMCID: PMC3458174
11.Witschey II WR, Borthakur A, Elliott MA, Mellon E, Niyogi S, Wallman DJ, Wang C, Reddy R. Artifacts in T1ρ-weighted imaging: Compensation for B1 and B0 field imperfections. Journal of magnetic resonance. 2007 May 1;186(1):75-85.
12. Stanisz GJ, Odrobina EE, Pun J, Escaravage M, Graham SJ, Bronskill MJ, Henkelman RM. T1, T2 relaxation and magnetization transfer in tissue at 3T. Magn Reson Med. 2005 Sep;54(3):507-12. doi: 10.1002/mrm.20605. PMID: 16086319.
13. Trott O, Palmer AG 3rd. R1rho relaxation outside of the fast-exchange limit. J Magn Reson. 2002 Jan;154(1):157-60. doi: 10.1006/jmre.2001.2466. PMID: 11820837.
Figures
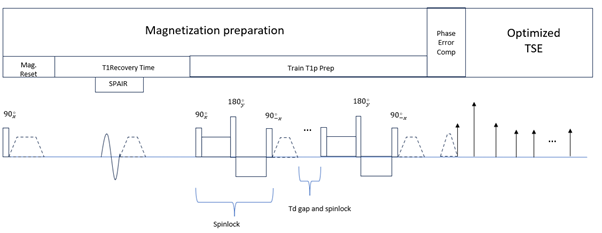
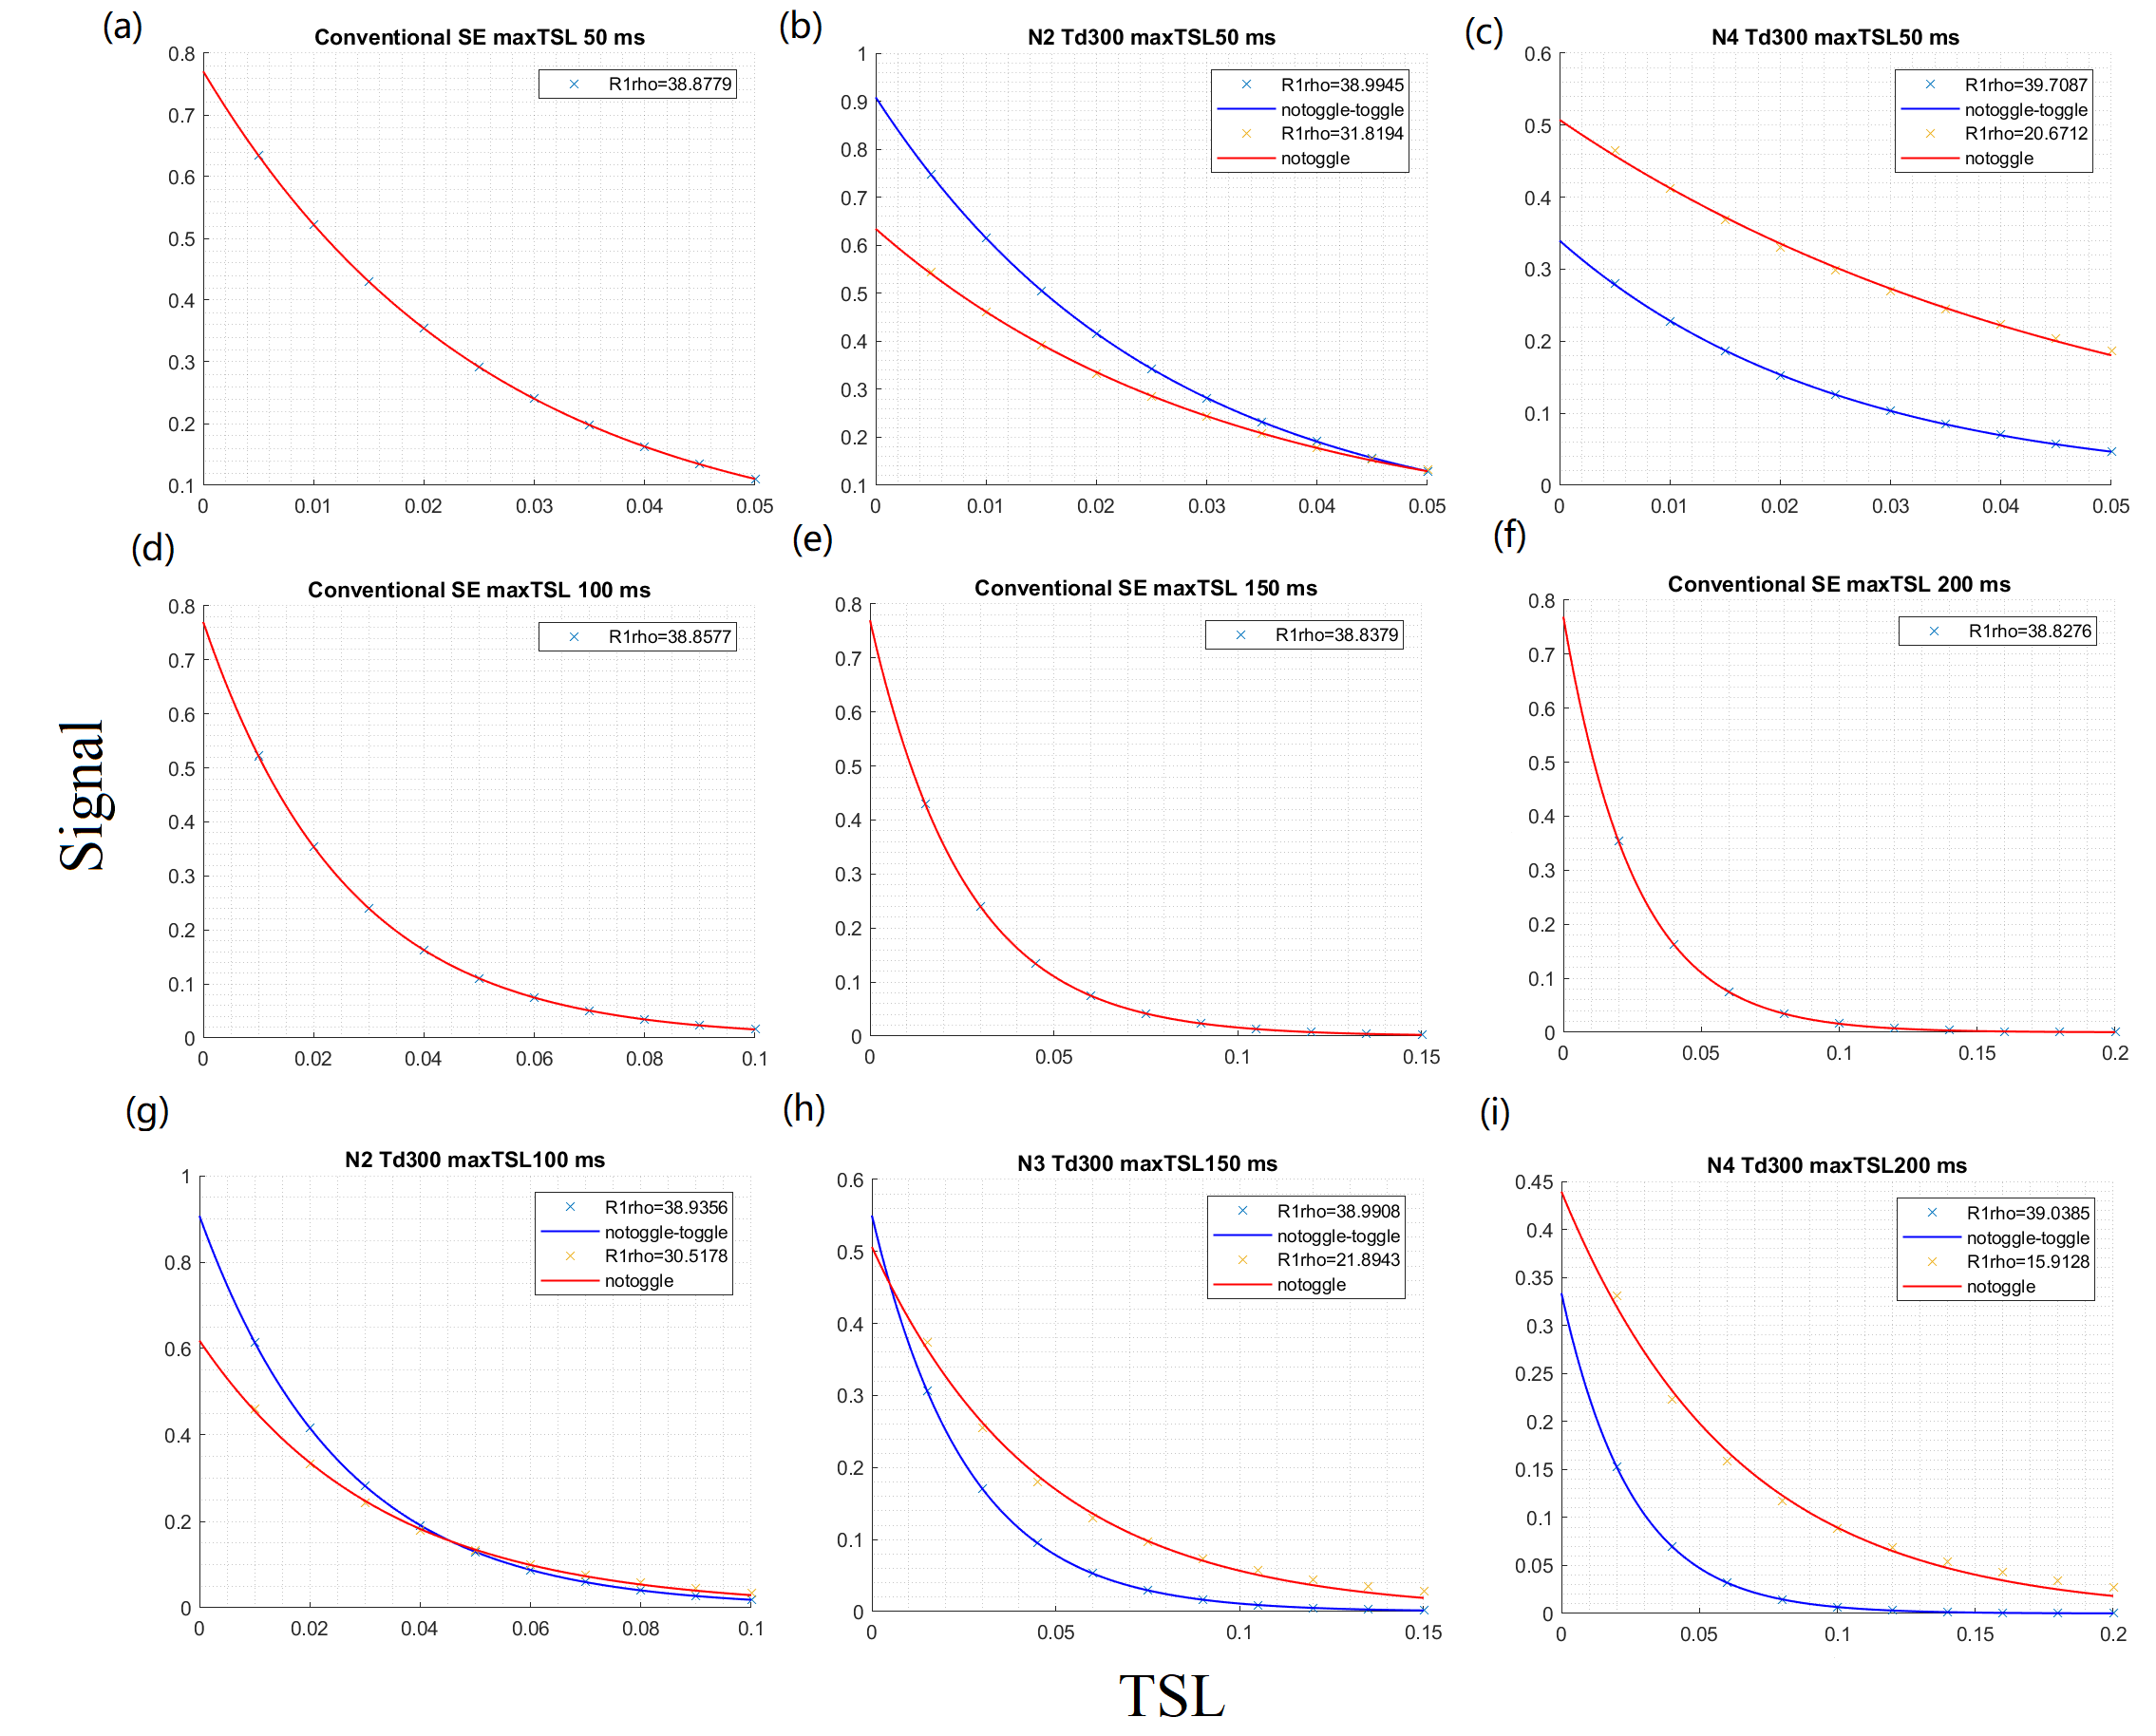
Figure2.Results of three pool Bloch-McConnell simulations. Cartilage parameters were used for simulation study12,13:$$$T_{1}/ T_{2}(1168ms/27ms), T_{1}^{mt}=T_{1}=T_{1}^{cest},T_{2}^{mt}=8.3\mu s,$$$$$$T_{2}^{cest}=T_{2}, K_{mt}=57,K_{cest}=2000, \triangle \omega^{cest}=1ppm.$$$a-c shows conventional non-pulsed spinlock and pulsed spinlock with max TSL 50ms, d-f and g-i show both methods with max TSL 100, 150 and 200ms respectively. The red curves use data of notoggle and the blue curves use data of notoggle-toggle. R1rho value was marked on the legend.