4086
Experimental validation of simulated SNR loss due to noise coupling1Philips Research Hamburg, Philips GmbH Innovative Technologies, Hamburg, Germany
Synopsis
Keywords: RF Arrays & Systems, Simulations, SNR, Noise Coupling
Motivation: The aim of our study was to analyze the SNR loss due to noise coupling during reception with MRI coil arrays.
Goal(s): In particular, we wanted to experimentally confirm the existing calculation methods.
Approach: We compared the simulation predicted SNR loss due receiver noise against measurements for a single as well as for three coil elements.
Results: A nice agreement was shown between theory and experiment.
Impact: With our study, we also show how decisively noise coupling affects the SNR of an array.
BACKGROUND
For a single receive element, the Signal to Noise Ratio (SNR) reduction of the receiver is given by the cascaded noise figure of all the relevant components, i.e., matching network, Low Noise Preamplifier (LNA), and Analog to Digital Conversion (ADC). In an array configuration, however, coupling between the single elements also causes the noise from the receivers to couple between the channels1, and the SNR is further decreased, by the so-called Array Noise Figure (ANF) or Effective Noise Figure2. The array SNR can be nicely calculated from simulations by closed form expressions3,4. The global noise coupling induced SNR loss can just be avoided by decoupling before the preamplifiers. For a target region, Array Noise Matching (ANM) may retrieve the SNR lost by coupling3,4,5, while the commonly used preamplifier decoupling only helps to separate profiles6,7,8.In this study we artificially increased the receiver noise figure for a single element as well as for three coupled elements. As predicted by simulations, we saw significantly more impact in the array configuration.
METHODS
We prepared three 11cm coil loops (Fig. 1) for a 1.5T Philips Ingenia system. These were placed on a loading phantom, characterized9,10 by 0.52 S/m conductivity and 57.5 relative permittivity.A state-of-the-art preamplifier was characterized with an Agilent N4973A noise figure analyzer using a 6dB noise source N4000A together with four matching networks. A linear noisy model was derived as depicted on the left in Fig. 2. We then connected the same preamplifier to a receive channel and repeated the same method using the MRI system which results in the cascaded noise model shown on the right.
We measured image SNR by acquiring 500 identical slices and pixel-wise determination of average and standard deviation. To change the receiver performance, we placed an attenuator as well as a second preamplifier in-between the first LNA and the digitizer (Fig. 3). The second LNA gain was used to ensure that even with attenuation the discretization noise is kept small, thus, we always may assume a linear behavior. The attenuators were chosen by 20dB, 23dB or 26dB.
The same setup was simulated with CONCEPT-II11 together with some Python code to calculate the power sensitivities and scattering coefficients. With these, we used either a self-written Co-simulator including noise propagation or the closed form SNR-equation3 (Equation 1), resulting both in the exact same SNR distribution for a fully reconstructed image, i.e., using the noise covariance14,15. Finally we calculated the SNR-loss due to changing the receiver for the single channel and for the three element array for both, simulation and experiment.
RESULTS
For the single element, the simulation predicted a homogeneous SNR drop of 5.6%, 10.9% and 19.2% when using 20, 23 or 26dB attenuators. The measurement confirmed this very nicely with measured performance loss of 6.2%, 10.4% and 18.0%. For the Array configuration, however, an inhomogeneous SNR-drop is predicted from the simulation with maximum values below the elements (Fig. 4). Evaluating the results 4cm inside the phantom below the center element the simulation predicts 10.0% SNR drop for 20dB and 17.5% for 23dB attenuation. The measurement confirmed the inhomogeneous behavior and resulted in 12.4% for 20dB and 18.0% for 23dB.DISCUSSION
For the single element, the SNR drop can be directly explained by the increased cascaded noise figure, e.g., the (measured) SNR drop of 10.4% when using the 23dB attenuation. Using the same attenuation for three elements, however, the noise coupling yields a significantly higher (measured) SNR drop of 18.0% which was nicely predicted by simulations. Since we did not use ANM3,4,5, we got ANF>NF, thus, an array noise figure which is higher than the single channel noise figure. Small deviations between simulation and measurement may be explained by some non-simulated effects like cabling, limited reference scan resolution, averaging, and statistical behavior. The experiment also shows small asymmetries in the SNR maps (Due to the sagittal orientation, LISA13 does not yield asymmetry here.).CONCLUSION
This study nicely confirms the simulation methods which, therefore, should be used in coil development for predicting image quality. In addition, we showed how SNR depends on receiver noise, especially in potentially non-perfectly matched preamplifiers or load variations. The noise figure of just a single channel strongly underestimates the Array Noise Figure, thus, the SNR-loss for the array case.Acknowledgements
We would like to thank Randy Duensing for his support of our work.References
[1] A. Reykowski et al.: Rigid Signal-to-Noise Analysis of Coupled MRI Coils Connected to Noisy Preamplifiers and the Effect of Coil Coupling on Combined SNR, ISMRM 2000, p. 1402
[2] C. Findeklee et al.: Simulating Array SNR and Effective Noise Figure in dependance of Noise Coupling, ISMRM 2011, p. 1883
[3] C. Findeklee: Array Noise Matching via the Scattering Matrix, IEEE AP 2019
[4] C. Findeklee: Array Noise Matching---Generalization, Proof and Analogy to Power Matching, IEEE AP 2011
[5] C. Findeklee: Improving SNR by Generalizing Noise Matching for Array Coils, ISMRM 2009
[6] C. Findeklee et al: Preamp decoupling improves SNR and the earth is flat, ISMRM 2019
[7] R. Duensing et al: Preamplifier Decoupling: Theory & Practice, RF Coils for Fun & Profit Weekend Course of the ISMRM 2021
[8] A. Reykowski: Do We Need Preamplifier Decoupling?, ISMRM 2011
[9] U. Katscher et al: Electric Properties Tomography (EPT) via MRI, ISMRM 2006
[10] J.H. Lee et al: In vivo electrical conductivity measurement of muscle, cartilage, and peripheral nerve around knee joint using MR-electrical properties tomography, nature 2022
[11] https://www.tet.tuhh.de/en/concept-2/
[12] C. Findeklee: ISBN 978-3-8440-1659-8
[13] J. Lange: Noise Characterization of Linear Twoports in Terms of Invariant Parameters, IEEE JSCS 1967
[14] S. P. Appelbaum: Adaptive Arrays, IEEE AP 1976
[15] P. B. Roemer: The NMR Phased Array, MRM, 1990
[16] P. H. Wardenier: Local Intensity Shift Artifact (LISA), SMRM 1989
Figures
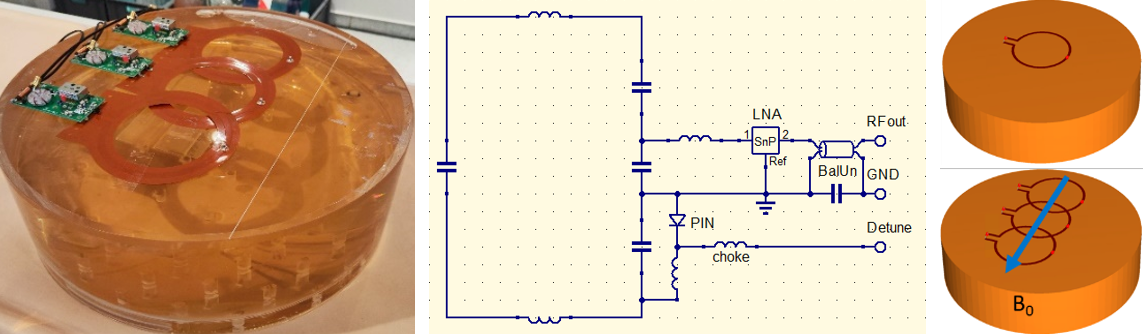
Left: Three coil elements for the experimental setup
Center: Schematics for the coils including a simple detune circuit
Right: 3D field simulation model (CONCEPT)
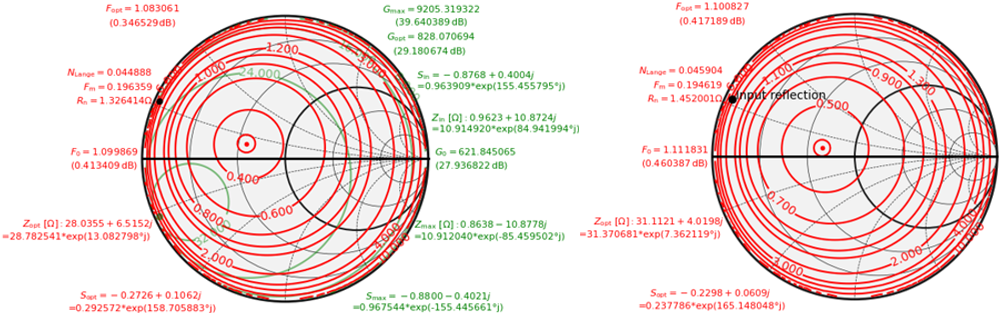
Left: Linear noisy model of the preamplifier, derived from measurements. Red circles correspond to a constant noise figure for given source reflection, green circles show the (available) gain for the same source.
Right: Same preamplifier used in a cascade with a receive channel, noise circles derived from measurements of the noise performance from analog input to digital output
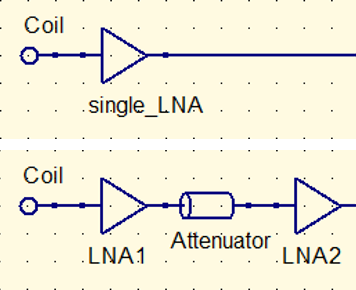
Top: Single LNA, used for the reference measurements
Bottom: Two LNAs with attenuator resulting in a worse SNR performance of the receiver

Equation (1):
Closed form SNR-equation3 with k the Boltzmann
constant, T the absolute
temperature, B the bandwidth, bs the
receive signal wave amplitudes, Fopt the individual optimal noise factors, S the array scattering matrix, Sopt the
SNR-optimal source reflections for the cascaded receivers, NL the
Lange N-values13, ∙H denoting the complex conjugate transpose and
square brackets [∙] denoting diagonal
matrices of individual channel values
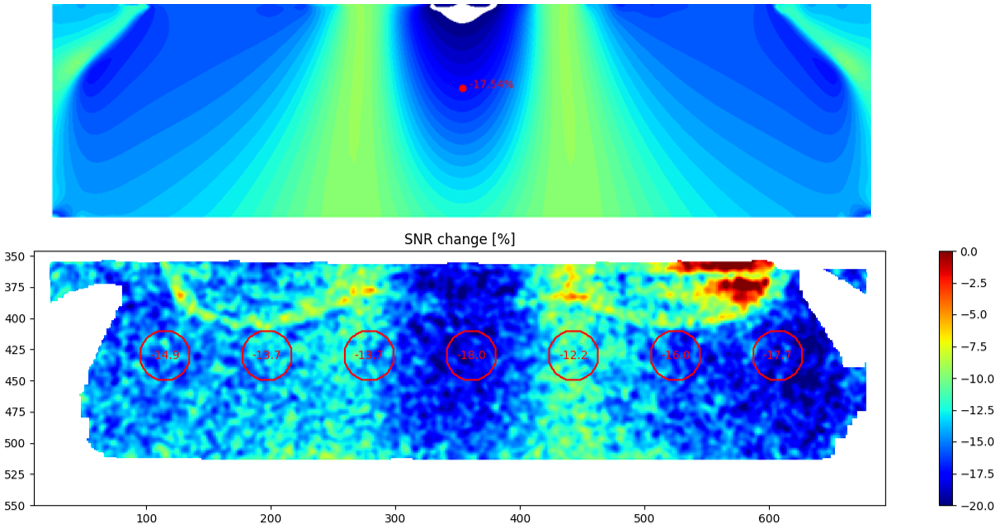
Top: Simulated SNR drop using the 23dB attenuation
Bottom: Measured SNR drop nicely reproducing the simulated behavior.