4071
Assessing cerebrovascular integrity with hypercapnia and a joint CBF and BOLD sequence (M2-PCASL): a comparison of healthy young and old cohorts.1Radiology, Emory University, Atlanta, GA, United States, 2Bioengineering, Georgia Institute of Technology, Atlanta, GA, United States, 3Neurology, Emory University School of Medicine, Atlanta, GA, United States, 4Radiology, Emory University School of Medicine, Atlanta, GA, United States
Synopsis
Keywords: Alzheimer's Disease, Aging, cerebrovascular reactivity, BOLD
Motivation: Cerebrovascular disruptions are associated with Alzheimer’s Dementia and can precede cognitive decline; therefore, studying the progression of cerebrovascular dysfunction in healthy aging versus cognitive decline is a promising opportunity for early therapeutic interventions.
Goal(s): In this study, we aimed to determine if there were differences in cerebrovascular health metrics between young and old healthy cohorts.
Approach: Using a novel MR pulse sequence, we quantified cerebrovascular reactivity (CVR), resting state blood-oxygen level dependent signal (BOLD), and cerebral blood flow (CBF) in both cohorts.
Results: We found an age-dependent decrease in CBF and BOLD CVR.
Impact: Age related changes in cerebrovascular health metrics assessed by quantitative MRI methods can help us characterize differences between healthy aging and cognitive decline thus offering unique opportunities for early therapeutic interventions in neurodegenerative diseases like Alzheimer's dementia.
Introduction
Neurons critically depend on an efficient and dynamic supply of oxygen and glucose, and age-related changes in the cerebrovasculature and hemodynamics negatively impact cognition and play a role in pathology. Age-related variations in the cerbrovasuclature often precede cognitive decline that occurs later in life. Magnetic resonance imaging can assess cerebrovascular health by measuring cerebrovascular reactivity (CVR), blood-oxygen level dependent (BOLD) signal, cerebral perfusion, among others. These methods allow us to better understand how cerebrovascular dysfunction plays a role in aging and cognitive decline. In this preliminary analysis, we sought to understand how BOLD CVR, and cerebral blood flow (CBF) vary with age in healthy subjects using a multiband multi-echo pseudo-continuous ASL (M2-PCASL) sequence coupled with a hypercapnia challenge that simultaneously measures CBF and BOLD signals [1]. Taking these complementary metrics together may provide greater insight to the dynamics of healthy aging and the role that cerebrovascular health plays in cognitive decline [2,3].Methods
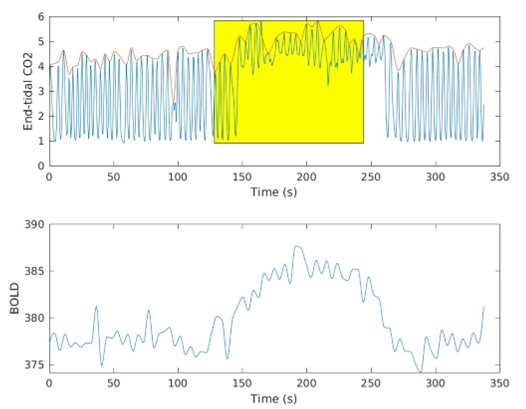
Healthy subjects were recruited to undergo a CO2 hypercapnic gas challenge during a novel dual echo pseudo-continuous arterial spin labeling (ASL) sequence that can quantify BOLD signal and absolute CBF in units of mL/100g/min, and thereby cerebrovascular reactivity. The scan was performed on a 3T Siemens Magnetom Prisma and included a T1w sequence and M2-PCASL (TE = 14, 28 ms, TR = 4.064 s, flip angle = 90º, multi-band factor = 2, FOV=224 , matrix size = 64x64) sequence. The gas challenge paradigm consisted of several 2-minute blocks each of room air (21% oxygen), 5% CO2 and 21% oxygen, and 100% oxygen gas inhalation. Subjects were divided into young (28.2 ± 4.7 years, n=26) and old (65.6 ± 6.4 years, n=269) groups. Baseline CBF, resting state BOLD signal, and BOLD CVR were calculated in the whole brain and in some regions of interest. Statistical differences between the groups were determined by an independent samples t-test. General linear models (GLM) were constructed to determine the effects of age on the metric of interest. All analyses were implemented in the Python 3 Scipy and Statsmodels libraries. Prior to conducting the analyses, the images were processed using a pipeline developed in house that performs standard ASL processing steps as well as CBF and CVR calculations [4, 5].Results
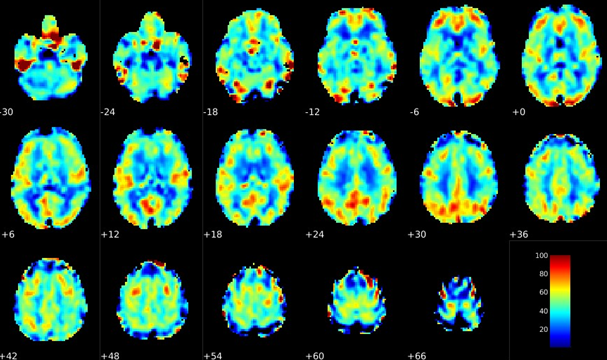
Baseline CBFFirst, baseline CBF was calculated in both groups. The group of younger subjects was found to have an average whole brain CBF of 40.5 ± 9.9 mL/100g/min while the group of older subjects was found to have an average CBF of 33.5 ± 9.9 mL/100g/min (p = 0.0006). This finding is consistent with what is reported in the literature. Additionally, a GLM was created with age and gender as predictor variables. Male gender was found to be a stronger predictor of baseline CBF (β = -6.5) than age (β = -0.17/year), but both predictors were statistically significant (p = 2.6E-07 and p = 1.6E-04 respectively).
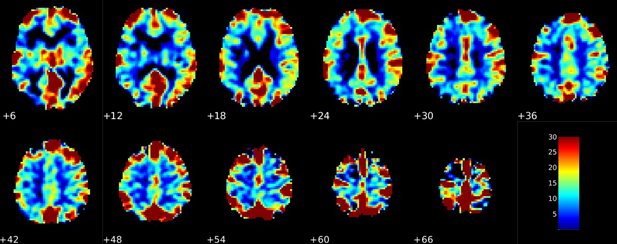
BOLD CVR
Significant differences in BOLD CVR were also found between the two groups with the younger group having an average value of 0.26 ± 0.12 and the older group having an average value of 0.19 ± 0.10 in units of % signal change/mmHg end-tidal CO2 (p = 0.0006). This result is consistent with many reports, but there is a general lack of consensus about the effects of age on BOLD CVR from previous reports [6]. Some reports claim gender differences may play a role in CVR alterations during aging [7]. To explore this, GLMs were created for both sexes together and each sex independently. When both sexes were considered, age had a significant negative correlation with CVR (β = -0.1 , p = 0.034), but when each sex was considered separately, age no longer had a significant correlation with CVR, potentially due to sampler sample size in the younger group. Finally, females were found to have a higher CVR in the whole brain and grey matter compared with males (p < 0.05).
Conclusion
This preliminary analysis sought to establish whether changes in cerebrovascular health metrics can be seen between young and old subjects. Indeed, as previously reported in various studies, we see decreased CBF and decreased BOLD CVR in the older subject group [8]. The cerebrovasculature undergoes many changes during healthy aging, some of which induce vasodilation, while others induce vasoconstriction, and others disrupt signaling over space. M2-PCASL allows the measurement of multiple parameters simultaneously and can be a useful tool for further studies to better understand the mechanisms by which these metrics vary with age and how they vary with cognitive changes [3].Acknowledgements
No acknowledgement found.References
[1] Chen, Shiyang, et al. 2017. ISMRM 25th Annual Meeting and Exhibition. Honolulu, HI, USA, p0356
[2] Kim, Donghoon, et al. “Relationship Between Cerebrovascular Reactivity and Cognition Among People With Risk of Cognitive Decline.” Frontiers in Physiology, vol. 12, 2021.
[3] Zimmerman, Benjamin, et al. “Age-Related Changes in Cerebrovascular Health and Their Effects on Neural Function and Cognition: A Comprehensive Review.” Psychophysiology, vol. 58, no. 7, 2021, p. e13796. Wiley Online Library, https://doi.org/10.1111/psyp.13796.
[4] Alsop, David C., et al. “Recommended Implementation of Arterial Spin Labeled Perfusion MRI for Clinical Applications: A Consensus of the ISMRM Perfusion Study Group and the European Consortium for ASL in Dementia.” Magnetic Resonance in Medicine, vol. 73, no. 1, Jan. 2015, pp. 102–16. PubMed Central, https://doi.org/10.1002/mrm.25197.
[5] Liu, Peiying, et al. “Cerebrovascular Reactivity (CVR) MRI with CO2 Challenge: A Technical Review.” NeuroImage, vol. 187, Feb. 2019, pp. 104–15. PubMed Central, https://doi.org/10.1016/j.neuroimage.2018.03.047.
[6] Hoiland, Ryan L., et al. “Regulation of the Cerebral Circulation by Arterial Carbon Dioxide.” Comprehensive Physiology, John Wiley & Sons, Ltd, 2019, pp. 1101–54. Wiley Online Library, https://doi.org/10.1002/cphy.c180021.
[7] Kastrup, Andreas, et al. “Changes of Cerebrovascular CO 2 Reactivity During Normal Aging.” Stroke, vol. 29, no. 7, July 1998, pp. 1311–14. DOI.org (Crossref), https://doi.org/10.1161/01.STR.29.7.1311.
[8] D’Esposito, Mark, et al. “Alterations in the BOLD FMRI Signal with Ageing and Disease: A Challenge for Neuroimaging.” Nature Reviews Neuroscience, vol. 4, no. 11, Nov. 2003, pp. 863–72. DOI.org (Crossref), https://doi.org/10.1038/nrn1246.
Figures