4069
Multimodal Approach using MR and 18F-FDG-PET imaging in antemortem diagnosis of early stage TDP-43 Proteinopathy1Mayo Clinic, Rochester, MN, United States, 2Mayo Clinic, Jacksonville, FL, United States
Synopsis
Keywords: Dementia, Alzheimer's Disease, Aging, TAR DNA-binding protein 43, TDP-43, Neurodegeneration, PET, MRI
Motivation: TDP-43, a 43kDa protein in the brain, plays a crucial role in neurodegenerative disorders and is a potential target for clinical trials. Confirmation currently requires an autopsy.
Goal(s): To explore potential antemortem biomarkers for early-stage TDP-43 detection using conventional MRI and 18F-FDG-PET scans.
Approach: Blinded visual evaluations of MRI and 18F-FDG-PET scans were performed utilizing specialized rating scales.
Results: TDP-43(+) cases exhibited more medial temporal atrophy on MRI, though influenced by age. Visual inspection of MRI and 18F-FDG-PET changes could aid early TDP-43 prediction, although further research employing advanced neuroimaging and statistical techniques is essential to identify more robust early-stage TDP-43 neuroimaging biomarkers.
Impact: Predicting TDP-43 status holds substantial diagnostic and clinical significance. TDP-43 could emerge as a promising therapy target in neurodegenerative disorders and a critical consideration in clinical trials. Early-stage TDP-43 prediction offers valuable insights into disease prognosis and progression.
Introduction
The accumulation of the 43kDa trans-active Response DNA-binding Protein (TDP-43) in the brain is a key factor in the development of various neurodegenerative disorders. Among these, Alzheimer's disease (AD) is closely associated with the presence of TDP-431-4, leading to more pronounced memory and cognitive function decline5-7. TDP-43 in AD also results in more extensive brain atrophy and more severe disease progression8 and hence can affect clinical trials and other AD-related outcomes, emphasizing the importance of TDP-43 presence prediction in AD. Currently, confirming the presence of TDP-43 in the brain relies on autopsy. Various research groups have explored the utility of MRI for identifying TDP-43 in living individuals5,9-15, and 18F-FDG-PET has been used to predict TDP-43 status by analyzing hypometabolism in specific brain regions16. However, previous studies16 included patients with all Braak neurofibrillary tangle (NFT) stages, which might have enhanced local signature patterns of atrophy on MRI and hypometabolism on 18F-FDG-PET, due to the co-existence of tau neurodegenerative pathology, which is strongly associated with atrophy and hypometabolism. In this study, we focused on patients with low Braak NFT stages (0-III) to reduce the effect of AD tau pathology. We used visual clinical assessment scales to analyze MRI and 18F-FDG-PET scans, aiming to identify structural and metabolic differences between TDP-43(+) and TDP-43(-) cases. Our objective was to assess the potential of these clinical visual reads to diagnose TDP-43 before death.Methods
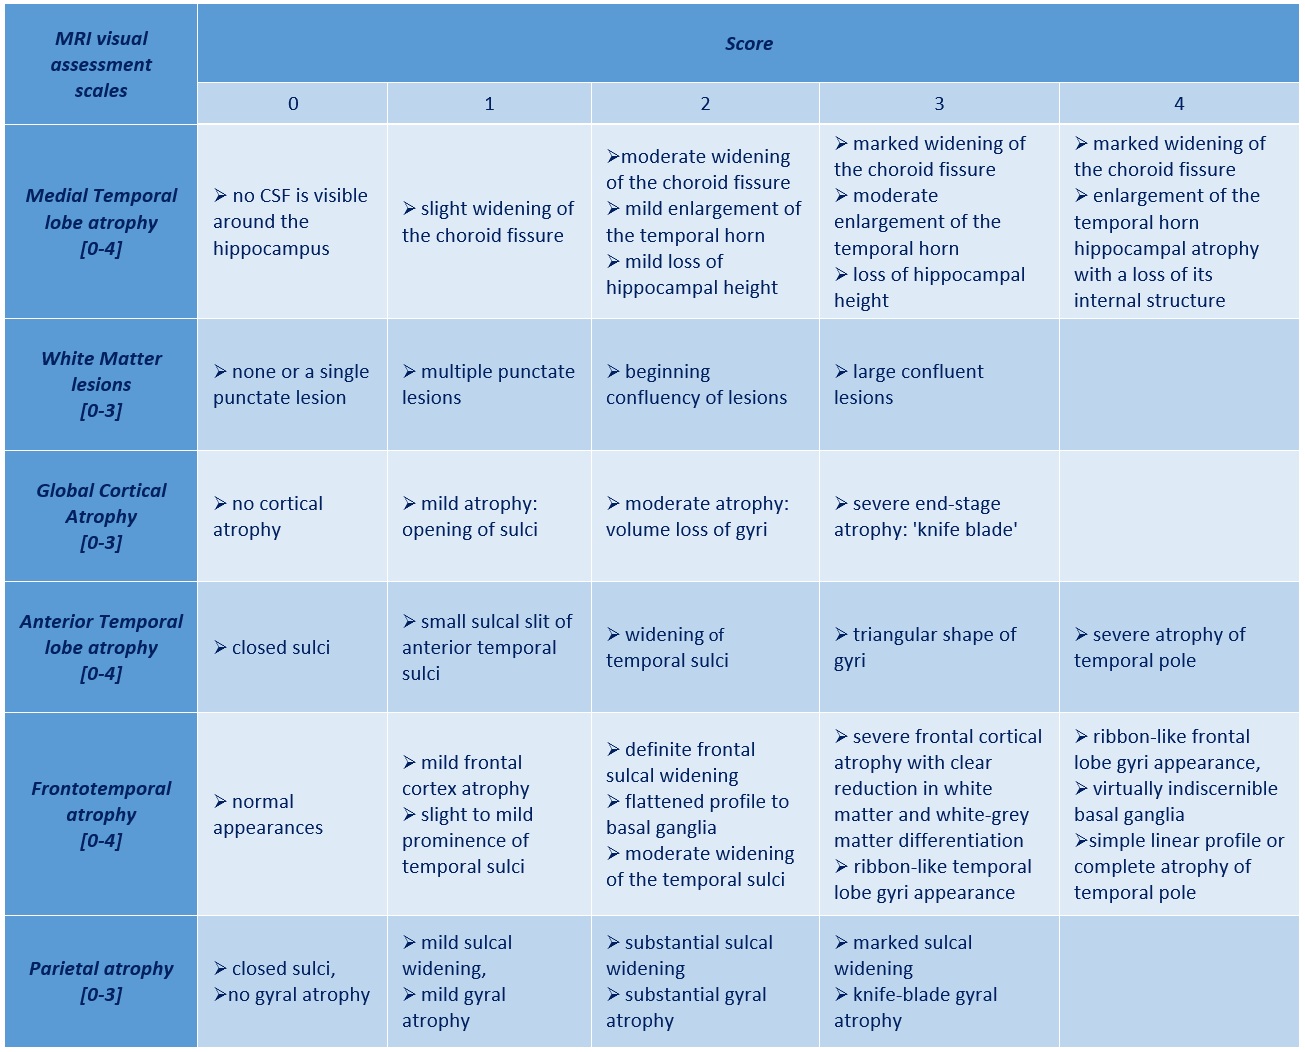
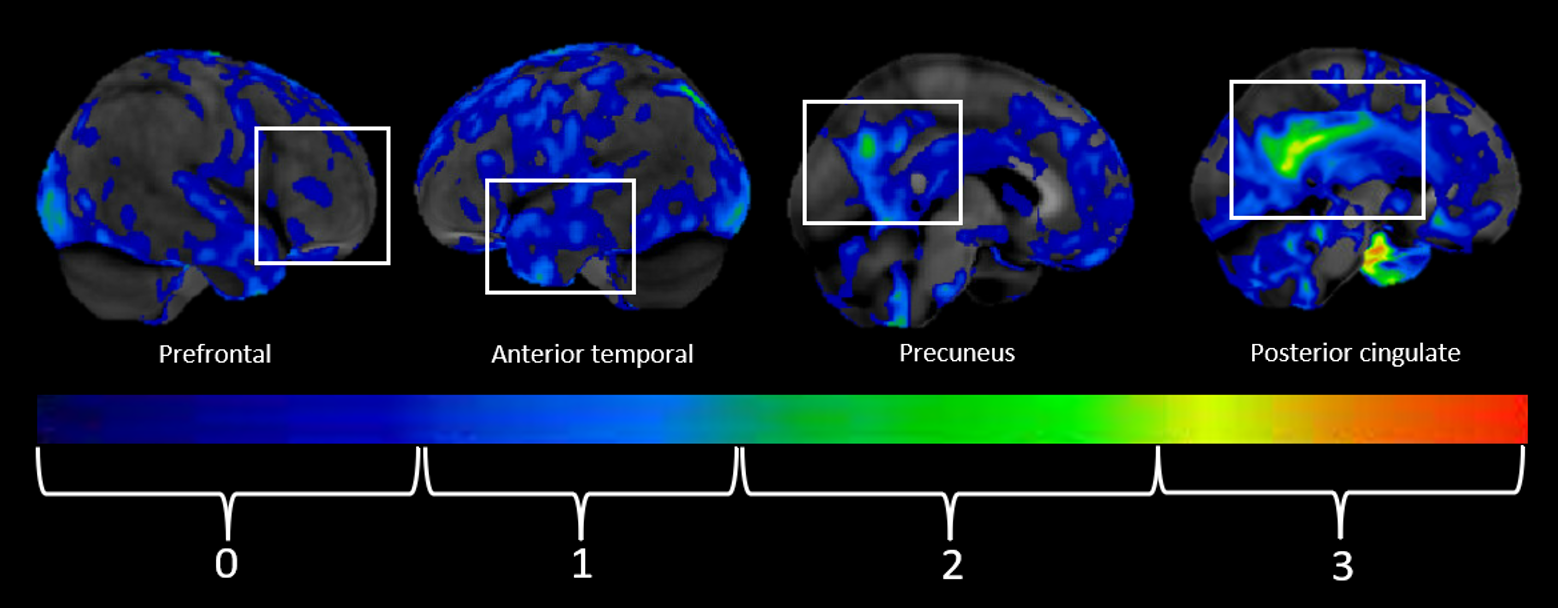
We identified 64 individuals who were followed during life with both MRI and 18F-FDG-PET scans who had died with a Braak stage of III or less at autopsy. Cases with frontotemporal lobar degeneration or diffuse Lewy body disease were excluded. Visual assessment scales (Figures 1 and 2) were employed to grade structural (MRI) and metabolic (18F-FDG-PET) changes in various brain regions. Visual reads of 18F-FDG-PET were performed using CortexID images that display metabolism as Z scores compared to age-matched controls. Demographic, pathological characteristics and clinical assessment scale ratings were compared between TDP-43(+) and TDP-43(-) cases using Chi-squared and Kruskal-Walli’s rank sum tests. Independent logistic regression analyses were used to determine whether any feature or diagnostic modalities could predict antemortem TDP-43 status, adjusting for potential confounders, with significance set at p≤0.05.Results
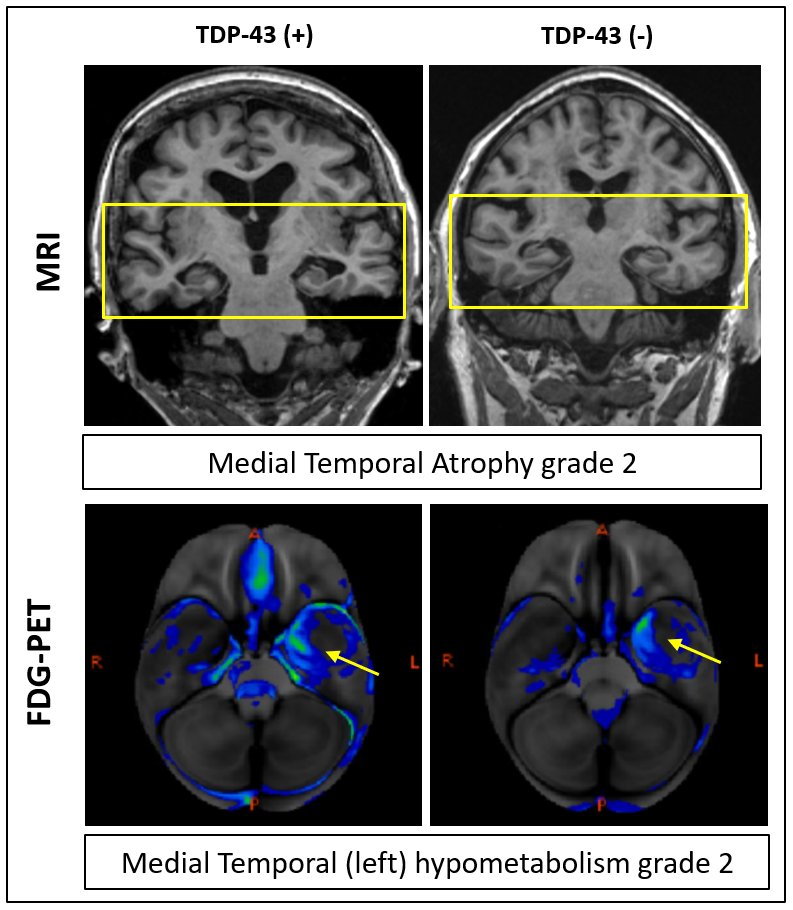
Out of 64 autopsy cases, 20 (31%) were TDP-43(+), with 12/20 (60%) being female. TDP-43(+) cases were older than TDP-43(-) cases (89 [86, 92] years vs. 85 [77, 92] years; p=0.083). The presence of Medial Temporal atrophy with a grade of ≥2 was significantly more common in TDP-43(+) cases (p=0.043). Logistic regression analysis accounting for age and sex found trends for differences for MRI and 18F-FDG-PET variables, including Medial Temporal atrophy (p=0.096), Parietal atrophy (p=0.059) on MRI, and reduced metabolism in the Medial Temporal region (p=0.089) on 18F-FDG-PET. Exemplary MRI and 18F-FDG-PET images in TDP-43(+) and TDP-43(-) cases are shown in Figure 3.Discussion
In this cohort, the early deposition of TDP-43 Proteinopathy was linked to visible atrophy in the medial temporal region on MRI. However, some of this association appeared to have been driven by older age. Patients with older age can have a more significant burden of age-related pathologies that may be playing a role. Previous studies have reported robust MRI and 18F-FDG-PET markers as indicators of TDP-43 presence; however, those studies included patients with more advanced stages of neurofibrillary tangle pathology and AD neuropathologic changes as well as patients with more advanced TDP-43 stages and hippocampal sclerosis. These differences likely explain the different levels in robustness of outcomes between this and other studies.Conclusion
Visual inspection of MRI and 18F-FDG-PET markers may be helpful in predicting early-stage TDP-43 status when mild AD pathology is present. Future studies using more advanced neuroimaging techniques and statistical tools are needed to identify more robust antemortem neuroimage biomarkers of TDP-43 in its initial stage.Acknowledgements
Study funded by NIH grants R01 AG37491-10, P50AG16574, and U01 AG006786.References
1. Josephs, K.A., et al., TAR DNA‐binding protein 43 and pathological subtype of Alzheimer's disease impact clinical features. Annals of neurology, 2015. 78(5): p. 697-709.
2. James, B.D., et al., TDP-43 stage, mixed pathologies, and clinical Alzheimer’s-type dementia. Brain, 2016. 139(11): p. 2983-2993.
3. McAleese, K.E., et al., TDP‐43 pathology in Alzheimer's disease, dementia with Lewy bodies and ageing. Brain pathology, 2017. 27(4): p. 472-479.
4. Davidson, Y.S., et al., TDP-43 pathological changes in early onset familial and sporadic Alzheimer’s disease, late onset Alzheimer’s disease and Down’s syndrome: association with age, hippocampal sclerosis and clinical phenotype. Acta neuropathologica, 2011. 122(6): p. 703-713.
5. Josephs, K.A., et al., Abnormal TDP-43 immunoreactivity in AD modifies clinicopathologic and radiologic phenotype. Neurology, 2008. 70(19 Part 2): p. 1850-1857.
6. Boyle, P.A., et al., Varied effects of age-related neuropathologies on the trajectory of late life cognitive decline. Brain, 2017. 140(3): p. 804-812.
7. Wilson, R.S., et al., TDP-43 pathology, cognitive decline, and dementia in old age. JAMA neurology, 2013. 70(11): p. 1418-1424.
8. Acewicz, A., et al., Incidence and morphology of secondary TDP-43 proteinopathies: Part 2. Folia Neuropathol, 2023. 61(2): p. 111-120.
9. Josephs, K.A., et al., Rates of hippocampal atrophy and presence of post-mortem TDP-43 in patients with Alzheimer's disease: a longitudinal retrospective study. Lancet Neurology, 2017. 16(11): p. 917-924.
10. Josephs, K.A., et al., TDP-43 is a key player in the clinical features associated with Alzheimer’s disease. Acta neuropathologica, 2014. 127(6): p. 811-824. Josephs, K.A., et al., Staging TDP-43 pathology in Alzheimer’s disease. Acta neuropathologica, 2014. 127(3): p. 441-450.
11. Josephs, K.A., et al., Staging TDP-43 pathology in Alzheimer’s disease. Acta neuropathologica, 2014. 127(3): p. 441-450.
12. Amador‐Ortiz, C. and D.W. Dickson, Neuropathology of hippocampal sclerosis. Handbook of clinical neurology, 2008. 89: p. 569-572.
13. Amador‐Ortiz, C., et al., TDP‐43 immunoreactivity in hippocampal sclerosis and Alzheimer's disease. Annals of neurology, 2007. 61(5): p. 435-445.
14. Nag, S., et al., Hippocampal sclerosis and TDP‐43 pathology in aging and Alzheimer disease. Annals of neurology, 2015. 77(6): p. 942-952.
15. Nelson, P.T., et al., Hippocampal sclerosis in advanced age: clinical and pathological features. Brain, 2011. 134(5): p. 1506-1518.
16. Buciuc, M., et al., Utility of FDG-PET in diagnosis of Alzheimer-related TDP-43 proteinopathy. Neurology, 2020. 95(1): p. e23-e34.
Figures