4068
Correlations between regional brain cortical volumes and categorical verbal fluency test1Radiology, Kyoto Prefectural University of Medicine, Kyoto, Japan, 2Social Health Medicine, Shizuoka Graduate University of Public Health, Shizuoka, Japan, 3Epidemiology for Community Health and Medicine, Kyoto Prefectural University of Medicine, Kyoto, Japan, 4Medical Research Institute, Kyoto Industrial Health Association, Kyoto, Japan, 5Neurology, Kyoto Prefectural University of Medicine, Kyoto, Japan
Synopsis
Keywords: Dementia, Neuroscience, volumetry analysis, verbal fluency test
Motivation: To investigate whether there are correlations between regional brain volume and the categorical verbal fluency test (CFT).
Goal(s): While the relationship between CFT and the region of cerebral infarction or brain function has been investigated, it remains uncertain whether they also correlate with local brain volume.
Approach: We used a multiple regression analysis with age, gender, and total brain volume as covariates to examine the relationship between 267 community residents' cortical volume and CFT scores. A 3D high-resolution brain MRI captured the images.
Results: The volume of the left inferior frontal gyrus had a significant correlation with the CFT.
Impact: This result suggests a potential association between brain volume and various neuropsychological impairments. Furthermore, it motivates the exploration of a novel time-based examination of the manifestation of changes in brain metabolism, function, and volume in the context of neuropsychological alterations.
INTRODUCTION
The volume of various brain regions can now be accurately measured using brain MRI, and many studies have been conducted to reveal correlations between these measurement values and various clinical information1-3. The number of papers investigating the correlation with brain volume is gradually increasing.Cognitive function is one of the most important functions of the brain. By elucidating the correlationship between each regional brain volume and cognitive function, we can understand the characteristics of a healthy brain and the integrity of cognitive functions. Among these cognitive functions, the verbal fluency test (VFT) is commonly used in neuropsychological assessments. This is because it is relatively simple to use and does not require any testing equipment. Recent advances in functional neuroimaging techniques have revealed the location of brain activity during tasks4-6, and its relationship to cognitive function has been investigated.
In this study, we conducted exploratory analyses to examine its correlations with regional cortical volumes.
METHODS
Participants were prospectively recruited through random mailings from Kyoto, Japan. These individuals consented to undergo a brain MRI as a medical check-up for arteriosclerosis. The brain MR imaging was performed on 267 community-dwelling middle-aged and elderly people ranging from 54.8 to 89.3 (mean, 70.1 years, 89 females) on a 1.5T MR scanner (Philips). All participants underwent 3D T1-weighted imaging, and the volumetric analysis was performed using MVision (Corpotate M, Tokyo) (Fig.1). The categorical verbal fluency test (CFT), which is a type of VFT, was performed. Test subjects were required to generate words that belong to specific categories, such as animals and vegetables. We counted the total number as the CFT score. Volumetric analysis of the cerebral cortex in 22 regions on both hemispheres was performed. The correlations between the regional brain volume of cortical regions and the CFT scores were assessed. Multiple linear regression analyses were adjusted for sex, age, considering up to how many years and months, and the total brain volume. A p-value of 0.05, corrected for multiple comparisons (Bonferroni), was used.RESULTS
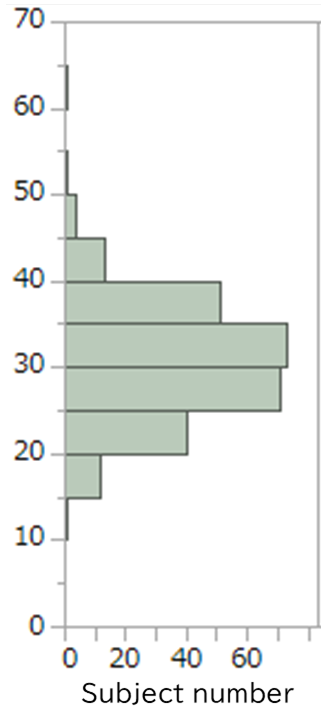
The total scores of the CFT ranged from 14 to 62 (mean, 30.2 ± 6.8) (Fig.2). The left inferior frontal gyrus (IFG_L) was the only cortex that had a statistically significant correlation with the CFT score (p = 0.002, β= 0.329) (Fig.3, 4).DISCUSSION
The IFG_L is a key region for language comprehension and production7, and it includes Broca’s area. There were studies in the past that examined the correlation between regional brain structures and the CFT using various methods. Biesbroek et al. focused on the region of cerebral infarction and found a correlation with the IFG8. Meta-analysis using functional MRI and PET also showed that IFG_L had a significant correlation9. Those findings are consistent with our findings.On the other hand, the two papers did not find a correlation when focusing on gray matter volume10, 11. Pace B et al. analyzed 70 adults10, which is a relatively small number of cases. The total scores for the three categories were 14.5 in the study by Pace et al10. and 37.7 in the study by Li et al11. In our investigation, the total scores for two categories were 30.2. The relatively lower values in the two previous reports compared to our CFT results may be a potential cause for the discrepancy between those two reports and our findings.
Regarding the limitations, first, the number of cases was limited. Second, no information on the dominant hand was provided. Third, we have not corrected for a total intracranial volume. Finally, the presence of other covariates is possible.
CONCLUSION
The CFT had a significant correlation with the IFG_L, which was congruent with the already-known fact in terms of functionality.Future research is needed to determine whether cognitive impairment is preceded by a decline in localized brain metabolism, a reduction in brain volume, or if these changes occur concurrently. Through this approach, the volume of the IFG_L could serve as an objective biomarker for language assessment and cognitive function.
Acknowledgements
No acknowledgement found.References
1. Hofman A, Rodriguez-Ayllon M, Vernooij MW, et al. Physical activity levels and brain structure in middle-aged and older adults: a bidirectional longitudinal population-based study. Neurobiol Aging 2023;121:28-37.
2. van der Velpen IF, Melis RJF, Perry M, Vernooij-Dassen MJF, Ikram MA, Vernooij MW. Social Health Is Associated With Structural Brain Changes in Older Adults: The Rotterdam Study. Biol Psychiatry Cogn Neurosci Neuroimaging 2022;7:659-668.
3. Drouka A, Mamalaki E, Karavasilis E, Scarmeas N, Yannakoulia M. Dietary and Nutrient Patterns and Brain MRI Biomarkers in Dementia-Free Adults. Nutrients 2022;14.
4. Weiss EM, Siedentopf C, Hofer A, et al. Brain activation pattern during a verbal fluency test in healthy male and female volunteers: a functional magnetic resonance imaging study. Neurosci Lett 2003;352:191-194.
5. Miro-Padilla A, Bueicheku E, Ventura-Campos N, Palomar-Garcia MA, Avila C. Functional connectivity in resting state as a phonemic fluency ability measure. Neuropsychologia 2017;97:98-103. 6. Nair N, Hegarty JP, 2nd, Ferguson BJ, et al. Effects of stress on functional connectivity during verbal processing. Brain Imaging Behav 2020;14:2708-2723.
7. Ishkhanyan B, Michel Lange V, Boye K, et al. Anterior and Posterior Left Inferior Frontal Gyrus Contribute to the Implementation of Grammatical Determiners During Language Production. Front Psychol 2020;11:685.
8. Biesbroek JM, van Zandvoort MJ, Kappelle LJ, Velthuis BK, Biessels GJ, Postma A. Shared and distinct anatomical correlates of semantic and phonemic fluency revealed by lesion-symptom mapping in patients with ischemic stroke. Brain Struct Funct 2016;221:2123-2134.
9. Wagner S, Sebastian A, Lieb K, Tuscher O, Tadic A. A coordinate-based ALE functional MRI meta-analysis of brain activation during verbal fluency tasks in healthy control subjects. BMC Neurosci 2014;15:19.
10. Pace B, Holtzer R, Wagshul ME. Gray matter volume and within-task verbal fluency performance among older adults. Brain Cogn 2023;166:105960.
11. Li WX, Yuan J, Han F, et al. White matter and gray matter changes related to cognition in community populations. Front Aging Neurosci 2023;15:1065245.
Figures
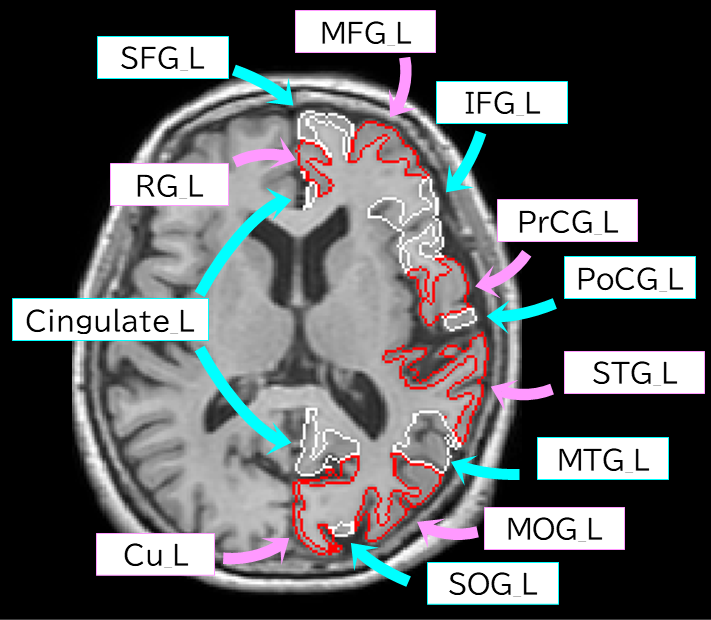
Parcellation maps of brain cortical regions
Cingulate; cingulate gyrus, Cu; cuneus gyrus, IFG; inferior frontal gyrus, *_L; left, MFG; middle frontal gyrus, MOG, middle occipital gyrus, MTG; middle temporal gyrus, PoCG; postcentral gyrus, PrCG; precentral gyrus, *_R; right, RG; gyrus rectus, SFG; superior frontal gyrus, SOG; superior occipital gyrus, STG; superior temporal gyrus
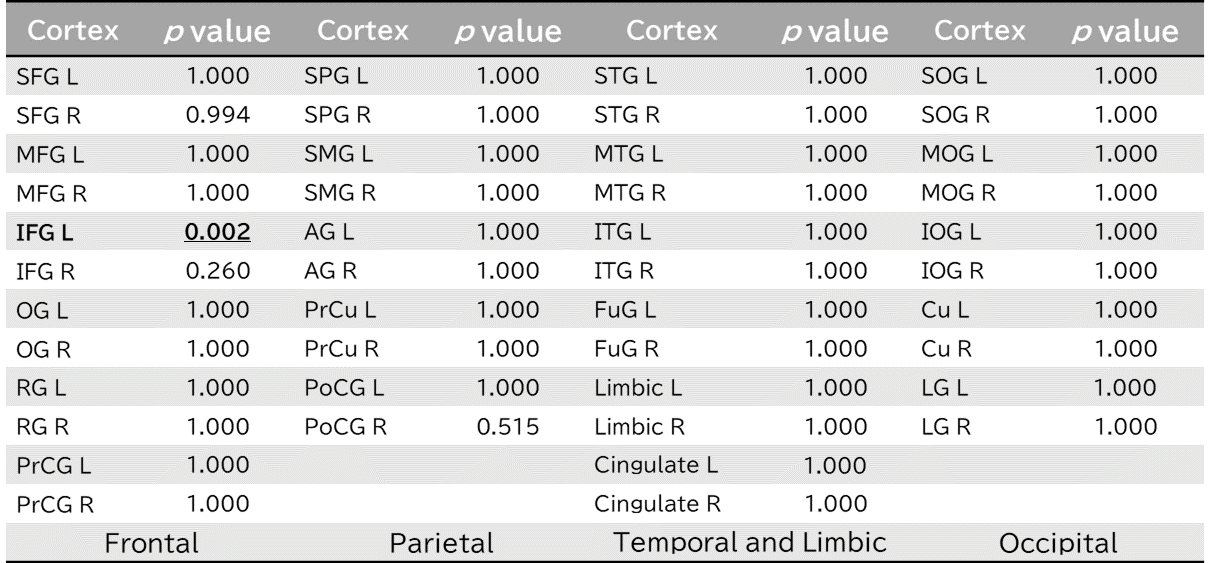
Cortices examined and p values
AG; angular gyrus, Cingulate; cingulate gyrus, Cu; cuneus, FuG; fusiform gyrus, IFG; inferior frontal gyrus, IOG; inferior occipital gyrus, ITG; inferior temporal gyrus, *_L; left, LG; lingual gyrus, MFG; middle frontal gyrus, MOG; middle occipital gyrus, MTG; middle temporal gyrus, OG; orbital gyrus, PoCG; postcentral gyrus, PrCG; precentral gyrus, PrCu; precuneus, *_R; right, RG; gyrus rectus, SFG; superior frontal gyrus, SMG; supramarginal gyrus, SOG; superior occipital gyrus, SPG; superior parietal gyrus, STG; superior temporal gyrus
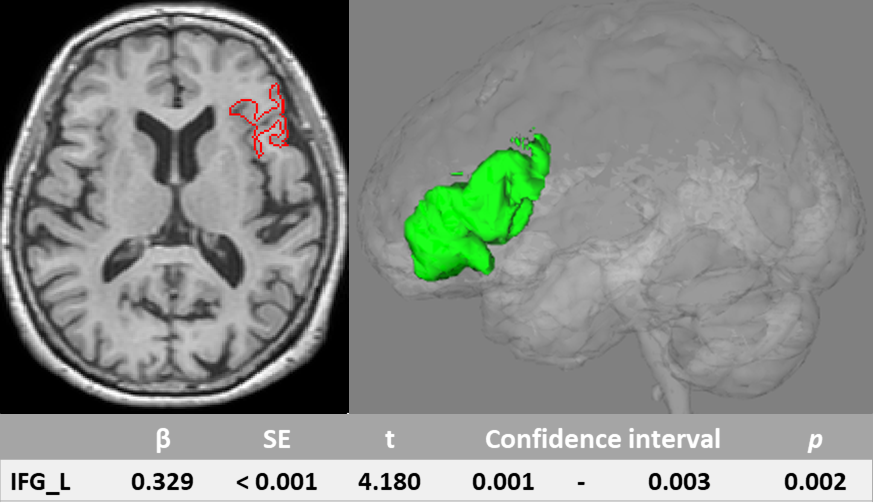
The parcellation map of the left inferior frontal gyrus (IFG_L)
β: standardized partial regression coefficient, SE: standard error