4063
Revealing abnormal brain motion in patients with neurodegenerative diseases using 3D quantitative-amplified MRI - A preliminary study1Electrical Engineering, Stanford, Stanford, CA, United States, 2Neurology & Neurological Sciences, Stanford, Stanford, CA, United States, 3Mātai Medical Research Institute, Tairāwhiti-Gisborne, New Zealand, 4Phoenix Children's Hospital, Phoenix, AZ, United States, 5Radiology, Stanford, Stanford, CA, United States, 6Faculty of Medical & Health Sciences & Centre for Brain Research, University of Auckland, Auckland, New Zealand
Synopsis
Keywords: Dementia, Neurodegeneration, 3D amplified MRI (aMRI), Neurofluids
Motivation: 3D q-aMRI is a method for visualizing and quantifying the pulsatile brain sub-voxel displacement field. Here, we explore the potential of pulsatile brain motion as a biomarker for classification of common neurodegenerative diseases
Goal(s): To explore the ability of 3D q-aMRI to detect abnormal brain motion in patients with common neurodegenerative diseases
Approach: The 3D q-aMRI outputs in 15 patients with different neurodegenerative diseases such mild cognitive impairment (MCI) due to Alzheimer's disease (AD), lewy body dementia (LBD), dementia due to AD were evaluated, and compared with healthy controls.
Results: 3D q-aMRI revealed abnormal motion in patients with neurodegenerative diseases.
Impact: 3D quantitative-amplified MRI is a pulsatile brain motion visualization and quantification method. Exploring pulsatile brain motion as a potential biomarker for neurodegenerative diseases classification is of great importance. 3D q-aMRI revealed abnormal pulsatile brain motion in patients with neurodegenerative diseases.
Introduction
Amplified Magnetic Resonance Imaging (aMRI) is a pulsatile brain motion visualization method that delivers ‘videos’ with high contrast and temporal resolution1-5 and shown to be a promising tool in various neurological disorders2-8. Recently, 3D aMRI was extended into 3D quantitative-aMRI (q-aMRI9), allowing sub-voxel displacement quantification. In this study, 3D q-aMRI was applied to patients with different neurodegenerative diseases and healthy control to assess its potential to identify abnormal brain dynamics.Methods
Human subjects: Experiments were conducted under ethical approval from Stanford University. 15 adult volunteers; 6-males 61-77-years (2 with with mild cognitive impairment (MCI) due to Alzheimer's disease (AD), 3 with lewy body dementia (LBD), 1 healthy control) and 9-females 54-85-years (4 with dementia due to AD, 2 with LBD, and 3 healthy control) were scanned.MRI acquisition: A PET/MR scanner (3T SIGNA Premier; GE Healthcare, Milwaukee, WI) was used to acquired 3D volumetric cardiac-gated cine (bSSFP/FIESTA) MRI datasets with the following parameters: Sagittal plane, FOV=24x24 cm, matrix size=256×256 (upsampled), TR/TE/flip-angle=2.9ms/1ms/25°, acceleration factor=8, resolution=1.2mm isotropic, peripheral pulse gating with retrospective binning to 20 cardiac phases, 120 slices for whole brain coverage, and a scan time of ~2:30 min.
Analysis: For each subject, the voxel displacement field and amplified videos were extracted using 3D q-aMRI. Each of the outputs was compared visually (amplified videos) and quantitatively (voxel displacement maps) against a normal control to assess the brain motion. Four experts (1 neurologist, 1 radiologist and 2 neuroradiologists) were asked to classify abnormal versus normal brain motion based on the amplified videos and a normal healthy control example.
Results
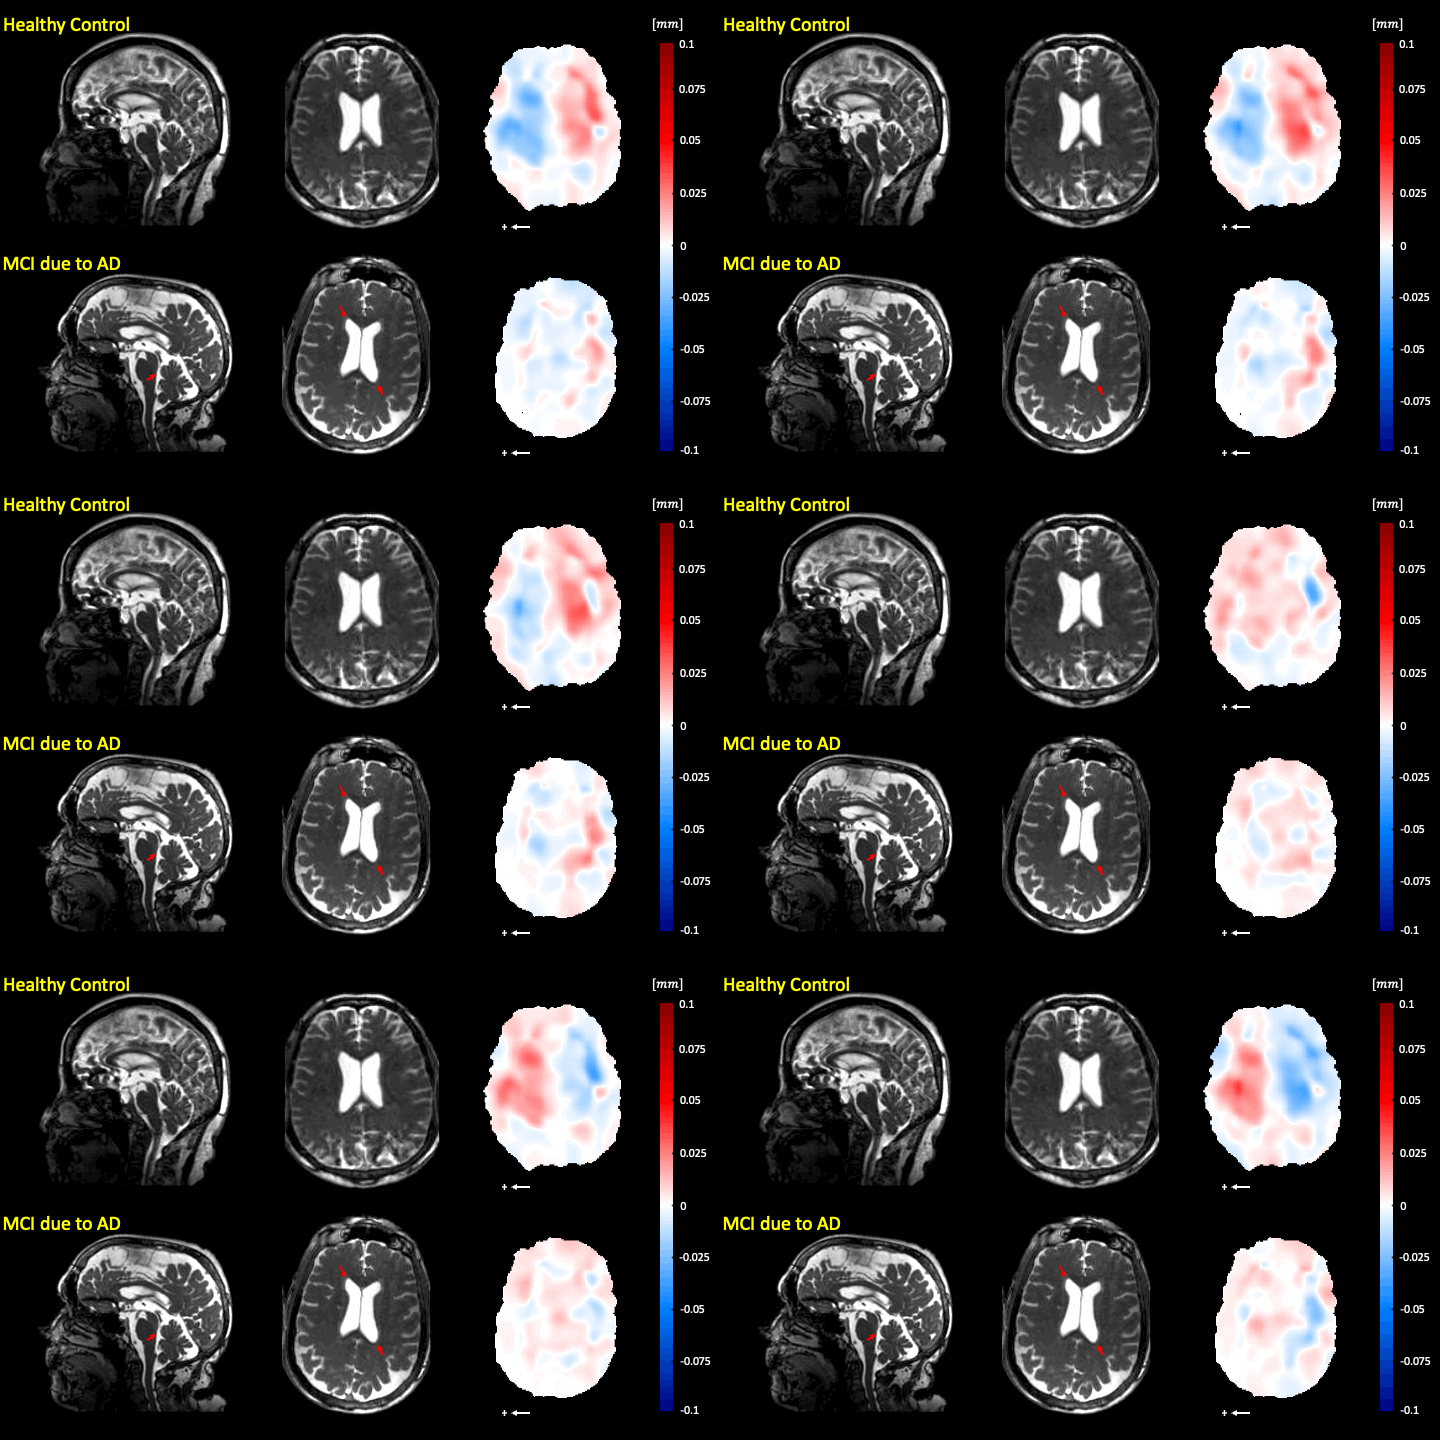
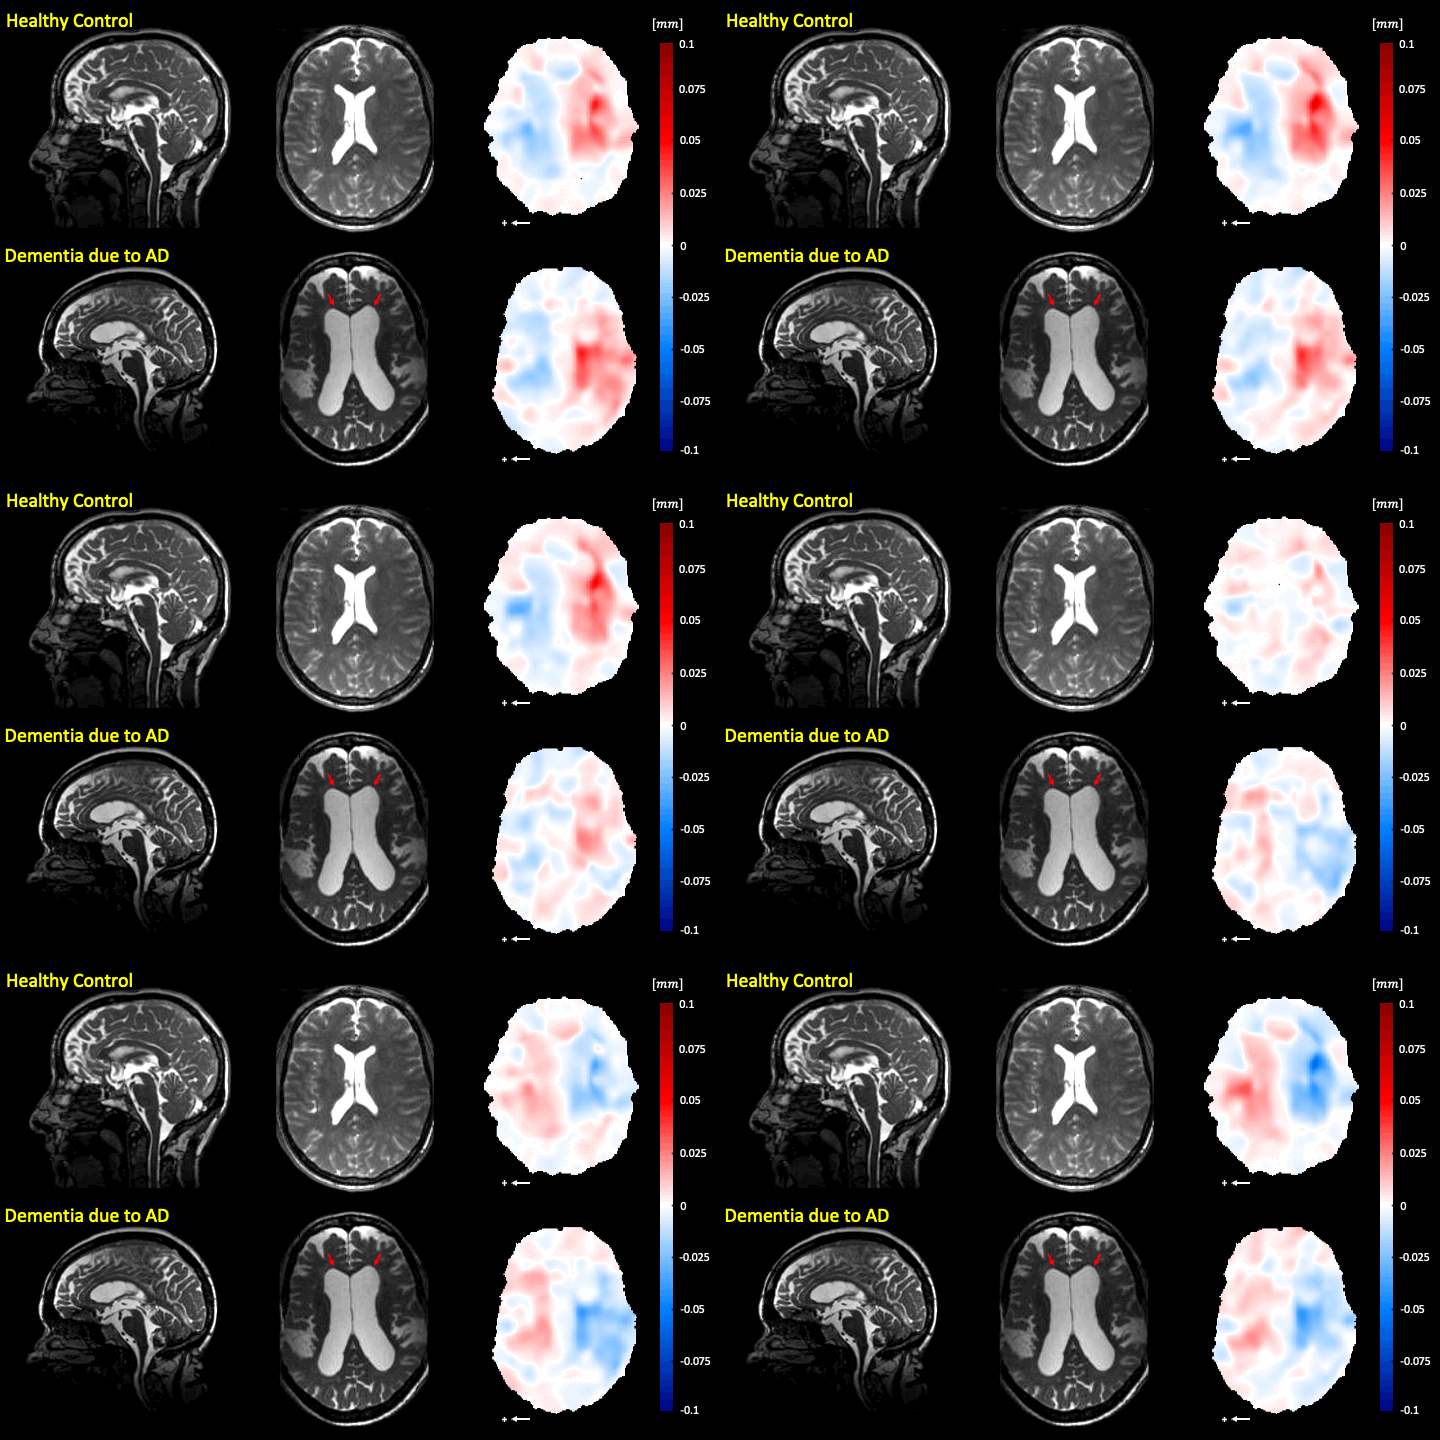
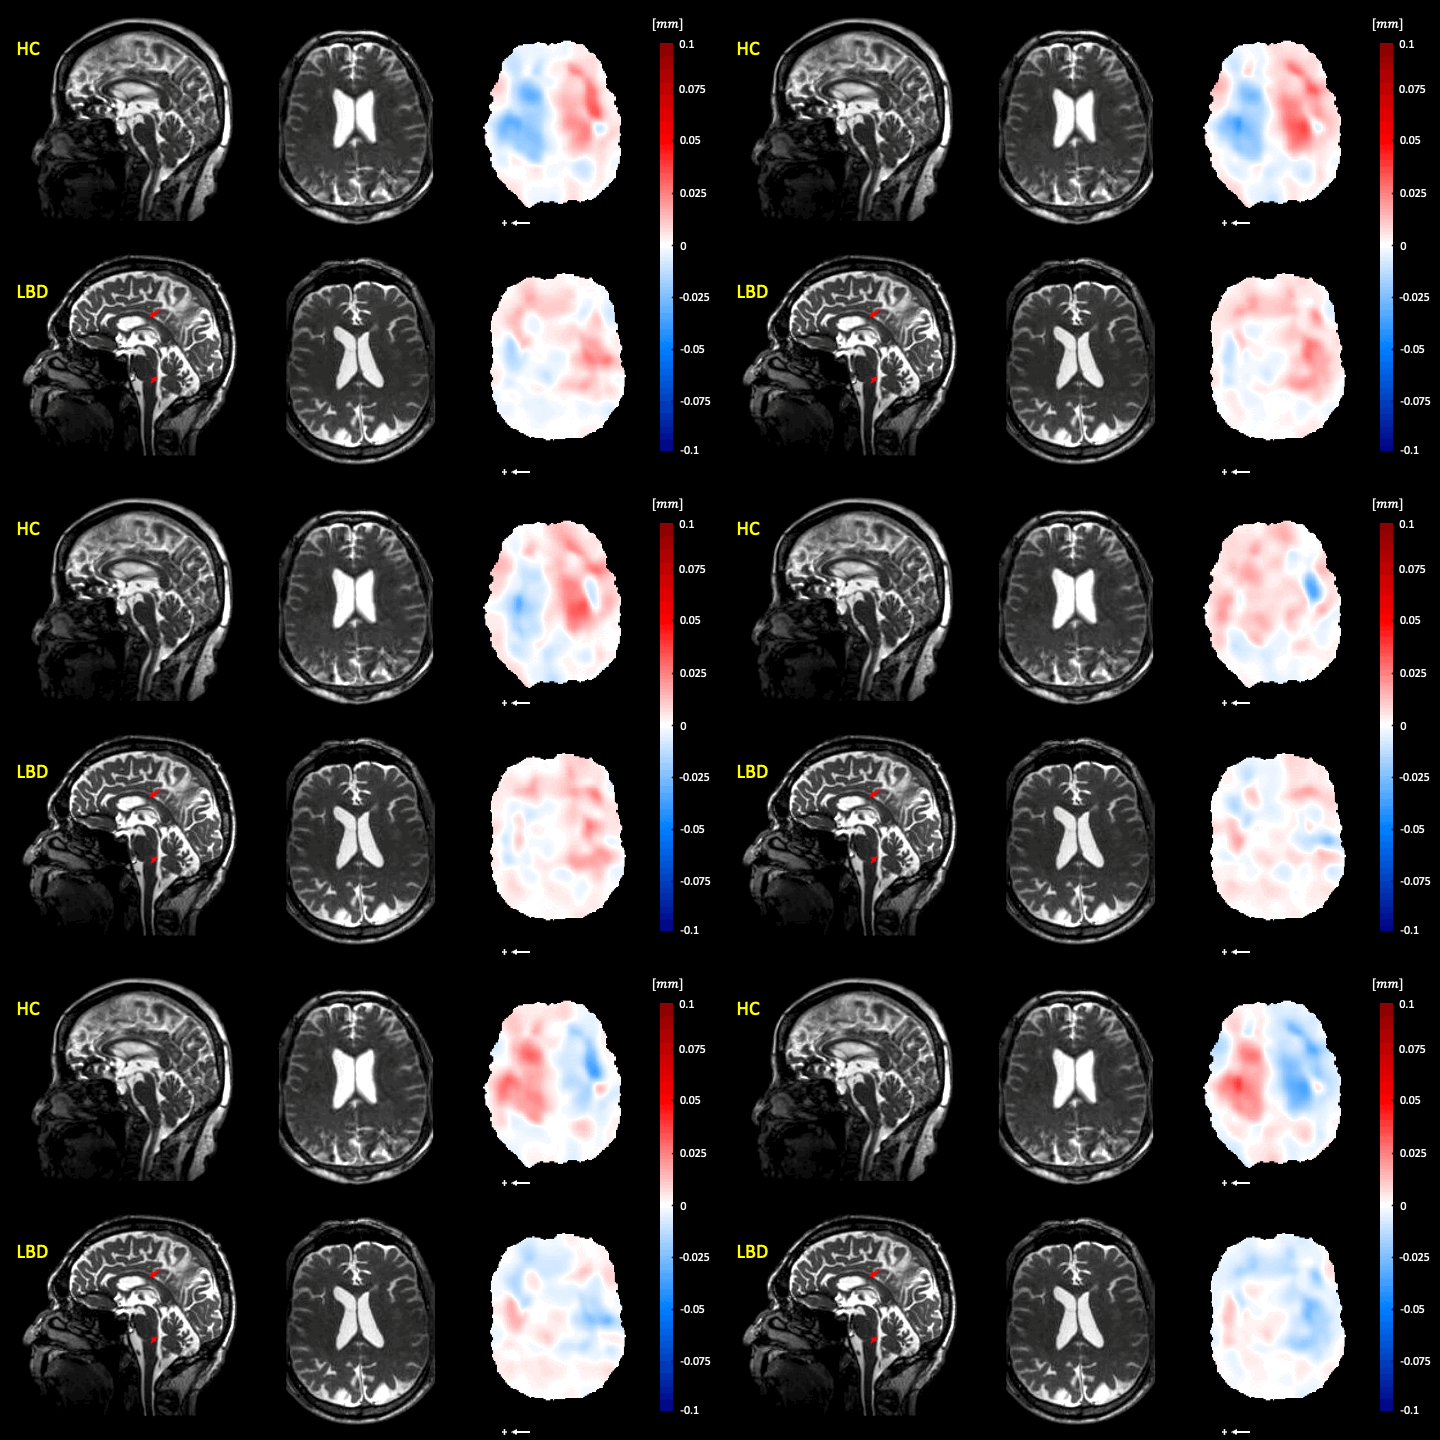
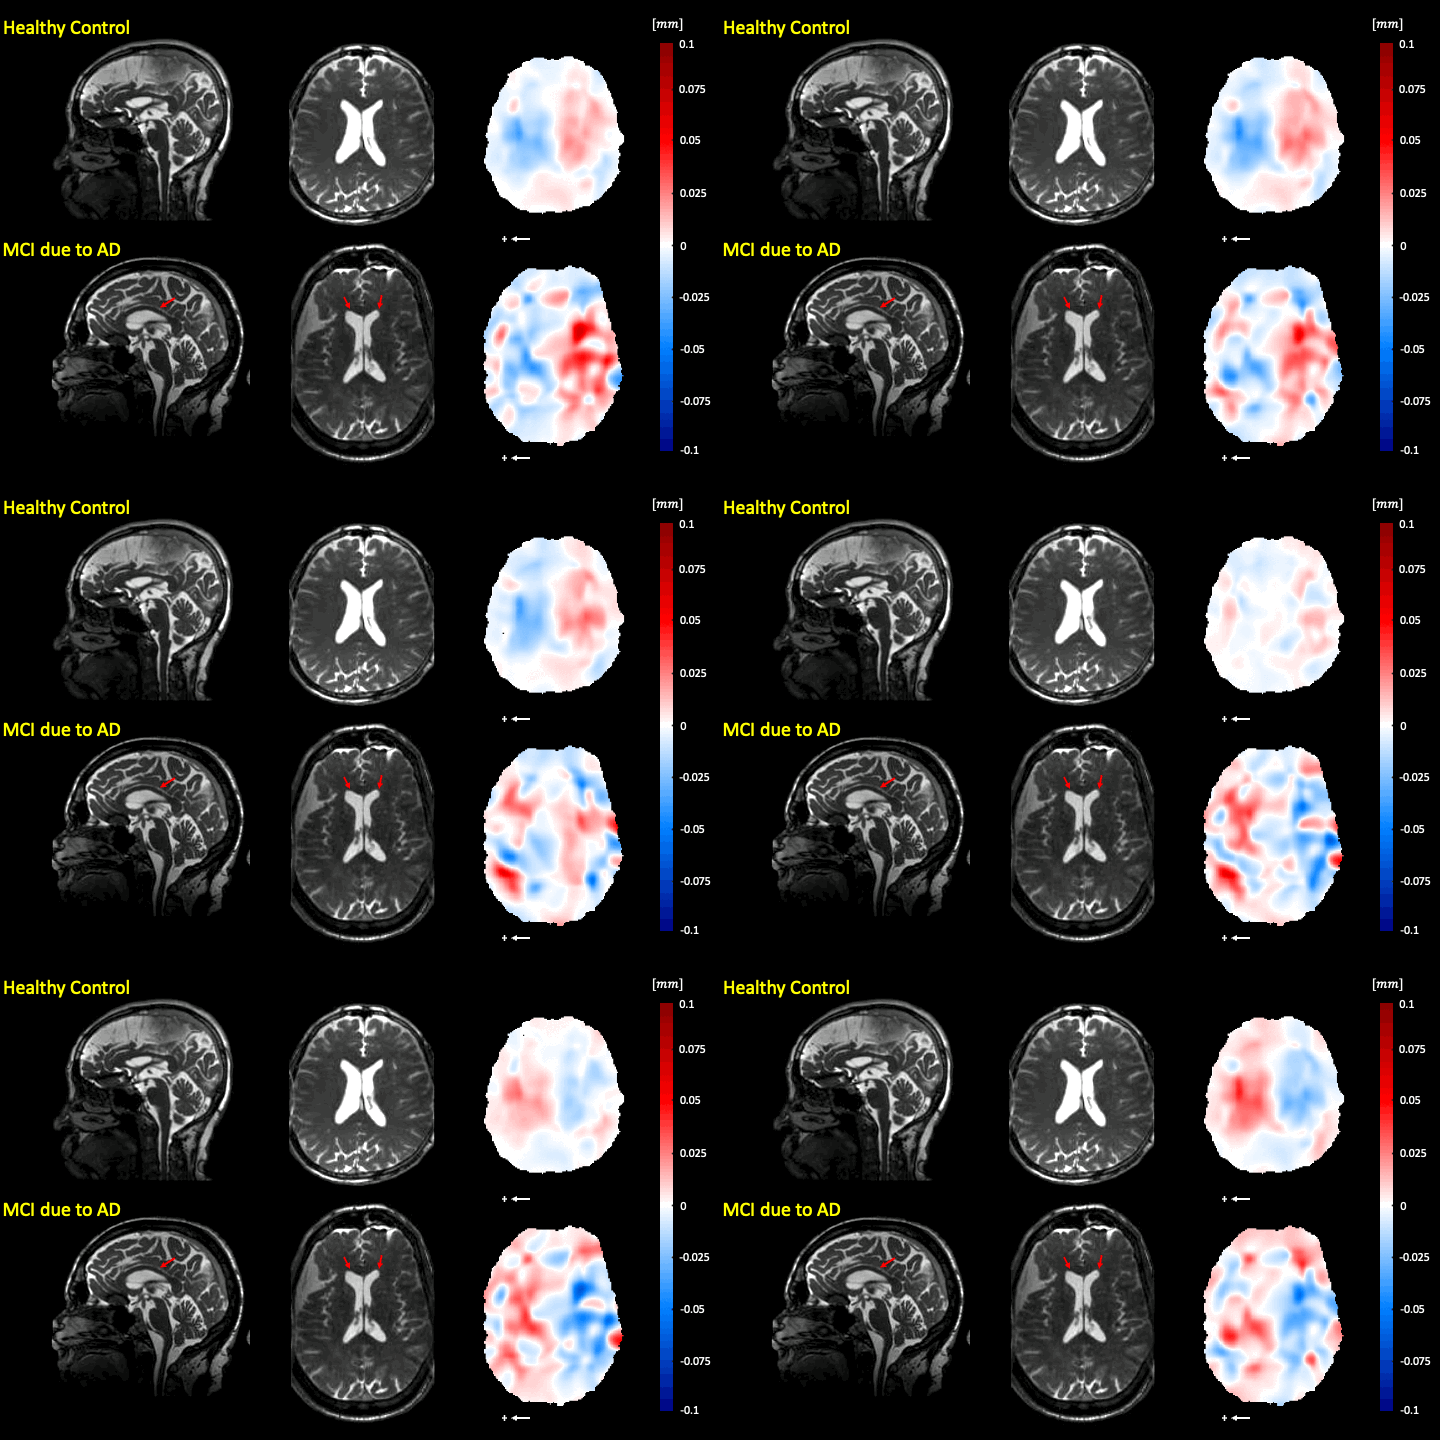
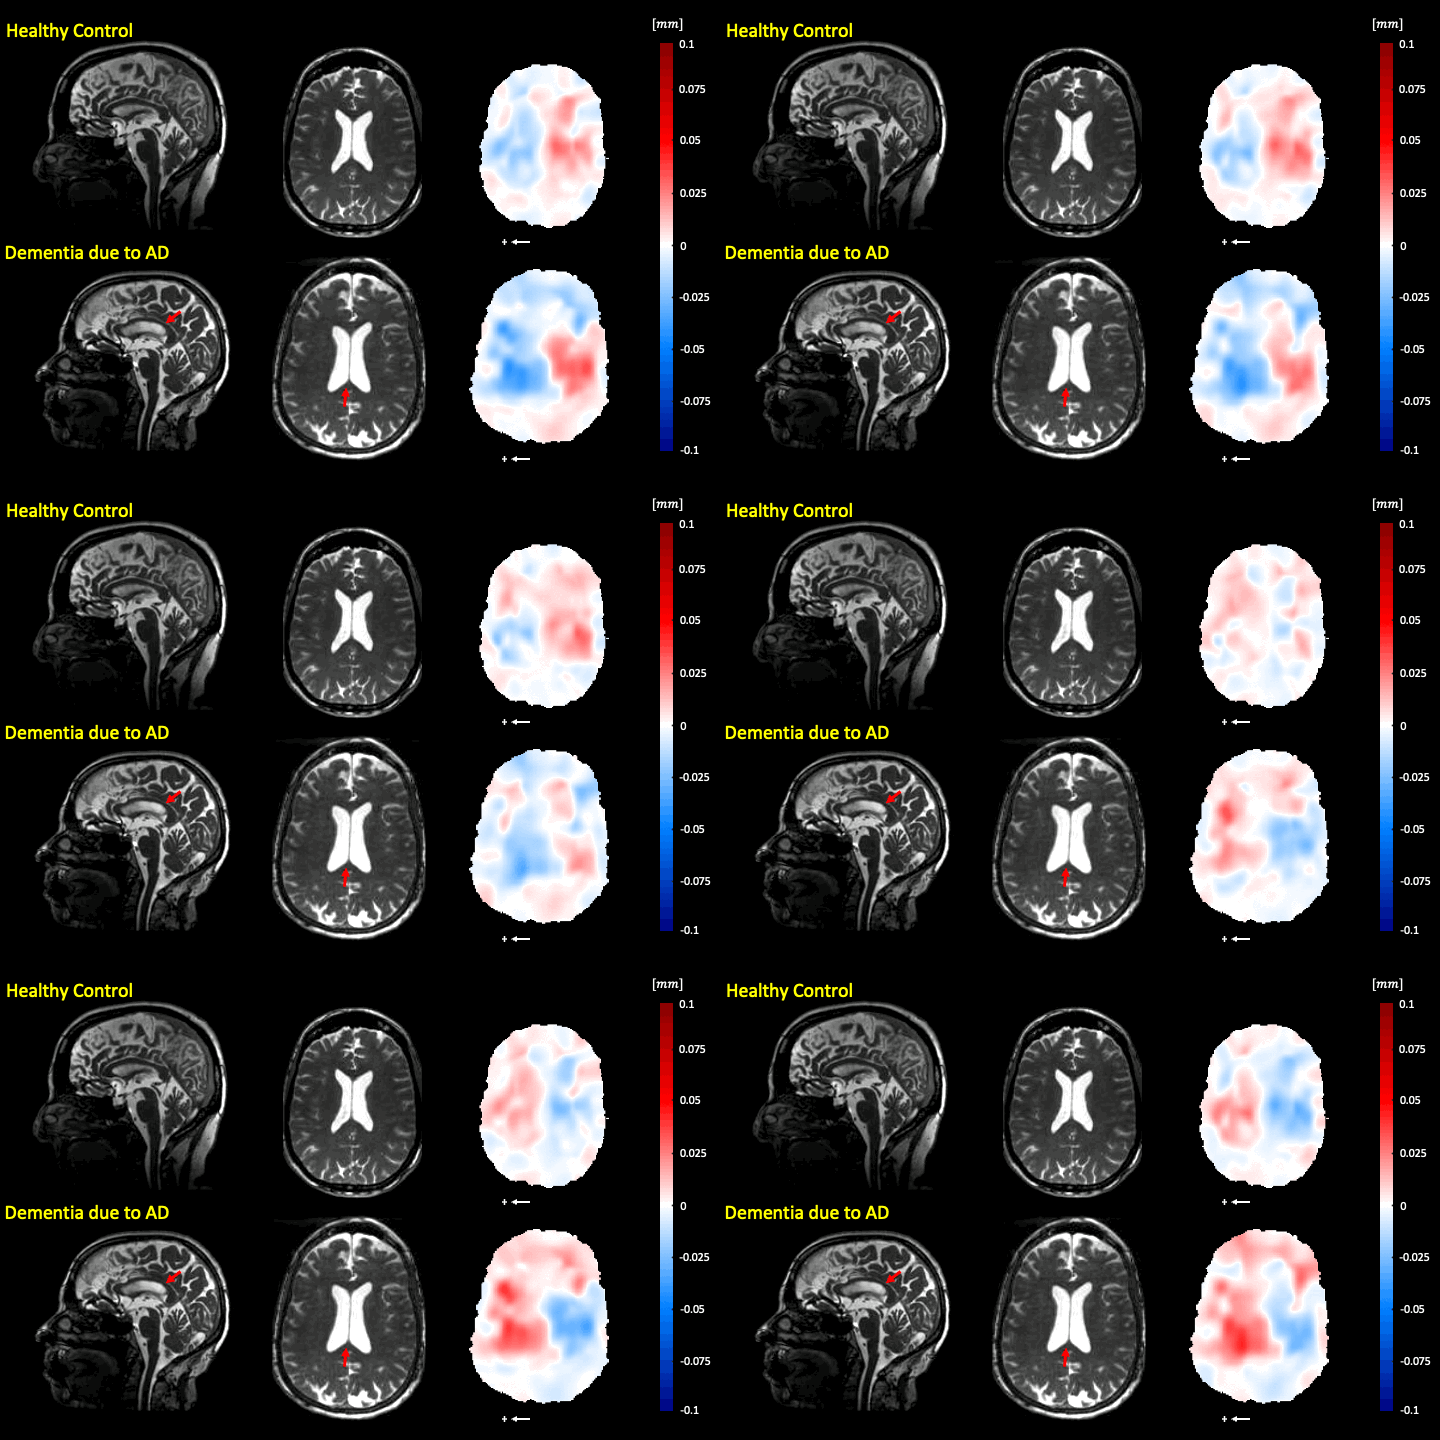
The classification results were as follows: success rate = 0.73, sensitivity = 0.63 and specificity = 1. Fig.1 shows brain motion of healthy control and MCI due to AD subjects. Diffuse reduction in brain bulk displacement on both sagittal and axial views is seen in the AD participant. Additionally, less regular ventricular brain motion is demonstrated on the displacement maps. Fig.2 shows the brain motion of healthy control and dementia due to AD. Compared to healthy control, the motion in the sagittal plane around the lateral ventricles for the dementia participant depicts motion reduction and irregularity. Fig.3 shows the brain motion of healthy control and LBD subjects. Compared to the healthy control, the motion in the sagittal plane around the aqueduct and 4rd ventricle for the LBD case depicts abnormal motion (AP direction instead of SI). Fig.4 shows the brain motion of healthy control and MCI due to AD participants. Here, the MCI participants was misclassify (false negative). Compared to the healthy control, the motion in the sagittal plane around the lateral ventricles for the MCI case is abnormal. In addition, the motion in the axial plane is asymmetric and wobbly. Fig.5 shows the brain motion of healthy control and dementia due to AD participants. Here the AD participant was misclassify (false negative). Compared to the healthy control, the motion in the sagittal plane around the lateral ventricles for the AD case is abnormal. In addition, the motion in the axial view is irregular and asymmetric.Discussion
The study used 3D q-aMRI to investigate brain dynamics in neurodegenerative diseases. While the classification results showed promise with a success rate of 0.73 and a high specificity of 1, the sensitivity was moderate at 0.63, indicating potential for improvement in correlating with neurodegenerative disease. We believe that better training of the experts would have resulted in better sensitivity, since abnormal brain motion was detected in 3 out of the 4 cases that were miss classified (false negative) as shown in Fig. 4 and Fig. 5. In all cases, abnormal brain motion was detected compared to healthy controls. In the sagittal plane, incoherent abnormal (differ from the usual piston-like ) motion was seen in the lateral ventricles, corpus callosum, aqueduct, and 4rd ventricle. In the axial plane, abnormal motion was detected mainly around the lateral ventricles, which exhibited diffuse and asymmetric motion compared to healthy controls. Some cases were also associated with general reduction in brain motion. Our preliminary study suggests that abnormal pulsatile brain motion might correlate with changes associated with cognitive decline, however further research is warranted in this area.Conclusion
The study's innovative use of 3D q-aMRI for visualizing and quantifying brain dynamics in neurodegenerative diseases shows promise as a valuable diagnostic tool. But it also highlights the need for sensitivity enhancement. Further research is necessary for more accurate diagnosis and progression monitoring in these conditions – but this approach represents an exciting step toward an improved understanding and diagnosis in the field.Acknowledgements
This material is based upon work supported by the National Science Foundation Graduate Fellowship and under Grant No. 1828993; NIH RO1MH116173; RO1EB019437; U01EBO025162; P41EBO30006; The Royal Society of New Zealand Marsden Fund; NIH (R21NS111415); and the Kānoa - Regional Economic Development & Investment Unit, New Zealand. We are grateful to Mātai Ngā Māngai Māori and to our research participants for dedicating their time toward this study. We would like to acknowledge the support of GE Healthcare.References
1. Holdsworth SJ, Rahimi MS, Ni WW, Zaharchuk G, Moseley ME. Amplified magnetic resonance imaging (aMRI). Magnetic Resonance in Medicine 2016;75:2245–2254 doi: 10.1002/mrm.26142.
2. Terem I, Ni WW, Goubran M, et al. Revealing sub-voxel motions of brain tissue using phase-based amplified MRI (aMRI). Magnetic Resonance in Medicine 2018;80:2549–2559 doi: 10.1002/mrm.27236.
3. Terem I, Dang L, Champagne A, et al. 3D amplified MRI (aMRI). Magn. Reson. Med. 2021;86:1674–1686.
4. Abderezaei J, Pionteck A, Terem I, et al. Development, calibration, and testing of 3D amplified MRI (aMRI) for the quantification of intrinsic brain motion. Brain Multiphysics 2021;2:100022 doi: 10.1016/j.brain.2021.100022.
5. Kumar H, Terem I, Kurt M, Kwon E, Holdsworth SJ, Amplified MRI and Physiological Brain Tissue Motion. In Motion Correction in MRI. Ed: J.B Andre & A. Van der Kouwe, Elsevier. 2022.
6. Abderezaei J, Pionteck A, et al. Increased Hindbrain Motion in Chiari Malformation I Patients Measured Through 3D Amplified MRI (3D aMRI). medRxiv, https://doi.org/10.1101/2022.10.25.22281481 (2022).
7. Abderezaei J, Martinez J, Terem I, et al. Amplified Flow Imaging (aFlow): A Novel MRI-Based Tool to Unravel the Coupled Dynamics Between the Human Brain and Cerebrovasculature. IEEE Trans. Med. Imaging 2020;39:4113–4123.
8. Champagne AA, Peponoulas E, Terem I, et al. Novel strain analysis informs about injury susceptibility of the corpus callosum to repeated impacts. Brain Communications, Volume 1, Issue 1, 2019, fcz021.
9. Terem I, Wang N, Condron P, et al. 3D quantitative-amplified Magnetic Resonance Imaging (3D q-aMRI). ISMRM Annual Meeting, 2023, Toronto.
Figures